Home » Others Courses » Data Analytics Training in Kolkata

Data Analytics Training in Kolkata

(4.8) 21746 Ratings
  • Enroll in the Data Analytics Training in Kolkata to develop practical data analysis skills.
  • Learn essential Data Analytics concepts, including data collection, statistical analysis, and data reporting.
  • Gain hands-on experience through real-time Data Analytics projects and practical training.
  • Ideal for aspiring Data Analysts, Business Analysts, Data Professionals, and job seekers in Kolkata.
  • Choose from Flexible Batch Timings, including weekday, weekend, and fast-track learning schedules.
  • Benefit from Placement Assistance, Interview Preparation, and industry-recognized Data Analytics Certification.

Course Duration

60+ Hrs

Live Project

3 Project

Certification Pass

Guaranteed

Training Format

Live Online (Expert Trainers)
Quality Training With Affordable Fee

⭐ Fees Starts From

INR 38,000
INR 18,500

12987+

Professionals Trained

12+

Batches every month

3986+

Placed Students

287+

Corporate Served

What You'll Learn

Develop a strong understanding of Data Analytics through practical training in data collection, cleaning, processing, visualization, and reporting.

Master essential Data Analytics concepts, including data types, data preprocessing, data interpretation, dashboards, and visualization techniques.

Acquire industry-relevant skills in data preparation, data transformation, statistical techniques, dashboard development, and report generation.

Gain practical exposure through real-world Data Analytics projects involving data preparation,visualization, dashboard development, and reporting.

Learn advanced Data Analytics techniques such as predictive analysis, trend forecasting, interactive data visualization, and actionable business insights.

Enhance your career opportunities with industry-focused Data Analytics training in Kolkata and prepare for roles such as Data Analyst, and Reporting Analyst.

Overview of Data Analytics Course in Kolkata

Data Analytics Training in Kolkata offers a comprehensive, practical learning journey to develop expertise in data preparation, and business intelligence. The program covers essential tools and technologies such as Microsoft Excel, SQL, Python, R Programming, Power BI, Tableau, and Google Looker Studio. Through hands-on assignments, real-world datasets, interactive dashboard development, analytical exercises, and industry-based projects, learners gain the ability to convert raw data into valuable business insights. This training program is ideal for fresh graduates, aspiring Data Analysts, business professionals, software employees, and career-oriented individuals looking to acquire job-ready data analytics skills, gain practical industry exposure, and improve their analytical and problem-solving abilities in Kolkata.

Additional Info

Upcoming Future Transformations for Data Analytics Training in Kolkata

  • Artificial intelligence is transforming analytics with automated reporting, predictive insights, anomaly detection, and forecasting. These tools reduce repetitive work, help teams examine large datasets, improve accuracy, speed decisions, and reveal patterns across business operations.
  • Cloud analytics offers scalable storage, flexible processing, and easy access to business information. Services such as Azure support reporting, integration, and advanced analysis, helping organizations manage growing datasets securely and streamline analytical workflows.
  • Real-time analytics provides insights from changing data. Teams monitor transactions, customer activity, operations, and performance indicators as events happen. Streaming technologies and dashboards reveal changes quickly, helping businesses make faster, informed decisions.
  • Growing volumes of structured and unstructured data increase demand for big data technologies. Apache Spark processes massive datasets across distributed systems, helping professionals build scalable pipelines, manage complex information, and generate useful business insights.
  • Machine learning enhances analytics by identifying patterns, classifying data, forecasting outcomes, and generating recommendations. With Python, professionals develop models for customer analysis, risk evaluation, demand forecasting, and improved operational planning.
  • Self-service business intelligence lets users explore data and create reports with less reliance on technical teams. Power BI and Tableau offer interactive dashboards and reusable data models to monitor KPIs, compare results, identify trends, and share findings efficiently.
  • Reliable analytics depends on strong data quality, governance, security, and consistency. Validation rules, access controls, metadata, and monitoring maintain trustworthy datasets, helping professionals produce accurate reports, protect information, and meet compliance requirements.
  • Data visualization combines interactive storytelling with intelligent dashboards, moving beyond basic charts. Tools display trends, KPIs, maps, filters, and reports, helping decision-makers understand findings quickly and communicate insights clearly across business teams.
  • Businesses are moving beyond reviewing past performance to forecasting outcomes and choosing actions. Predictive analytics estimates trends, while prescriptive analytics guides decisions. Both support demand forecasting, customer strategies, risk assessment, and resource planning.
  • Growing use of AI, cloud services, visualization, and big data is creating analytics careers. Opportunities include Data Analyst, BI Developer, Data Consultant, and Data Engineer. Skills in SQL, Python, Excel, visualization, and cloud platforms help professionals prepare.

Building Tools and Techniques with Data Analytics Internship Training

  • Microsoft Excel is widely used to organize, clean, analyze, and present business data. Learners practice formulas, Pivot Tables, lookup functions, conditional formatting, Power Query, charts, and dashboards. Hands-on exercises develop the ability to manage datasets, identify patterns, prepare reports, and communicate meaningful analytical findings.
  • SQL helps professionals retrieve, filter, transform, and analyze information stored in relational databases. Training covers joins, subqueries, aggregate functions, window functions, sorting, and data manipulation. Practical exercises using MySQL, PostgreSQL, and SQL Server strengthen database querying, reporting, business analysis, and data preparation skills.
  • Python enables flexible data analysis through powerful programming libraries and automation features. Learners explore Pandas, NumPy, Matplotlib, Seaborn, Plotly, and Jupyter Notebook to clean datasets, perform exploratory analysis, create visualizations, and automate repetitive activities while developing a foundation for predictive analytics and machine learning.
  • R programming supports statistical computing, visualization, and analytical modeling across different industries. Learners practice probability, regression, correlation, hypothesis testing, clustering, and forecasting using R libraries. Practical exercises demonstrate how statistical methods help interpret complex datasets and solve analytical requirements in finance, healthcare, research, and business.
  • Power BI enables professionals to convert information from multiple sources into interactive dashboards and reports. Training includes Power Query, data modeling, relationships, DAX calculations, visualizations, and publishing. Learners connect spreadsheets, databases, and cloud platforms to monitor KPIs, recognize trends, and communicate business performance through meaningful reports.
  • Tableau offers advanced capabilities for visual analysis, dashboard development, and interactive reporting. Learners practice creating charts, maps, calculated fields, filters, parameters, and analytical stories. Hands-on dashboard activities improve data presentation, analytical thinking, and reporting skills while helping professionals communicate complex findings clearly.
  • Microsoft Azure provides cloud services for storing, integrating, processing, and analyzing information. Learners explore Azure Data Factory, Synapse Analytics, Data Lake, and Azure SQL. Practical activities introduce cloud pipelines, scalable processing, secure integration, and analytical environments used to manage enterprise data workloads and reporting requirements.
  • Google Looker Studio helps professionals develop interactive dashboards and reports using connected data sources. Learners practice charts, filters, calculated fields, report layouts, and dataset integration. Connections with Google Analytics, Google Ads, BigQuery, and spreadsheets support marketing analysis, performance monitoring, business reporting, and effective data visualization.
  • Apache Spark supports distributed computing and large-scale data processing across modern analytical environments. Learners explore Spark architecture, DataFrames, Spark SQL, streaming, and processing techniques. Practical exercises demonstrate efficient handling of massive datasets, preparing professionals for opportunities involving big data platforms and enterprise analytics.
  • Statistical analysis and machine learning combine mathematical methods with predictive techniques to uncover valuable insights. Learners explore classification, clustering, regression, forecasting, hypothesis testing, and predictive modeling. These skills help identify patterns, evaluate trends, develop analytical solutions, and prepare for advanced data and business intelligence roles.

Roles and Responsibilities of Data Analytics Professionals

  • A Data Analytics Consultant translates business requirements into effective analytical solutions. They evaluate data sources, establish reporting needs, define KPIs, and recommend suitable tools. Using SQL, Python, Excel, Power BI, Tableau, and cloud platforms, they develop dashboards, present findings, collaborate with stakeholders, and support informed business decisions.
  • A Data Analyst gathers, cleans, validates, transforms, and examines datasets to discover meaningful business insights. Using SQL, Excel, Python, Power BI, Tableau, and statistical methods, they prepare reports, monitor KPIs, identify trends, verify data accuracy, and communicate findings that help teams evaluate performance and improve operational decisions.
  • A Business Intelligence Developer builds reporting systems, analytical dashboards, and data models for business users. They work with Power BI, Tableau, SQL, ETL processes, and multiple data sources to develop reporting solutions. Their responsibilities include query optimization, data integration, automated reporting, and maintaining reliable BI environments for performance monitoring.
  • A Python Data Analyst applies programming techniques to data cleaning, automation, visualization, and advanced analysis. Using Pandas, NumPy, Matplotlib, Seaborn, and Scikit-learn, they develop analytical workflows, prepare features, integrate APIs, automate reports, perform exploratory analysis, and support predictive modeling requirements across different business functions.
  • An R Programmer or Statistical Analyst uses statistical techniques to examine datasets and generate meaningful findings. Their responsibilities include regression, correlation, hypothesis testing, forecasting, clustering, and visualization. They apply R libraries to develop analytical models and reports for finance, healthcare, research, and business environments while ensuring accurate interpretation of results.
  • A Power BI Developer creates interactive dashboards and business reports using Power BI Desktop and Service. They develop data models, DAX measures, Power Query transformations, visualizations, and scheduled refresh processes. Their work involves connecting databases, spreadsheets, and cloud systems while maintaining reporting accuracy, performance, security, and accessibility.
  • A Tableau Developer converts business information into interactive dashboards and visual reports. They create calculated fields, filters, parameters, maps, charts, and analytical stories according to reporting needs. Their responsibilities include data blending and dashboard optimization, helping users understand complex information and monitor financial, customer, and operational performance.
  • An Azure Data Engineer or Analyst develops cloud-based data solutions using Azure Data Factory, Synapse Analytics, Data Lake, and Azure SQL. Their responsibilities include building pipelines, integrating sources, managing storage, supporting analytical workloads, and improving processing efficiency while maintaining scalable environments for enterprise reporting and data operations.
  • A Data Visualization Specialist presents complex information through clear, engaging visual formats. Using Power BI, Tableau, Excel, and Looker Studio, they create charts, KPI dashboards, reports, and interactive presentations. Their work includes selecting suitable visuals, improving dashboard usability, simplifying findings, and helping teams communicate important business insights effectively.
  • A Machine Learning Analyst uses predictive techniques to discover patterns and estimate future business outcomes. With Python and machine learning libraries, they prepare datasets, select features, train models, evaluate performance, and interpret results. Their solutions support forecasting, segmentation, fraud detection, recommendations, and predictive maintenance across business operations.

Top Companies Hiring for Data Analytics Professionals

  • Deloitte offers analytics opportunities across consulting, reporting, data transformation, and business intelligence projects. Professionals work with SQL, Python, Excel, Power BI, Tableau, and cloud platforms to develop dashboards, automate reports, perform predictive analysis, and deliver insights for finance, healthcare, retail, technology, and other business sectors.
  • EY provides analytics career opportunities in business intelligence, financial analysis, risk assessment, and digital transformation. Professionals use SQL, Python, Power BI, Tableau, and Looker Studio to prepare datasets, automate reports, develop dashboards, evaluate performance, and generate actionable insights that address enterprise reporting and analytical requirements.
  • KPMG offers career opportunities in business intelligence, financial reporting, risk analysis, and analytics consulting. Professionals use Power BI, Tableau, SQL, Excel, Python, and R to prepare datasets, develop dashboards, examine trends, automate reporting activities, and deliver structured analytical solutions that support business operations and informed decision-making.
  • HCL Technologies provides analytics opportunities across enterprise data, cloud computing, automation, and digital technology projects. Professionals work with Python, SQL, Azure services, Power BI, and Apache Spark to develop pipelines, process large datasets, create dashboards, automate analytical tasks, and support modern enterprise data processing environments.
  • Capita offers analytics-related roles in business intelligence, reporting, visualization, and operational analysis. Professionals use Power BI, Tableau, SQL, Excel, and Looker Studio to examine datasets, build dashboards, monitor performance, automate reports, interpret information, and prepare meaningful insights that help organizations improve operational efficiency and business decisions.
  • Tech Mahindra provides opportunities in analytics, digital transformation, reporting, and data-driven technology projects. Professionals use Python, SQL, Power BI, Tableau, cloud services, and advanced analytics platforms to integrate information, develop visual reports, perform predictive analysis, automate reporting processes, and deliver solutions for enterprise business requirements.
  • Hitachi Vantara works with enterprise data solutions, cloud analytics, and large-scale information systems. Analytics professionals use SQL, Python, Apache Spark, Azure services, and visualization platforms to develop data pipelines, process information, create reports, support cloud-based solutions, and manage scalable environments for analyzing complex datasets.
  • NTT DATA offers opportunities in business intelligence, consulting, data modernization, and enterprise analytics. Professionals use SQL, Python, Power BI, Tableau, and cloud technologies to prepare datasets, develop dashboards, monitor performance, automate analytical processes, and deliver reporting solutions across different industries and business functions.
  • DXC Technology provides analytics career opportunities in cloud data, enterprise reporting, business intelligence, and digital technology initiatives. Professionals work with SQL, Python, Azure services, Power BI, and analytical platforms to develop dashboards, integrate information sources, automate reports, build data workflows, and maintain scalable enterprise analytics environments.
  • Oracle offers analytics opportunities involving cloud platforms, database technologies, enterprise reporting, and business intelligence solutions. Professionals use SQL, Python, cloud services, and analytical applications to develop data models, create reports, automate analytical processes, and support organizations in managing operational information and strategic reporting requirements.
View more

Data Analytics Course Objectives

Data Analytics Training in Kolkata provides learners with practical knowledge of converting raw data into meaningful business information. The program covers data cleaning, preparation, statistical techniques, visualization, dashboard development, and reporting using tools such as Microsoft Excel, SQL, Python, Power BI, and Tableau. Participants learn to analyze datasets, identify patterns, and communicate valuable insights to support business decisions.
Data Analytics plays an important role in helping businesses evaluate performance, understand customer behavior, recognize market trends, and make informed decisions. Learning technologies such as SQL, Python, Power BI, Tableau, and cloud analytics platforms equips professionals with practical capabilities to analyze different types of business data and contribute to data-driven organizational strategies.
Completing Data Analytics Training can help learners explore opportunities in business intelligence, data visualization, reporting, and analytical operations. Based on their knowledge and experience, candidates can pursue positions such as Data Analyst, Business Intelligence Analyst, Reporting Analyst, Power BI Developer, Tableau Developer, Data Engineer, and Junior Data Scientist. Additional expertise in automation, cloud technologies, and machine learning can help expand their career possibilities.
  • Basic computer knowledge and enthusiasm for learning data-related concepts.
  • A fundamental understanding of mathematics, numerical concepts, and logical reasoning.
  • Basic experience with spreadsheets and handling numerical information can be beneficial.
  • Previous programming or coding knowledge is not mandatory for beginners.
Yes, the course includes practical exercises and project-based learning designed around real-world analytical scenarios. Participants can work on sales analysis dashboards, customer segmentation, financial data reporting, business performance evaluation, and trend analysis. These projects help learners understand data cleaning, visualization, pattern identification, dashboard creation, and presenting meaningful analytical results.
  • Microsoft Excel for Data Analysis and Business Reporting
  • SQL Queries, Database Management, and Data Extraction
  • Python Programming for Data Analysis
  • R Programming Concepts and Statistical Analysis
  • Power BI Reports and Interactive Dashboard Development
The Data Analytics Training program supports career development through guidance on resume preparation, technical interview practice, project development, and placement assistance. Working with industry-oriented datasets and popular analytics technologies helps learners build practical knowledge and demonstrate their capabilities when applying for entry-level and experienced Data Analytics positions.
  • Information Technology, IT Consulting, and Software Development
  • Banking, Financial Services, and Insurance
  • Healthcare, Pharmaceuticals, and Life Sciences
  • E-commerce, Retail, and Digital Business
  • Manufacturing, Supply Chain, and Logistics
A Data Analytics Certification helps demonstrate a learner's understanding of essential analytical processes, including data preparation, statistical evaluation, visualization, and reporting. When supported by practical assignments and project experience, certification can strengthen professional portfolios, highlight technical expertise, and improve readiness for opportunities in business intelligence, data reporting, and analytical roles.
  • Microsoft Excel for Data Processing and Analysis
  • SQL for Database Queries and Data Management
  • Python for Data Analysis and Automation
  • Microsoft Power BI for Business Intelligence
  • Tableau for Data Visualization and Interactive Reporting
view More view Less

Data Analytics Course Benefits

Data Analytics Training in Kolkata provides a hands-on learning experience designed to help learners convert raw data into valuable business insights. The program focuses on essential analytical processes, data cleaning, visualization, reporting, and data interpretation using industry-standard tools. Through practical Data Analytics Projects, participants gain experience working with real-world datasets, applying analytical techniques, and understanding business data workflows. The course also offers exposure to Data Analytics Internship opportunities, enabling learners to strengthen their project portfolios, gain practical industry knowledge, and develop skills relevant to Data Analyst, Business Intelligence, Reporting, and other data-driven career roles. This practical learning approach helps participants improve their analytical thinking, technical expertise, and confidence in addressing real-world business challenges.
  • Designation
  • Annual Salary
    Hiring Companies
  • 4L
    Min
  • 6L
    Average
  • 10L
    Max
  • 5L
    Min
  • 10L
    Average
  • 15L
    Max
  • 6L
    Min
  • 10L
    Average
  • 15L
    Max
  • 4L
    Min
  • 6L
    Average
  • 10L
    Max

About Data Analytics Course

The Data Analytics Training in Kolkata is designed to develop practical expertise in data interpretation, processing, visualization, statistical analysis, and business reporting. Participants gain hands-on experience with real-world datasets while learning essential techniques such as data cleaning, transformation, exploratory data analysis, dashboard creation, and meaningful insight generation. The program incorporates practical Data Analytics projects, instructor-guided assignments, visualization activities, analytical exercises, and real-time business scenarios to help learners apply their knowledge to industry requirements. Additionally, participants receive comprehensive Data Analytics study materials for continuous learning and practice, along with career-oriented guidance, interview preparation, and Data Analytics Placement Assistance to support their professional growth.

Top Skills You Will Gain
  • Data Cleaning & Preparation
  • Data Visualization & Reporting
  • Statistical Analysis & Interpretation
  • Dashboard Development
  • Data Modeling Techniques
  • Predictive Analytics Basics
  • Data Integration & Transformation
  • Business Insights Generation

12+ Data Analytics Tools

Online Classroom Batches Preferred

Weekdays (Mon - Fri)
09 - Nov - 2026
08:00 AM (IST)
Weekdays (Mon - Fri)
11 - Nov - 2026
08:00 AM (IST)
Weekend (Sat)
14 - Nov - 2026
11:00 AM (IST)
Weekend (Sun)
15 - Nov - 2026
11:00 AM (IST)
Can't find a batch you were looking for?
₹38,000 ₹18,500 10% OFF Expires in

No Interest Financing start at ₹ 5000 / month

Self Paced Training

  • 50+ Hours High-quality Video
  • 28+ Downloadable Resource
  • Lifetime Access and 24×7 Support
  • Access on Your Computer or Mobile
  • Get Certificate on Course Completion
  • 3+ Projects
12500 ₹4500

Corporate Training

  • Customized Learning
  • Enterprise Grade Learning Management System (LMS)
  • 24x7 Support
  • Enterprise Grade Reporting

Not Just Studying
We’re Doing Much More!

Empowering Learning Through Real Experiences and Innovation
Hiring
Hiring
Hiring
Hiring
Hiring
Hiring
Hiring
User
User
User
User
User
User

Data Analytics Course Curriculam

Trainers Profile

Data Analytics Training in Kolkata emphasizes practical, industry-oriented learning under the guidance of experienced trainers specializing in data analysis, visualization, business intelligence, reporting, and statistical methods. The training sessions combine expert instruction with hands-on exercises, real-world datasets, and business-focused analytical scenarios to help participants understand how data is collected, processed, interpreted, and presented for effective decision-making. Learners also receive comprehensive Data Analytics course materials covering essential technologies such as SQL, Python, Power BI, Tableau, Pandas, NumPy, and other widely used analytics tools. This hands-on training approach enables participants to strengthen their technical knowledge, improve analytical problem-solving abilities, and build job-ready skills for careers in data analysis, business intelligence, reporting, data visualization, and business insights.

Syllabus for Data Analytics Course Download syllabus

  • Overview of Data Analytics and its importance
  • Types of Analytics: Descriptive, Predictive, and Prescriptive
  • Data lifecycle and analytics workflow
  • Role of Data Analytics in business decision-making
  • Industry applications and career opportunities
  • Excel fundamentals for data analysis
  • Data cleaning and formatting techniques
  • Advanced formulas and functions
  • Pivot tables, charts, and reporting
  • Dashboard creation using Excel
  • Database concepts and relational databases
  • SQL queries and data retrieval techniques
  • Joins, filtering, and aggregation functions
  • Subqueries and advanced SQL concepts
  • Data extraction and reporting techniques
  • Python programming fundamentals
  • Pandas and NumPy libraries
  • Data cleaning and transformation
  • Data analysis using Python
  • Data visualization with Python libraries
  • Introduction to R Programming
  • Statistical computing concepts
  • Data analysis techniques using R
  • Regression analysis and modeling
  • Data visualization using R packages
  • Introduction to Power BI and business intelligence
  • Data importing and transformation
  • Data modeling and relationships
  • DAX functions and calculations
  • Dashboard development and report publishing
  • Introduction to Tableau visualization
  • Creating interactive dashboards
  • Data blending and filtering
  • Charts and graphical representation
  • Data storytelling techniques
  • Introduction to cloud analytics
  • Azure Data Factory fundamentals
  • Building and managing data pipelines
  • Azure storage and data processing solutions
  • Cloud-based analytics implementation
  • Probability and statistical concepts
  • Hypothesis testing techniques
  • Correlation and regression analysis
  • Data interpretation methods
  • Statistical decision-making techniques
  • Introduction to Big Data Processing
  • Apache Spark architecture and components
  • Distributed data processing concepts
  • Machine Learning fundamentals
  • Predictive analytics models and applications
(15) view More view Less
Need customized curriculum?

REAL

start
STORIES SUCCESS INSPIRATION
CAREER
UPGRADE
sowmiya

sowmiya

CAREER
UPGRADE
Rajkumar

Rajkumar

CAREER
UPGRADE
Thon

Thon

CAREER
UPGRADE
lavanya

Lavanya

Industry Projects

Project 1
Retail Sales and Business Performance Analysis

Analyze retail sales datasets using Microsoft Excel and Power BI to evaluate revenue performance, identify sales trends, compare product categories, develop interactive dashboards, track business metrics, and generate actionable insights that support informed business decisions.

Project 2
Customer Behavior and Market Segmentation

Explore customer datasets using SQL and Python Pandas to understand purchasing behavior, identify customer preferences, discover buying patterns, segment audiences based on business criteria, and generate analytical insights that help improve marketing strategies and customer engagement.

Project 3
Financial Analysis and Revenue Forecasting

Work with financial datasets using Python, NumPy, and statistical techniques to evaluate revenue performance, examine financial trends, visualize key business indicators, identify growth patterns, and develop forecasting insights that support financial planning and strategic decision-making.

Our Hiring Partner

Exam & Data Analytics Certification

  • Basic computer knowledge and familiarity with common applications.
  • Fundamental understanding of mathematics, statistics, and logical reasoning.
  • Basic experience working with spreadsheets, tables, and numerical data.
  • General awareness of databases and business-related information.
  • Prior professional experience in Data Analytics is not essential for beginners.
A Data Analytics certification validates your learning in important areas such as data preparation, statistical methods, data visualization, business reporting, and analytical techniques. It can enhance your resume, highlight your technical knowledge, and help demonstrate your ability to interpret information and generate useful insights for business applications.
A certification provides evidence of your knowledge and training, but securing employment also depends on practical expertise, technical proficiency, and interview performance. Developing real-world projects, practicing analytical problem-solving, learning industry-standard tools, and gaining hands-on experience can improve your professional readiness for Data Analytics opportunities.
  • Data Analyst
  • Business Intelligence (BI) Analyst
  • Business Data Analyst
  • Data Reporting Analyst
  • Data Visualization Analyst
  • Associate Data Scientist
Data Analytics certification helps strengthen your understanding of essential technologies and techniques, including data cleaning, SQL queries, Python programming, statistical analysis, interactive visualization, dashboard creation, and business reporting. These skills are valuable across multiple professional domains, including business intelligence, marketing analytics, financial analysis, operational reporting, and data-driven decision-making.

MNC Recognized course
complete certification
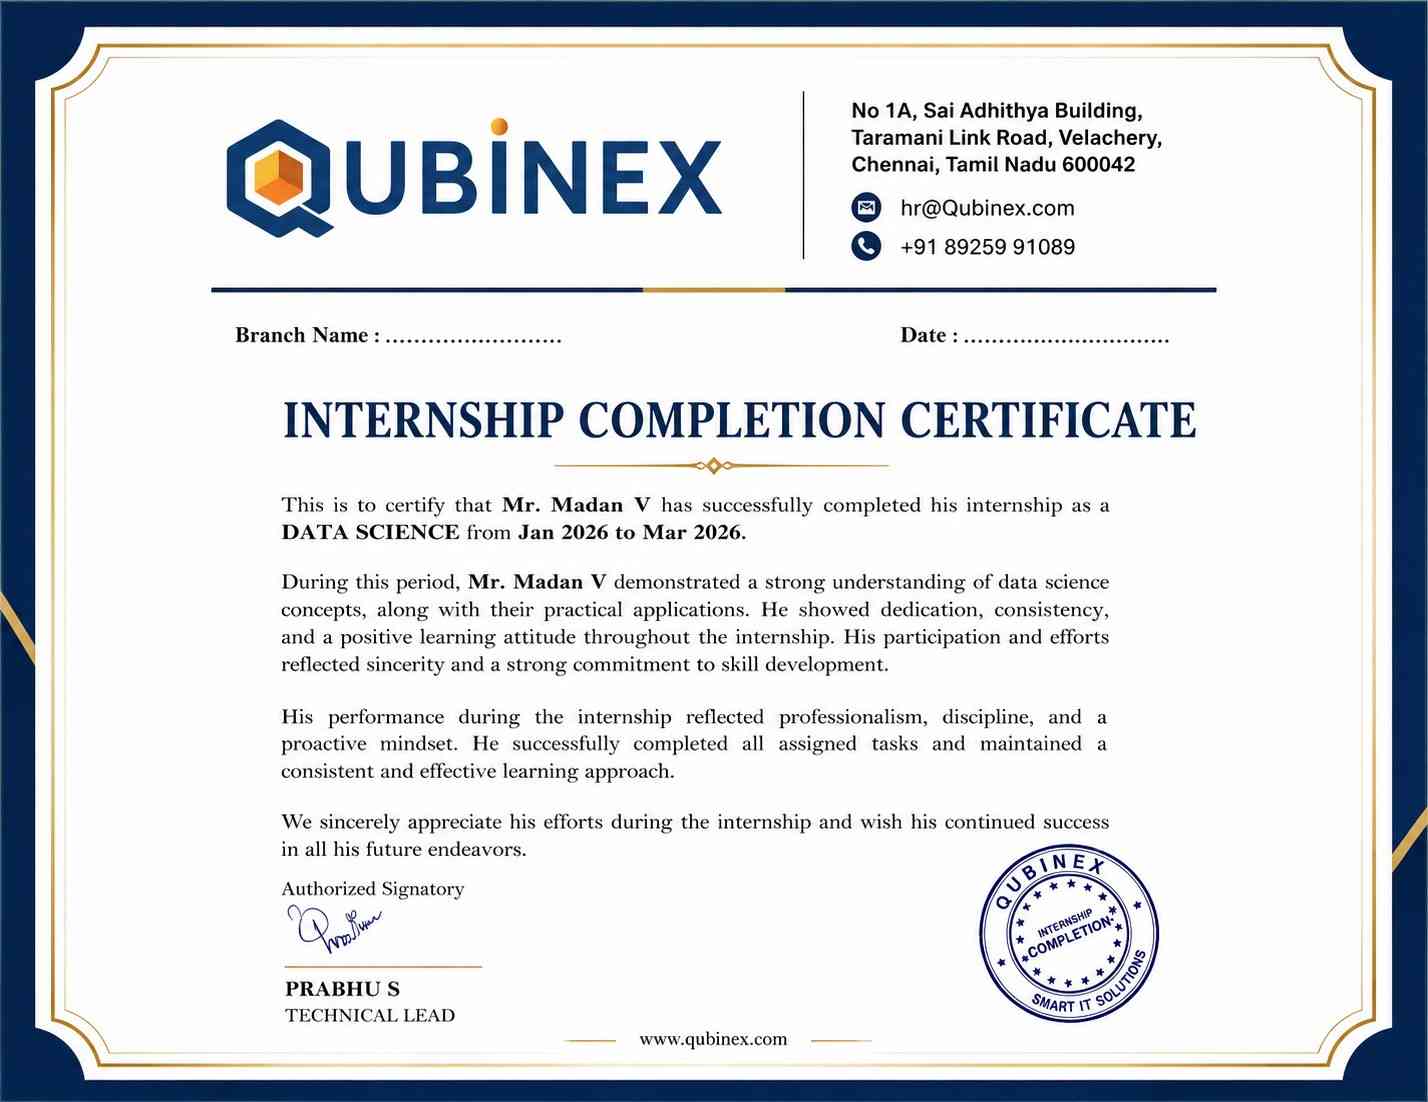
Intership
complete certification

Placement
complete certification

Our learners
transformed their careers

35 Laks
Highest Salary Offered
50%
Average Salary Hike
30K+
Placed in MNC's
15+
Year's in Training
Our Alumni
Alumni

A majority of our alumni

fast-tracked into managerial careers.

Get inspired by their progress in the Career Growth Report.

Our Student Successful Story

checkimage Regular 1:1 Mentorship From Industry Experts checkimage Live Classes checkimage Career Support

How are the Data Analytics Course with LearnoVita Different?

Feature

LearnoVita

Other Institutes

Affordable Fees

Competitive Pricing With Flexible Payment Options.

Higher Data Analytics Fees With Limited Payment Options.

Live Class From ( Industry Expert)

Well Experienced Trainer From a Relevant Field With Practical Data Analytics Training

Theoretical Class With Limited Practical

Updated Syllabus

Updated and Industry-relevant Data Analytics Course Curriculum With Hands-on Learning.

Outdated Curriculum With Limited Practical Training.

Hands-on projects

Real-world Data Analytics Project With Live Case Studies and Collaboration With Companies.

Basic Projects With Limited Real-world Application.

Certification

Industry-recognized Data Analytics Certifications With Global Validity.

Basic Data Analytics Certifications With Limited Recognition.

Placement Support

Strong Placement Support With Tie-ups With Top Companies and Mock Interviews.

Basic Placement Support

Industry Partnerships

Strong Ties With Top Tech Companies for Internships and Placements

No Partnerships, Limited Opportunities

Batch Size

Small Batch Sizes for Personalized Attention.

Large Batch Sizes With Limited Individual Focus.

Additional Features

Lifetime Access to Data Analytics Course Materials, Alumni Network, and Hackathons.

No Additional Features or Perks.

Training Support

Dedicated Mentors, 24/7 Doubt Resolution, and Personalized Guidance.

Limited Mentor Support and No After-hours Assistance.

Data Analytics Course FAQs

Yes, prospective learners can explore a demo session to understand the Data Analytics training approach, teaching methodology, and course structure. Since live sessions have limited seats to maintain effective learning and interaction, attending regular classes may require enrollment. If you are unable to attend a live demo, you can request access to a recorded training session conducted by the trainer. This will help you understand the instructional quality, practical demonstrations, and overall classroom experience before joining.
The Data Analytics training sessions at LearnoVita are conducted by experienced industry professionals with practical exposure to data analysis, business intelligence, statistical techniques, and data visualization. Trainers bring their professional knowledge into the classroom through practical demonstrations, real-world examples, project guidance, and interactive learning sessions to help participants understand industry requirements and analytical workflows.
  • LearnoVita provides career guidance to help eligible learners identify relevant job opportunities and prepare for Data Analytics positions.
  • After completing the training program, participants can receive placement assistance, including resume preparation, interview guidance, and career development support.
  • The placement support process helps candidates prepare for opportunities in organizations such as Oracle, HP, Wipro, Accenture, Google, IBM, Tech Mahindra, Amazon, CTS, TCS, Infosys, Mindtree, and Mphasis, subject to current openings and employer requirements.
  • Learners can strengthen their professional profiles by showcasing completed projects, practical assignments, technical knowledge, and relevant Data Analytics skills.
  • Career development sessions may include mock interviews, technical assessments, communication skills, and presentation practice to improve interview confidence.
  • Students can use the available learning resources and student portal to access job-related updates, study materials, training videos, recorded sessions, and interview preparation resources.
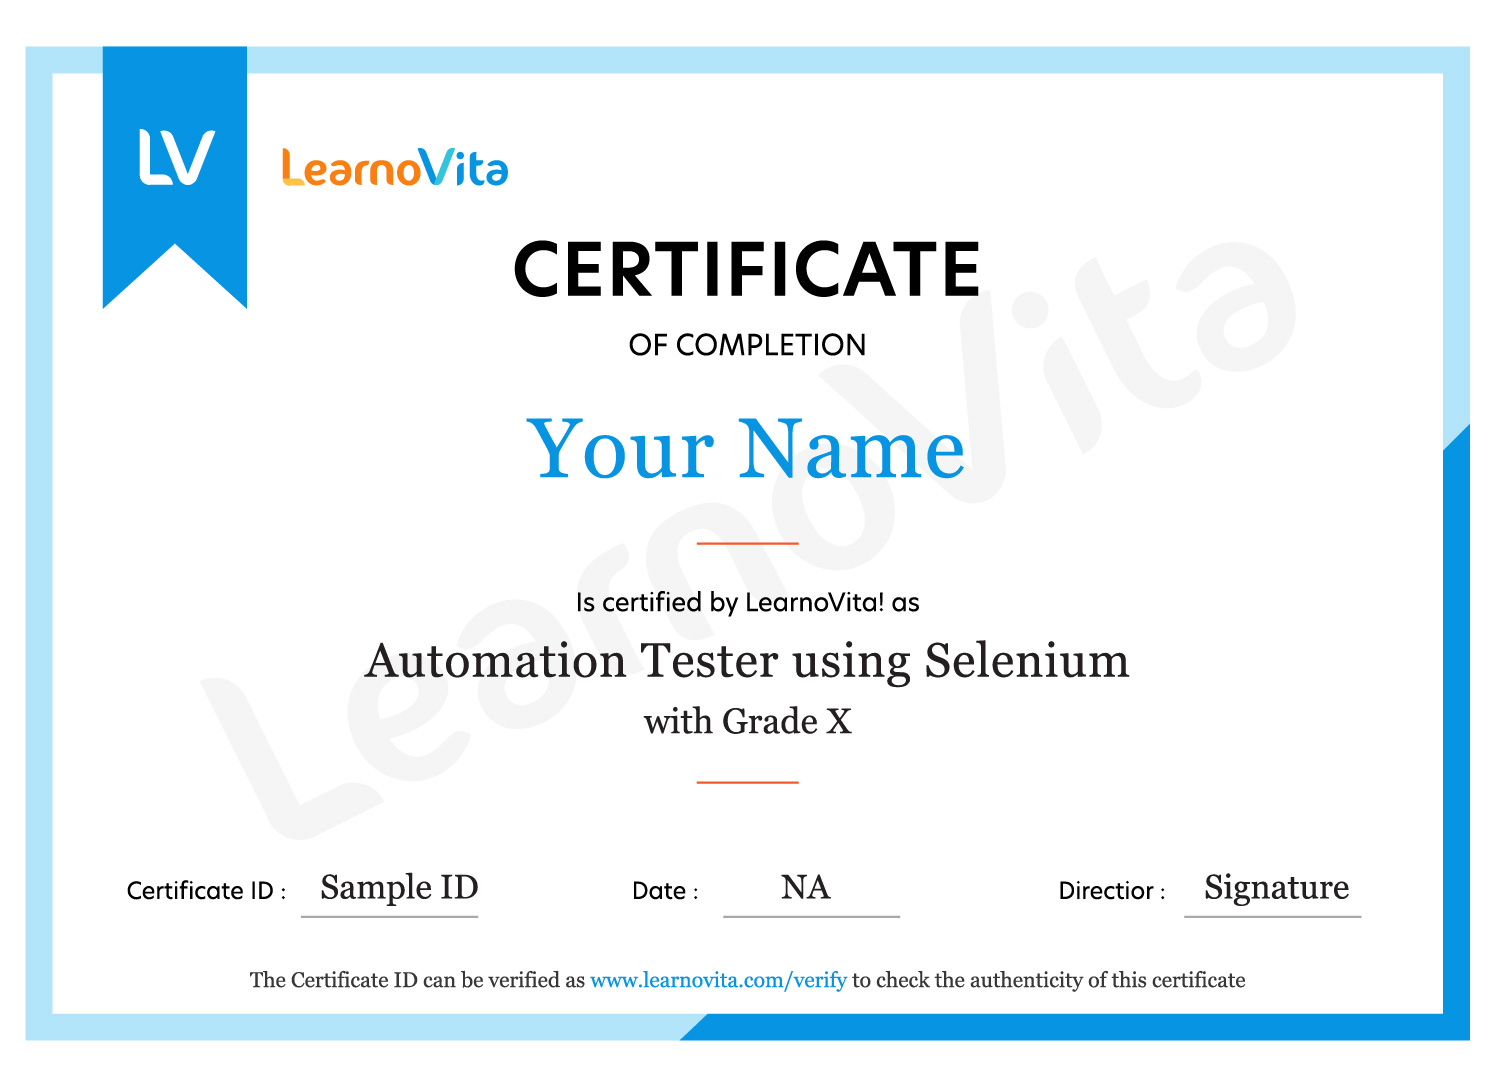
Upon successfully completing the Data Analytics training program, learners receive a course completion certificate from LearnoVita, subject to the applicable course requirements. The certification helps demonstrate your training in essential areas such as data preparation, SQL, Python, statistical analysis, Power BI, Tableau, visualization, and business reporting. Participants interested in additional industry-recognized certifications can also explore relevant certification pathways based on their career goals and eligibility requirements.
Yes, the Data Analytics training program includes practical assignments and project-based exercises designed around real-world business requirements. Learners work with datasets to perform data cleaning, transformation, exploratory analysis, statistical evaluation, dashboard creation, and reporting. Project scenarios may include retail sales analysis, customer segmentation, financial reporting, and business performance evaluation. These activities help participants develop practical analytical knowledge and understand how Data Analytics concepts are applied in professional environments.
LearnoVita offers different learning formats to accommodate the requirements and schedules of participants. Available training options may include instructor-led online classes, classroom training, self-paced learning, one-to-one sessions, fast-track programs, and customized corporate training. Each format is designed to provide flexibility while helping learners understand Data Analytics concepts through theoretical instruction, practical exercises, and project-based learning. Participants can select a suitable training schedule based on their availability, preferred learning style, and professional objectives.
LearnoVita provides learning support options to help participants catch up on missed topics and maintain their training progress. Depending on batch availability and course policies, learners may have access to three convenient alternatives: rescheduling the missed session within the training period, reviewing available class recordings and presentation materials, or attending the corresponding topic in another suitable live batch. These options help learners continue their Data Analytics learning journey without missing important concepts.
For additional details about the Data Analytics syllabus, course duration, fees, batch schedules, training methods, certification, or placement assistance, you can contact the LearnoVita support team at contact@learnovita.com. The team can help clarify your questions and guide you through the enrollment process.
You can register for the Data Analytics Training in Kolkata through the official LearnoVita website or contact the training team for enrollment assistance. Before registering, you can review the course syllabus, available batch timings, training formats, project details, and fee structure to choose a program that matches your learning requirements and career objectives.
Yes, enrolled learners can access the available course resources through the student portal, according to the applicable access policy. Learning materials may include Data Analytics notes, practice exercises, technical guides, project resources, training videos, recorded sessions, and interview preparation questions. These resources help participants revise important concepts and continue practicing SQL, Python, Excel, Power BI, and Tableau.
LearnoVita focuses on creating an interactive learning environment where participants can communicate with trainers, discuss analytical problems, and clarify technical doubts. Smaller training batches help encourage individual attention, practical participation, and better interaction during sessions. The actual batch size may vary depending on the selected training format, schedule, and availability.
The salary of a Data Analytics professional in India depends on factors such as technical expertise, years of experience, job responsibilities, industry, and location. Entry-level professionals may start with comparatively modest packages, while experienced Data Analysts, Business Intelligence Analysts, and Data Specialists can earn higher salaries based on their skills and organizational requirements. Proficiency in SQL, Python, Power BI, Tableau, and statistical analysis can help improve career opportunities and earning potential.
view More view Less
Career Assistance
  • Build a Powerful Resume for Career Success
  • Get Trainer Tips to Clear Interviews
  • Practice with Experts: Mock Interviews for Success
  • Crack Interviews & Land Your Dream Job
100% JOB GUARANTEE

Global Quality Training
At The Lowest Fees & Expert Trainer

AVAILABLE IN:
India Canada USA Singapore UAE Australia EU Germany

Need custom pricing?

4.9/5 from 50k+ students
Acte Technologies WhatsApp
Call Us! Chat With Us