
Tableau Certification Course in Sunnyvale
Ratings


- Enroll in the Tableau Course in Sunnyvale to learn data visualization and business intelligence concepts effectively.
- Master key features such as dashboards, reports, data blending, calculated fields, and interactive visualizations.
- Gain hands-on experience through real-time projects, dashboard creation, and data analysis activities.
- Ideal for Tableau Developers, Data Analysts, BI Professionals, and IT aspirants.
- Choose from flexible batch timings: Weekday, Weekend, or Fast-Track learning options.
- Benefit from placement support, interview preparation, and certification assistance.
Course Duration
50+ HrsLive Project
3 ProjectCertification Pass
GuaranteedTraining Format
Live Online (Expert Trainers)Quality Training With Affordable Fee
 Fees Starts From

11368+
Professionals Trained
10+
Batches every month
2758+
Placed Students
248+
Corporate ServedWhat You'll Learn
Tableau Certification Course in Sunnyvale delivers in-depth knowledge of data visualization and modern analytics practices used by organizations to make informed decisions.
Understand Tableau Course essentials such as data connections, calculated fields, filters, and creating interactive dashboards for real-time insights.
Build powerful visual stories by transforming raw data into meaningful reports and designing intuitive dashboards for better business understanding.
Gain practical exposure through Tableau training in Sunnyvale by working on live datasets, creating reports, and performing hands-on dashboard development.
Explore advanced Tableau Course concepts including data blending, parameters, forecasting, and performance optimization techniques.
Achieve professional-level expertise with Tableau training that strengthens your career opportunities in data analytics, business intelligence, and reporting roles.
Tableau Course Objectives
- Growing demand for data visualization professionals across industries
- Increased use of business intelligence tools in decision-making
- Expansion of cloud-based analytics platforms
- Integration with AI and advanced analytics technologies
- Opportunities in data-driven roles such as analyst and BI developer
- Data connection and data source management
- Dashboard creation and visualization techniques
- Calculated fields and data blending
- Filters, parameters, and formatting
- Data storytelling and report publishing
- Information Technology and Software Services
- Banking and Financial Services
- Healthcare and Pharmaceuticals
- Retail and E-commerce
- Manufacturing and Logistics
- Strong data visualization and reporting skills
- Better career opportunities in analytics roles
- Ability to interpret and present business data effectively
- Hands-on experience with real datasets
- Increased confidence in decision-making processes
Request more informations
WhatsApp (For Call & Chat):
+91 89259 58912
Tableau Course Benefits
The Tableau course in Sunnyvale offers hands-on learning through real-time datasets, helping learners build strong data visualization and reporting skills. Participants gain practical exposure with guided projects and opportunities to work on Tableau internship experiences that reflect actual business scenarios. The program covers essential and advanced concepts like dashboard design, data blending, and performance optimization under expert mentorship. This Tableau course with placement support prepares learners for in-demand roles in analytics by strengthening both technical expertise and job readiness.
- Designation
-
Annual SalaryHiring Companies


About Tableau Certification Training
The Tableau certification course in Sunnyvale equips learners with practical knowledge to design and deliver impactful data visualization solutions. Through hands-on Tableau project, participants gain real-time experience in building dashboards, reports, and interactive analytics for business use. The training focuses on essential concepts like data connections, calculated fields, and advanced visualization techniques guided by industry experts. With strong placement assistance and industry exposure, this program prepares learners for rewarding careers in analytics and business intelligence.
Top Skills You Will Gain
- Data Visualization
- Dashboard Design
- Data Analysis
- Report Creation
- Data Blending
- Chart Building
- Data Cleaning
- Visual Storytelling
12+ Tableau Tools
Online Classroom Batches Preferred
No Interest Financing start at ₹ 5000 / month
Corporate Training
- Customized Learning
- Enterprise Grade Learning Management System (LMS)
- 24x7 Support
- Enterprise Grade Reporting
Not Just Studying
We’re Doing Much More!
Empowering Learning Through Real Experiences and Innovation


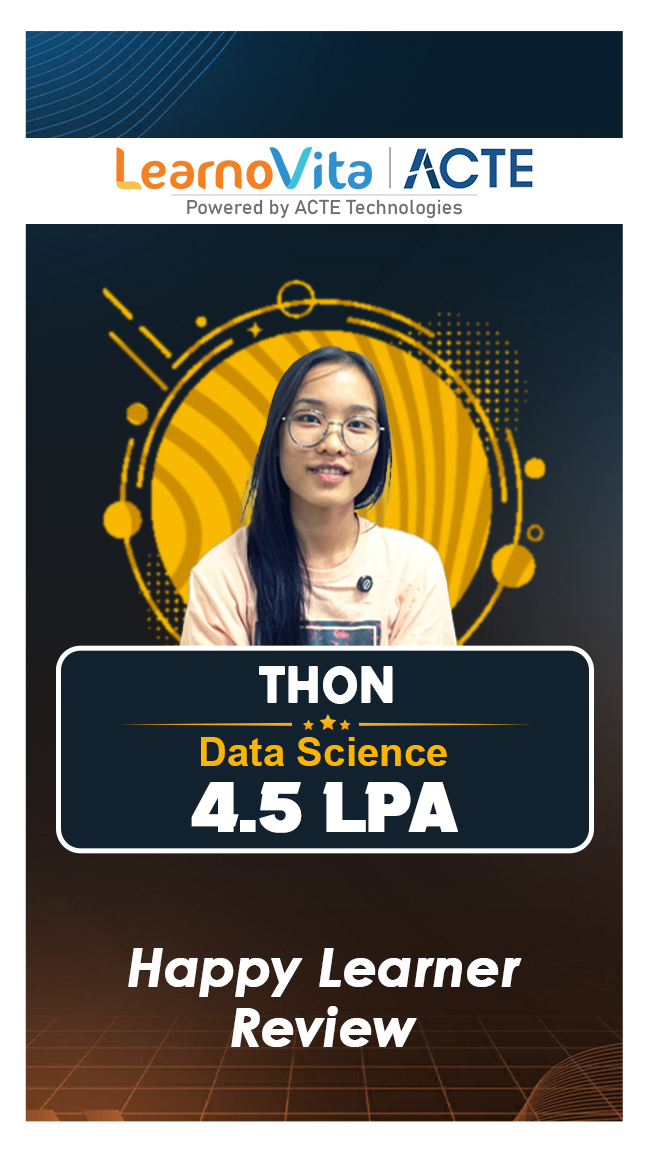
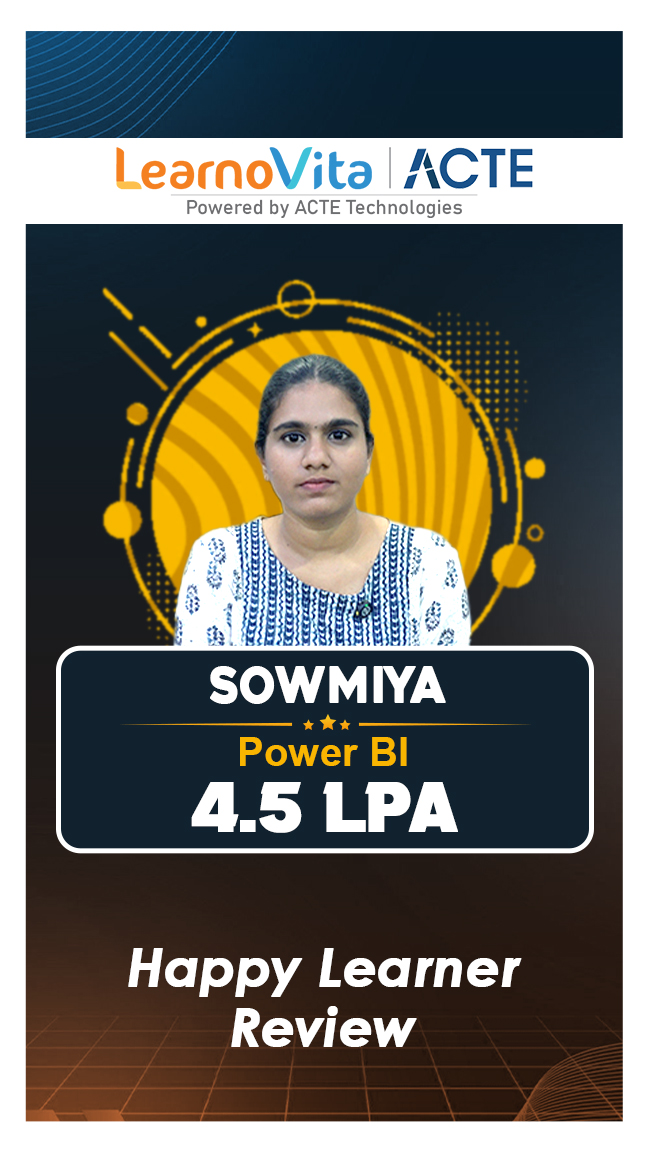


Tableau Course Curriculum
Trainers Profile
The Tableau course in Sunnyvale is guided by experienced professionals who bring strong expertise in data analytics and visualization techniques. Learners gain practical exposure through hands-on sessions designed to build confidence in handling real datasets and creating impactful dashboards. We provide well-structured Tableau training materials that support step-by-step learning and help in mastering core concepts with clarity. This program enables participants to develop job-ready skills and excel in analytics-focused roles across various industries.
Syllabus for Tableau Training Download syllabus
- Overview of Tableau and its components
- Understanding data visualization concepts
- Installation and setup
- Navigating Tableau interface
- Connecting to basic data sources
- Connecting to Excel and text files
- Working with databases
- Data source types
- Live vs extract connections
- Managing data connections
- Data cleaning techniques
- Sorting and filtering data
- Splitting and merging fields
- Handling null values
- Data type conversions
- Creating bar charts
- Line charts and area charts
- Pie charts and scatter plots
- Formatting visuals
- Adding labels and tooltips
- Creating calculated fields
- Using functions and formulas
- String and date functions
- Logical calculations
- Aggregations in calculations
- Applying filters
- Types of filters
- Creating parameters
- Using parameters in reports
- Interactive filtering
- Creating dashboards
- Adding multiple sheets
- Layout and design
- Interactive dashboard elements
- Device-specific dashboards
- Combining multiple data sources
- Primary and secondary data
- Blending techniques
- Resolving data mismatches
- Working with joins
- Heat maps
- Tree maps
- Geographic maps
- Dual-axis charts
- Highlight tables
- Introduction to Tableau Prep
- Building data flows
- Cleaning and shaping data
- Combining datasets
Request more informations
WhatsApp (For Call & Chat):
+91 89259 58912
REAL

UPGRADE

sowmiya

UPGRADE

Rajkumar

UPGRADE

Thon
UPGRADE

Lavanya

Industry Projects
Exam & Tableau Certification
- Basic understanding of data and charts
- Familiarity with spreadsheets like Excel
- Interest in data analysis and visualization
- Awareness of simple database concepts
- Willingness to practice with datasets
- Data Analyst
- Tableau Developer
- Business Intelligence Analyst
- Reporting Analyst
- Data Visualization Specialist

MNC Recognized course
complete certification

Intership
complete certification

Placement
complete certification
Our learners
transformed their careers

A majority of our alumni
fast-tracked into managerial careers.
Get inspired by their progress in the Career Growth Report.
Our Student Successful Story
 Regular 1:1 Mentorship From Industry Experts
Live Classes
Career Support
Regular 1:1 Mentorship From Industry Experts
Live Classes
Career Support

Sandeep Kumar D
Software Engineer, Cisco Systems )

Vinoth P
UI Developer, TCS
Vijeyalakshme kannan
QA Engineer, Amazon Development Center
Pranav Srinivas
Software Testing, Capgemini
Prasanna
SAP Admin, HCLHow are the Tableau Course with LearnoVita Different?
Feature
LearnoVita
Other Institutes
Affordable Fees
Competitive Pricing With Flexible Payment Options.
Higher Tableau Fees With Limited Payment Options.
Live Class From ( Industry Expert)
Well Experienced Trainer From a Relevant Field With Practical Tableau Training
Theoretical Class With Limited Practical
Updated Syllabus
Updated and Industry-relevant Tableau Course Curriculum With Hands-on Learning.
Outdated Curriculum With Limited Practical Training.
Hands-on projects
Real-world Tableau Projects With Live Case Studies and Collaboration With Companies.
Basic Projects With Limited Real-world Application.
Certification
Industry-recognized Tableau Certifications With Global Validity.
Basic Tableau Certifications With Limited Recognition.
Placement Support
Strong Placement Support With Tie-ups With Top Companies and Mock Interviews.
Basic Placement Support
Industry Partnerships
Strong Ties With Top Tech Companies for Internships and Placements
No Partnerships, Limited Opportunities
Batch Size
Small Batch Sizes for Personalized Attention.
Large Batch Sizes With Limited Individual Focus.
Additional Features
Lifetime Access to Tableau Course Materials, Alumni Network, and Hackathons.
No Additional Features or Perks.
Training Support
Dedicated Mentors, 24/7 Doubt Resolution, and Personalized Guidance.
Limited Mentor Support and No After-hours Assistance.
Tableau Course FAQ's
- LearnoVita will assist the job seekers to Seek, Connect & Succeed and delight the employers with the perfect candidates.
- On Successfully Completing a Career Course with LearnoVita, you Could be Eligible for Job Placement Assistance.
- 100% Placement Assistance* - We have strong relationship with over 650+ Top MNCs, When a student completes his/ her course successfully, LearnoVita Placement Cell helps him/ her interview with Major Companies like Oracle, HP, Wipro, Accenture, Google, IBM, Tech Mahindra, Amazon, CTS, TCS, HCL, Infosys, MindTree and MPhasis etc...
- LearnoVita is the Legend in offering placement to the students. Please visit our Placed Students's List on our website.
- More than 5400+ students placed in last year in India & Globally.
- LearnoVita Conducts development sessions including mock interviews, presentation skills to prepare students to face a challenging interview situation with ease.
- 85% percent placement record
- Our Placement Cell support you till you get placed in better MNC
- Please Visit Your Student's Portal | Here FREE Lifetime Online Student Portal help you to access the Job Openings, Study Materials, Videos, Recorded Section & Top MNC interview Questions
- LearnoVita Certification is Accredited by all major Global Companies around the World.
- LearnoVita is the unique Authorized Oracle Partner, Authorized Microsoft Partner, Authorized Pearson Vue Exam Center, Authorized PSI Exam Center, Authorized Partner Of AWS.
- Also, LearnoVita Technical Experts Help's People Who Want to Clear the National Authorized Certificate in Specialized IT Domain.
- LearnoVita is offering you the most updated, relevant, and high-value real-world projects as part of the training program.
- All training comes with multiple projects that thoroughly test your skills, learning, and practical knowledge, making you completely industry-ready.
- You will work on highly exciting projects in the domains of high technology, ecommerce, marketing, sales, networking, banking, insurance, etc.
- After completing the projects successfully, your skills will be equal to 6 months of rigorous industry experience.
- We will reschedule the classes as per your convenience within the stipulated course duration with all such possibilities.
- View the class presentation and recordings that are available for online viewing.
- You can attend the missed session, in any other live batch.

- Build a Powerful Resume for Career Success
- Get Trainer Tips to Clear Interviews
- Practice with Experts: Mock Interviews for Success
- Crack Interviews & Land Your Dream Job
Global Quality Training
At The Lowest Fees & Expert Trainer


Need custom pricing?