
- Financial Performance – A Complete Tutorial
- How Six Sigma Principles Can Progress Your Productivity – Tutorial
- Google Analytics Pro Tutorial | Fast Track your Career
- Activity-Based Costing Tutorial | Know about Definition, Process, & Example
- Create a workbook in Excel Tutorial | Learn in 1 Day
- Excel ROUNDUP Formula Tutorial | Learn with Functions & Examples
- Business Analytics with Excel Tutorial | Learn In 1 Day
- SAP Tutorial – Free Guide Tutorial & REAL-TIME Examples
- IBM SPSS Statistics Tutorial: Getting Started with SPSS
- SAP Security Tutorial | Basics & Definition for Beginners
- SAP Simple Finance Tutorial | Ultimate Guide to Learn [Updated]
- SAP FIORI Tutorial | Learn in 1 Day FREE
- Introduction to Business Analytics with R Tutorial | Ultimate Guide to Learn
- Tableau Desktop Tutorial | Step by Step resource guide to learn Tableau
- Implementing SAP BW on SAP HANA | A Complete Guide
- SAP HANA Administration | Free Guide Tutorial & REAL-TIME Examples
- Tableau API Tutorial | Get Started with Tools, REST Basics
- SAP FICO ( Financial Accounting and Controlling ) Tutorial | Complete Guide
- Alteryx Tutorial | Step by Step Guide for Beginners
- Getting started with Amazon Athena Tutorial – Serverless Interactive | The Ultimate Guide
- Introduction to Looker Tutorial – A Complete Guide for Beginners
- Sitecore Tutorials | For Beginners Learn in 1 Day FREE |Ultimate Guide to Learn [UPDATED]
- Adobe Analytics Tutorial – The Ultimate Student Guide
- Splunk For Beginners – Learn Everything About Splunk with Free Online Tutorial
- An Overview of SAP HANA Tutorial: Learn in 1 Day FREE
- Statistical Package for the Social Sciences – SPSS Tutorial: The Ultimate Guide
- Splunk For Beginners – Learn Everything About Splunk with Free Online Tutorial
- Pentaho Tutorial – Best Resources To Learn in 1 Day | CHECK OUT
- Statistical Package for the Social Sciences – SPSS Tutorial: The Ultimate Guide
- An Overview of SAP HANA Tutorial: Learn in 1 Day FREE
- Spotfire Tutorial for Beginners | Quickstart – MUST- READ
- JasperReports Tutorial: Ultimate Guide to Learn [BEST & NEW]
- Charts and Tables – Qlikview Tutorial – Complete Guide
- TIBCO Business Works | Tutorial for Beginners – Learn From Home
- Cognos TM1 Tutorial : Learn Cognos from Experts
- Kibana
- Power BI Desktop Tutorial
- Tableau Tutorial
- SSAS Tutorial
- Creating Tableau Dashboards
- MDX Tutorial
- Tableau Cheat Sheet
- Analytics Tutorial
- Lean Maturity Matrix Tutorial
- MS Excel Tutorial
- Business Analysis Certification Levels & Their Requirements Tutorial
- Solution Assessment and Validation Tutorial
- Lean Six Sigma Tutorial
- Enterprise Analysis Tutorial
- Create Charts and Objects in Excel 2013 Tutorial
- Msbi Tutorial
- MicroStrategy Tutorial
- Advanced SAS Tutorial
- OBIEE Tutorial
- Tableau Server Tutorial
- OBIA Tutorial
- Business Analyst Tutorial
- Cognos Tutorial
- Qlik Sense Tutorial
- SAP-Bussiness Objects Tutorial
- SAS Tutorial
- PowerApps Tutorial
Splunk For Beginners – Learn Everything About Splunk with Free Online Tutorial
Last updated on 09th Aug 2022, Blog, Business Analytics, Tutorials
Introduction:
Why Splunk is the go-to tool when it comes to machine-generated data.
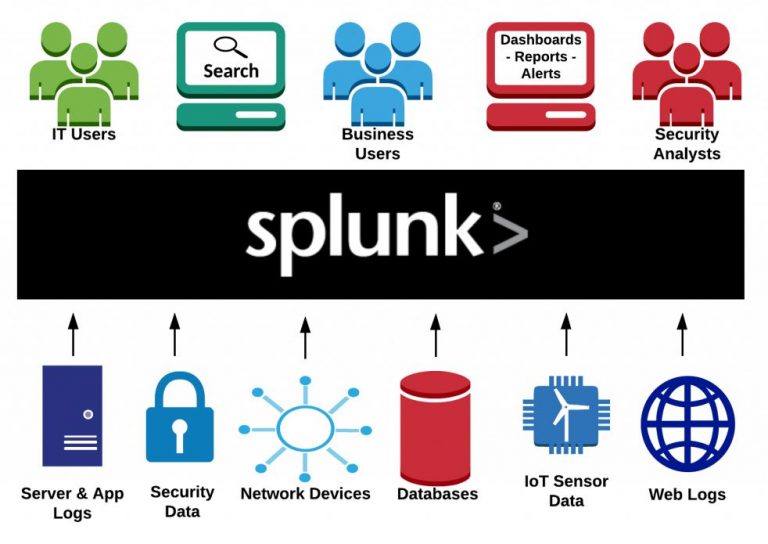
SplunkM is a powerful engine extensively used for searching, investigating, screening, troubleshooting, alerting, and reporting on machine-generated data which is such a large part of today’s data-driven world.Splunk can be called as Google for machine-generated data.
What is Splunk?
Splunk is used for getting value out of machine-generated data.It can be a data mining tool for big data applications.Splunk can effectively handle large data without reduce performance.The best of Splunk is that it does not need any database to save its information as it extensively makes use of its indexes to save the data.Splunk is an absolutely fast engine and provides lightning-fast output.If troubleshoot any issue by solving it with current results and performing an effective root cause analysis.It can be used as a screening, reporting, analysing, security information, and event management tool among other things.
It takes valuable machine-generated data and convert to effective operational intelligence by delivering insights through reports, charts, and alerts.
Splunk Products:
In three different versions.
- Splunk Enterprise
- Splunk Light
- Splunk Cloud
Splunk Enterprise
Splunk Enterprise edition is used by more IT business.
It helps you to coordinate and analyse the data from applications, websites, applications, etc
.Splunk Cloud
Splunk Cloud is a hosted platform.
It has the same features as the above.
It can be availed from Splunk or using AWS cloud platform.
Splunk Light
Splunk Light is a free version.
It allows search, report and change log data.
It has limited functionalities and feature compared to others.
Splunk Architecture
The Splunk Architecture comprises three main components follows:
- Splunk Forwarder
- Splunk Indexer
- Search Head
Splunk Indexer:
The Splunk Indexer is used for indexing and saving the data that is received from the Splunk Forwarder.
It basically transforms data into events, saves and adds them to an index, which in turn enhances searchability.
The data received from the Splunk Forwarder is first parsed so as to remove any unnecessary data and then the indexing is done.
By this, the Splunk Indexer creates the following files and later bifurcates them into different directories called buckets:
· Compressed raw data
· Indexes pointing to raw data
· Metadata files
Splunk Search Head
It is basically a GUI, where the user can perform different operations as per requirements.
In this step, the users can easily connect with Splunk and perform search and query operations on Splunk data.
The users can feed in the find keywords and get the output as per requirement.
What is Splunk used for?
Splunk is a software platform used for performing screening, searching, analysing and visualizing real-time machine-generated data.
Used in indexing, correlating and capturing real-time data is more important and highly recognized.Splunk is used in producing and making graphs, dashboards, alerts and interactive visualizations.Using this Splunk, organizations can simply access the data and arrive at solutions to difficult business problems also.
Features of Splunk
- One of the largest strengths of Splunk is real-time data processing.
- The input data for Splunk could be in any format like CSV, JSON, and others
- Easily find and investigate a specific result with Splunk
- It lets troubleshoot any condition of failure for improved performance.
- Monitor any business data and create an informed decision.
- It is possible to visualise and analyse the results through powerful dashboards.
- Analyse the performance of any IT system with the Splunk tool.
- Splunk even incorporate AI into data strategy.
Applications of Splunk
- It deploy Splunk for web analytics to observe KPIs and increase performance.
- It is used in IT operations to find intrusion, breaches, and network abusers.
- Tracing, analysing, and fine-tuning digital marketing initiatives with Splunk.
- Working in conjunction with the Internet of Things is a large part of Splunk’s future.
- It is used in industrial automation systems to view everything is working as expected.
- Advising cybersecurity personnel on the best course of action for confidential IT systems.
Famous companies using Splunk
- Cisco
- Bosch
- IBM
- Motorola
- PepsiCo
- Adobe
- Visa
- Adidas
- Salesforce
- Walmart
Splunk Dashboard
Splunk Dashboards have data visualization displays such as tables, charts, lists, maps etc.Each of these panels create the visualization results using a base.
Build and edit dashboards using the Splunk Web dashboard editor, which is the user interface in Splunk Light.The created dashboards can also be edited by Simple XML source code.
The following steps can be used to build the dashboard :
- First, need to add content.
- This can be done by creating searches that power up the dashboard, saving searches as reports, or creating panels for reusable.
- Next stage will be to create or design the user interface.
- For designing, perform dashboard changes by using panels, visualizations and forms.
- Next stage is adding interactivity.
- Though this is an optional stage, users may give it a try.
- This step basically involves adding interactivity to the dashboard using forms.
- Next stage would be to customize the dashboard.
- Users can add custom features to enhance the customization.
- Lastly, use Splunk Web Dashboard Editor to build and edit the dashboard.
Disadvantages of using Splunk:
- Splunk can proved expensive for more data volumes.
- Dashboards are functional but not as quality compared to other monitoring tools.
- Its learning curve is stiff, need Splunk training as it’s a multi-tier architecture.
- So need to spend more time to learning this tool.
- Searches are complex to understand, especially regular expressions and search syntax.