
- What is Lean?| Everything You Need to Know
- What is SAP Workflow? : A Complete Guide
- Difference between Tableau and Power BI | Benefits and Special Features
- Data Warehouse in Tableau | Everything You Need to Know
- What is Tableau Server?| Everything You Need to Know | A Definitive Guide
- What is Dax in Power BI? | A Comprehensive Guide
- Upgrade in Tableau Desktop and Web Authoring | A Complete Guide with Best Practices
- What is SAP HANA | SAP HANA Database Connection | All you need to know [ OverView ]
- SAP BPC – What is Business Planning and Consolidation? : All you need to know [ OverView ]
- Root Cause Analysis: Definition, Examples & Methods | All you need to know [ OverView ]
- Seven Basic Quality Improvement Ishikawa Tools | Important asset to control quality in your project [OverView]
- What is Power BI | Its Use Cases and Applications | All you need to know [ OverView ]
- How and why to measure and analyze employee productivity | Everything You Need to Know
- Top 10 Employee Retention Strategies | Everything You Need to Know
- What are LookML Projects and the Developer Mode | How to Create LookML Projects?
- What are Slowly Changing Dimension | SCD Types and Implementations | Step-By-Step Process
- What is Pareto Chart and How to Create Pareto Chart | A Complete Guide For Beginners
- What does an Agile Business Analyst do | Required Skills, Roles and Responsibilities [ Job & Future ]
- What is Lean Management? | Role and Concepts of Lean Management | Expert’s Top Picks
- A Definitive Guide of Working Capital Management with Best Practices & REAL-TIME Examples
- Business Analytics with Excel Fundamentals | A Complete Guide For Beginners
- Business Analyst : Job Description | All you need to know [ Job & Future ]
- How to create a Splunk Dashboard | A Complete Guide For Beginners [ OverView ]
- What is Splunk Logging ? | The Ultimate Guide with Expert’s Top Picks
- Alteryx vs Tableau | Know Their Differences and Which Should You Learn?
- What is Predictive Analytics? : Step-By-Step Process with REAL-TIME Examples
- An Overview of SAS Stored Processes | The Ultimate Guide with Expert’s Top Picks
- How to Create Conditional Formatting in Cognos Report Studio | A Complete Guide
- Difference between OLTP vs OLAP | Know Their Differences and Which Should You Learn?
- ECBA vs CCBA vs CBAP | A Complete Guide For Beginners | Know Their Differences and Which Should You Learn?
- Import Custom Geocode Data in Tableau | Everything You Need to Know [ OverView ]
- Data Warehouse Tools : Features , Concepts and Architecture
- PGDM vs MBA | Know Their Differences and Which Should You Learn?
- Most Popular Data Visualization Tools | A Complete Beginners Guide | REAL-TIME Examples
- Tableau vs Looker : Comparision and Differences | Which Should You Learn?
- Benefits of Employee Satisfaction for the Organization [ Explained ]
- DAX In Power BI – Learn Power BI DAX Basics [ For Freshers and Experience ]
- Power Bi vs Tableau : Comparision and Differences | Which Should You Learn?
- What is Alteryx Tools | Alteryx ETL Tools | Comprehensive Guide
- What is Tableau Prep? : Comprehensive Guide | Free Guide Tutorial & REAL-TIME Examples
- What are Business Intelligence Tools ? : All you need to know [ OverView ]
- Tableau Aggregate Functions | A Complete Guide with REAL-TIME Examples
- Intervalmatch Function in Qlikview | Everything You Need to Know [ OverView ]
- QlikView Circular Reference | Free Guide Tutorial & REAL-TIME Examples
- Data Blending in Tableau | A Complete Guide with Best Practices | Free Guide Tutorial [ OverView ]
- Splunk vs ELK | Differences and Which Should You Learn? [ OverView ]
- QlikSense vs QlikView | Differences and What to learn and Why?
- What Is Measurement System Analysis | Required Skills | Everything You Need to Know
- Splunk Timechart | Free Guide Tutorial & REAL-TIME Examples
- What Is Image Processing ? A Complete Guide with Best Practices
- What is a Business Analysis ? A Complete Guide with Best Practices
- Top Business Analytics Tools | Comprehensive Guide
- Business Analyst Career Path [ Job & Future ]
- Time Series Analysis Tactics | A Complete Guide with Best Practices
- What is Splunk ? Free Guide Tutorial & REAL-TIME Examples
- Which Certification is Right for You: Six Sigma or Lean Six Sigma?
- SAS Vs R
- Top Technology Trends for 2020
- Data Analyst vs. Data Scientist
- What are the Essential Skills That You Need to Master in Data Analyst?
- What is Six Sigma?
- Common Cause Variation Vs Special Cause Variation
- Reasons to Get a Six Sigma Certification
- What Is Strategic Enterprise Management and its Components?
- What Are The Benefits Measurement Constrained Optimization Methods?
- What Is the Benefit of Modern Data Warehousing?
- What Is Corporate Social Responsibility (CSR)?
- What Is The Purpose and Importance Of Financial Analysis?
- What is Insights-as-a-Service (IaaS)?
- Business Analytics With R Programming Languages
- Where Are The 8 Hidden Wastes?
- What Are Market Structures?
- What is Cost of Quality (COQ)?
- What is Build Verification Testing?
- Quality Improvement in Six Sigma
- What is Process Capability Analysis?
- How To Measure The Effectiveness Of Corporate Training
- SAP Financials And SAP Accounting Modules
- Tips to Learn Tableau
- Why Should I Become a CBAP?
- History And Evolution of Six Sigma
- How to use Control Chart Constants?
- Data Analytics Course For Beginners
- How to Build a Successful Data Analyst Career?
- Data Analytics Vs Business Analytics
- What is SAP Certification?
- Books To Read For a Six Sigma Certification
- Six Sigma Green Belt Salary
- What is the ASAP Methodology?
- Complete list of SAP modules

What is Process Capability Analysis?
Last updated on 06th Oct 2020, Artciles, Blog, Business Analytics
What is Process Capability?
The process capability is the measurement of the capability of the process performed when there are some noise factors and process inputs impacting the process due to which the output of the process could not be in the target line and might get deviated from the target.
Here the target means the process target given by the customer. Customers give the target with some specification limits i.e. USL (Upper Specification Limit) and LSL (Lower Specification Limit), these are the boundaries of the target which customers already take into consideration. But obviously, hitting the exact target is practically not possible, and therefore customers give the USL and LSL.
If all our data points lie between these given specification limits, we can say our process is capable, however, if data points are crossing the specification limits given by customers, it means the process is not capable enough to provide the data as per customers’ requirement.
For example, if a pizza needs to delivered to the customer in 30 minutes then crossing the 30 minutes time limit could be considered a failure or there can be a chance to deliver the pizza for free. Here we can see that we have only one specification limit which is the USL.
Hence, we can say that specification limits can be on both Upper and Lower side or only one side Upper or Lower.
Subscribe For Free Demo
Error: Contact form not found.
Key Points to remember for Process Capability
While we discuss process capability, we must assure that data must be normal and in control. If data is not normal and in control, it is fruitless to check for the process capability.
- Process capability gives a long-term performance once it is under the statistical boundaries.
- It checks the ability of the process also the ability of the people, machines, measurement, and methods as well.
- Process Capability could have both side limits, in manufacturing industries, for any measurement, there would be upper and lower specification limits. In other industries, there might be a chance of only a single limit, either maximum limit or minimum limit. For example, the delivery of the product should have only the maximum limit, whereas passing an exam has a criterion of minimum 60%.
The Capability of Discrete/Attribute Data
The discrete data will either be defective for example pass or fail, no or go or; Binomial data 0 or 1.
On the other side, discrete data can have defects e.g. scratches and number of errors in one single unit of material or data. This is called the Poisson.
The capability of these data can be calculated from binomial or Poisson distributions using the Minitab or other software packages, data can also be converted into continuous form and then the normal method of process capability can be used.
Graphical representation quantifying the process capability
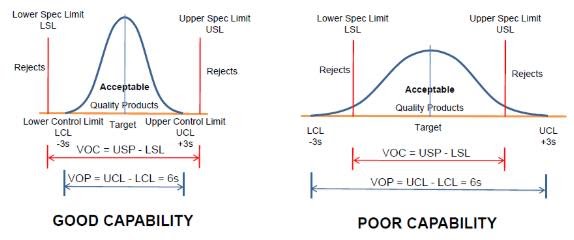
In the above figure, we can see that when the process data has a wider spread, it reflects the poor capability, whereas a narrower variation spread shows a good capability. Since it is under the specification limits, there is more area for committing the errors, whereas, in the poor capability figure, we can see process variation exceeding the specification limits.
Also, in this figure, we can differentiate between VOC and VOP. VOC is given by the customer, whereas VOP is the processed voice, it comes inherently from the data and creates the Upper Control Limit and Lower Control Limit.
While VOC gives Upper Specification Limit and Lower Specification Limit, it can only be one-sided, however, control limits must have both sides.
Measures of Process Capability (Indices)
Process Capability Formula (Cp, Cpk):
Cp and Cpk are used for the short-term process, or within 6 σ.
- Cp= (USL-LSL)/6σ (within) and Cpk = min (Cpu, Cpl),
- Cpu = (USL-Mean)/3σ (within)
- Cpl= (Mean-Cpl)/3σ (within)
In the Cpk, k stands for off-target variation.
K= (Process Centre-Process Mean)/50%of USL-LSL and if we talk about process center;
Process center = (USL+LSL)/2, and the process mean is the average or mean of the process data points.
While we talk about σ within, it reflects the Rbar/d2 or Sbar/C4.
Rbar/d2 are used for data if we see the average of the ranges of the subgroups and when we have a subgroup size of less than 10; whereas, Sbar/C4 is used for the data points when we have subgroup size ≥ 10, where the D2 and C4 are the predefined control charts constants, as per the subgroup size we have taken. We get the constant value for D2 and C4 from statistical data.
Process Performance Indices Formula (Pp, Ppk)

Get Accredited Pega Certification Course By Experts Training
- Instructor-led Sessions
- Real-life Case Studies
- Assignments
- Pp =(USL-LSL)/6σ (overall) and Ppk = min (Cpu, Cpl)/6 σ,
- Ppu = (USL-Mean)/3σ (overall)
- Ppl= (Mean-Cpl)/3σ (overall)
σ(overall) = Sqrt (∑(x-xbar)^2/(n-1)), here xbar refers to the process mean, individual data points refer by x, where n indicates sample size and their degree of freedom reflects as n-1.
The Pp and Ppk provide the overall process capability overview or long-term process capability. It shows the exact process capability at current.
Quality Glossary Definition: Process capability
Process capability is defined as a statistical measure of the inherent process variability of a given characteristic. You can use a process-capability study to assess the ability of a process to meet specifications.
During a quality improvement initiative, such as Six Sigma, a capability estimate is typically obtained at the start and end of the study to reflect the level of improvement that occurred.
Several capability estimates are in widespread use, including:
- Potential capability (Cp) and actual capability during production (Cpk) are process capability estimates. Cp and Cpk show how capable a process is of meeting its specification limits, used with continuous data. They are valuable tools for evaluating initial and ongoing capability of parts and processes.
- “Sigma” is a capability estimate typically used with attribute data (i.e., with defect rates).
Capability estimates like these essentially reflect the nonconformance rate of a process by expressing this performance in the form of a single number. Typically this involves calculating some ratio of the specification limits to process spread.
ASSESSING PROCESS CAPABILITY :
Assessing process capability is not easy. Some textbooks teach users to wait until the process reaches equilibrium, take roughly 30 samples and calculate their standard deviation; however, it is difficult to know when the process reaches a state of equilibrium and if the recommended samples are representative of the process. The measurement of process capability is more complicated than that.
For example, suppose you have a rotary tablet press that produces 30 tablets, one from each of 30 pockets per rotation. If you’re interested in tablet thickness, you might want to base your estimate of process capability on the standard deviation calculated from 30 consecutive tablets. Better yet, you might assure representation by taking those 30 consecutive tablets repeatedly over eight time periods spaced evenly throughout a production run (Table 1). You would pool the eight individual standard deviations yielding a thickness capability estimate based on (8 X (30 – 1)) = 232 degrees of freedom.
For greater assurance yet, you might want to include several production runs with perhaps fewer sampling times per production run. Estimates of the process capability made this way would be representative and independent of process mean changes that might take place from one sampling time to the next. Because the pooled, within-group standard deviation is calculated on observations taken close together in time, there is no opportunity for it to be contaminated by assignable sources of variation. It is as close to pure capability as you’re likely to get.
PRACTICAL CONCERNS WHEN CONDUCTING CAPABILITY STUDIES
There are both positive and negative aspects to capability estimates. For example, Cp and Cpk estimates are highly sensitive to the assumption that one is sampling from a normal distribution—that is, most of the data points are concentrated around the average (mean), forming a bell–shaped curve.
Furthermore, sampling from a stable system is essential to obtaining meaningful estimates of process performance for future production.
Many quality practitioners report solely the numerical values of the capability estimates. Others, however, note that the capability estimates are themselves merely statistics, or point estimates of the true capability of a process. As such, the use of confidence intervals for the true capability values may also be reported.
When sampling from stable, but non-normal distributions, other strategies to obtain meaningful capability estimates may be appropriate, including:
- Transforming the data to be approximately well modeled by a Normal distribution.
- Using an alternative probability distribution, such as Weibull or lognormal distributions.
PROCESS CAPABILITY RESOURCES :
Quality Improvement Under Budgetary and Life-Cycle Constraints (PDF) Cost is a major driver in many, if not all, of the decisions that a firm must make. How much should be spent on process improvement with respect to improvement in process capability?
My Supplier’s Capability Is What? (PDF) Know what processes your suppliers are using, and make them prove those processes are capable and controlled.
Process Evaluation: Capability Analysis Of Complex Parts (PDF) The background and implications of the Military Aircraft and Missile Systems Group developing appropriate methods for monitoring processes and evaluating process capability.

Get Accredited Pega Certification Course By Experts Training
Weekday / Weekend BatchesSee Batch DetailsWhen is it used?
Use the standard method for calculating capability analysis when you can answer “yes” to all of the following questions:
- 1. Is it necessary to understand how the system performs in comparison to specification limits?
Specifications or requirements must be available to complete capability analysis. The system must also be measured in the same way as the specifications, so a direct comparison can be made. - 2. Does the specification consist of an upper and lower requirement?
For processes with one-sided specifications, see the article capability analysis for one-sided specifications. - 3. Are no special causes of variation present?
A system with special causes is unstable and constantly changing. If capability analysis is performed under these circumstances, it will be unreliable. Always construct a control chart and check for special causes before completing capability analysis. - 4. Is the data in variables form?
In order to complete the standard method for capability analysis, the data must be in variables form, that is measured data, such as time, length, weight, or distance. - 5. Do the individual values form a normal distribution?
In order to complete capability analysis using the standard method, a normal distribution is required. Use a histogram to check for normal distribution. If the distribution is not normal, non-normal capability analysis can be used. - 6. Has the data been collected over a period of time?
There are two ways to collect data for capability analysis. The standard method is from a control chart, where the data is collected over a period of time. If data has been collected in this way, the standard method for performing capability analysis is used.
Note that if you cannot answer these questions with a “yes,” Practical Tools for Continuous Improvement includes capability analysis for one-sided specifications, trial runs, attributes data, and nonnormal data.
What does it look like?
A courier company has set up a team to look at the actual arrival time at customers’ locations to pick up packages, in comparison to the scheduled arrival time. The company guarantees pick up of packages within 14 minutes of the scheduled time. It is unacceptable to customers for the courier to arrive early. Therefore, there are two requirements: on time and up to 14 minutes late. The result of the capability analysis for this example follows.
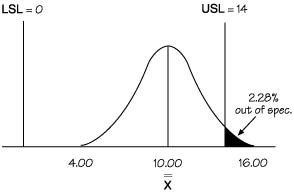
| Zupper = 2.00 | Zlower = 5.00 |
| Cpk = 0.67 | Cp = 1.17 |
| Cpu = 0.67 | Cpl = 1.67 |
A capability analysis like this can be accomplished using software like SQCpack.
How is it made?
These steps assume that variables data has been collected over time, and that a control chart and histogram have been completed. The control chart should show no special causes, and the histogram should reveal that the data is normally distributed.
In the example, the team examined the arrival time of couriers in comparison to the scheduled arrival time over a month. Since time is being measured, the data is variables. The team completed a histogram and found the data to be normal. An X- R control chart was also completed, showing no special causes of variation. Since a control chart must be completed before performing capability analysis, the calculations from the control chart can be utilized. The information taken from the control chart follows:
- The sample size used in the control chart, n
- The overall average, (from an
chart) or (from an X-MR chart.)
- The average range, (from an
chart) or (from an X-MR chart.)
The numerical specifications or requirements should also be known. Information for the example is shown below:
- n = 5
x= 10.00
= 4.653
USL = upper specification limit = 14 minutes
LSL = lower specification limit = 0 minutes (on time)
Steps:
- 1. Sketch the distribution
- 2. Calculate the estimated standard deviation
- 3. Determine the location of the tails for the distribution
- 4. Draw the specification limits on the distribution
- 5. Calculate how much data is outside the specifications
- 6. Calculate and interpret the capability indices
- 7. Analyze the results
The above article is an excerpt from the “Capability Analysis” section of Practical Tools for Continuous Improvement.
Conclusion
As we all know, any process would have the variance, due to the multiple outputs or there may be some noise in the process. If we have different inputs, then the outputs will not be the same or exactly hitting the target every time. For such scenarios, customers must give the space for acceptance of variations. Hence, we can say that every process has variations.
In case there is a variation, we then need to see, how much are we deviating from our target and how much are we within the customers’ defined limits.
The process capability is thus, defined as the ratio of the voice of the customer and voice of the process:
- Cp = (USL-LSL)/6σ.
Long-term process capability cannot be the same as the short term.
We must always try to change the Non-Normal data to normal first and convert Discrete data to Continuous data in order to get the more accurate details.