
- An Overview of AWS Machine Learning Tutorial
- Mapplet In Informatica | Purpose and Implementation of Mapplets | Expert’s Top Picks | Free Guide Tutorial
- Spring Cloud Tutorial
- Azure IoT Hub Integration Tutorial | For Beginners Learn in 1 Day FREE
- Cloud Native Microservices Tutorial | A Comprehensive Guide
- Azure Stream Analytics | Learn in 1 Day FREE Tutorial
- Azure Data Warehouse | Learn in 1 Day FREE Tutorial
- AWS Lambda Tutorial | A Guide to Creating Your First Function
- Azure Logic Apps Tutorial – A beginners Guide & its Complete Overview
- Azure Service Bus Tutorial | Complete Overview – Just An Hour for FREE
- Introduction to Azure Service Fabric Tutorial | Learn from Scratch
- Amazon CloudWatch Tutorial | Ultimate Guide to Learn [BEST & NEW]
- AWS Data Pipeline Documentation Tutorial | For Beginners Learn in 1 Day FREE
- What is Azure App Service? | A Complete Guide for Beginners
- AWS Key Management Service | All You Need to Know
- Apigee Tutorial | A Comprehensive Guide for Beginners
- Kubernetes Tutorial | Step by Step Guide to Basic
- AWS SQS – Simple Queue Service Tutorial | Quickstart – MUST READ
- AWS Glue Tutorial
- MuleSoft
- Cloud Computing Tutorial
- AWS CloudFormation tutorial
- AWS Amazon S3 Bucket Tutorial
- Kubernetes Cheat Sheet Tutorial
- AWS IAM Tutorial
- Cloud Concepts And Models Tutorial
- Cloud Network Security Tutorial
- Azure Active Directory Tutorial
- NetApp Tutorial
- OpenStack tutorial
- AWS Cheat Sheet Tutorial
- Informatica Transformations Tutorial
- AWS vs AZURE Who is The Right Cloud Platform?
- How to Host your Static Website with AWS Tutorial
- VMware Tutorial
- Edge Computing Tutorial
- Cognitive Cloud Computing Tutorial
- Serverless Computing Tutorial
- Sharepoint Tutorial
- AWS Tutorial
- Microsoft Azure Tutorial
- IOT Tutorial
Amazon CloudWatch Tutorial | Ultimate Guide to Learn [BEST & NEW]
Last updated on 10th Aug 2022, Blog, Cloud Computing, Tutorials
While man organizations are migrating their applications to the cloud, they also require to ensure that cloud-based services like Amazon Web Services (AWS) and other resources are available to a business.
So, how do ensure that these cloud services are not disabled? can do that using the application monitoring tool like Amazon CloudWatch.
The Amazon CloudWatch service is among the effetive ways of monitoring AWS applications and resources running on an AWS platform.
Using cloud-based monitoring, CloudWatch gather an operational data through logs, metrics, and events that offer a unified view of AWS resources and applications.
What is Amazon CloudWaatch?
Designed as an AWS component, Amazon CloudWatch offers cloud-based monitoring of AWS resources including – EC2 instances, elastic, load balancers, auto-scaling groups – along with the other Amazon services like Amazon S3, SNS, SQS, and RDS.
Amazon administrators can simply monitor more AWS instances and applications from a centralized dashboard.
Additionally, CloudWatch can also be used :
- Find any anomaly in your cloud environment.
- Generate custom dashboards that include metrics an AWS services that you use.
- Generate and configure alarms that can monitor AWS metrics and also initiate automated actions.
- Gain finish visibility into application performance, utilization of AWS resources, and overall health of the operations.
How does Amazon CloudWatch work?
1. Collect metrics and logs
In the first step, CloudWatch gather metrics and logs from all AWS services (for example, AWS EC2 instances). CloudWatch retrieves these metrics from a repository.
This can also contain custom metrics entered into a repository.
2. Monitor and visualize the data
Next, CloudWatch monitors and visualizes the data using CloudWatch dashboards that provide a one unified view of all AWS applications, resources, and services (running in premise or on the cloud).
Additionally, can correlate the collected metrics and logs to perform a visual analysis of an overall health and current performance of resources.
3. Act on an automated response to any changes.
In this step, CloudWatch executes an automated response to any of operational changes using alarms.
For instance, configure an alarm to start or end an EC2 instance when selected conditions are satisfied.
Can also use alarms to initiate services like Amazon EC2 auto-scaling or Amazon SNS.
If a configured alarm is triggered, can set up an automated actions like auto-scaling.
4. Analyse your metrics
The final step is to analyse and visualize the collected metric and log data – that can enable that better insight and understanding.
Perform real-time analysis by using CloudWatch Metric Math which helps to dive deeper into data.
What is the need for Cloud-Based monitoring?
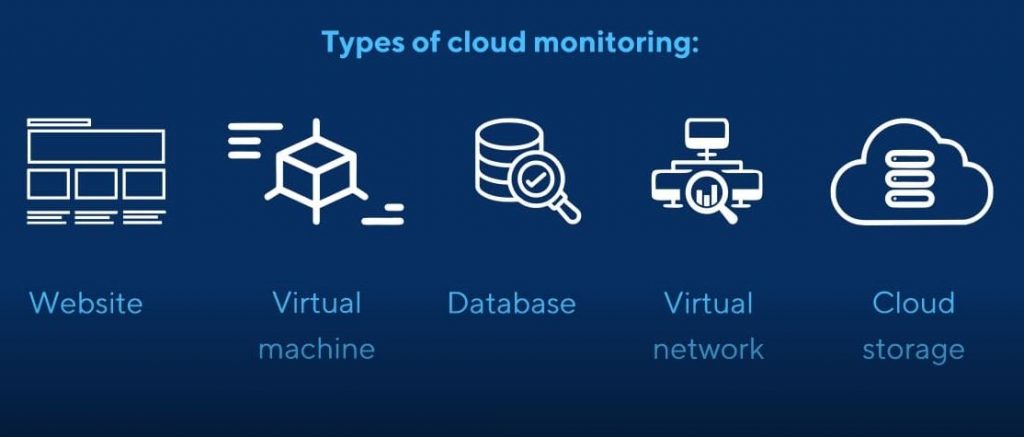
Be it on the premise or on the cloud, each business needs to ensure that its applications and services are running smoothly and also productively.
In addition to both the web and cloud applications, a cloud-based monitoring tool is need for monitoring cloud platforms, infrastructure, and networks.
For any web application deployed on the cloud, each business owner has questions related to the:
The overall bandwidth consumed by an application on a daily basis
The number of online users that using the application
The overall performance of the application on a cloud
The level of customer satisfaction with an application
Cloud-based monitoring services like CloudWatch enable to trace how application is performing on the cloud.
Additionally, identify the any performance bottlenecks or issues, thus enabling to remove them and improve anapplication performance.
This can help in business growth in long run.
With the increasing number anddifficult of AWS services, it’s no longer feasible to manually monitor the applications and services, hence need an automation tool like CloudWatch.
What are the benefits of Amazon CloudWatch?
Amazon CloudWatch offers the following five benefits to businesses:
1. Access all monitoring data from a single dashboard
Amazon CloudWatch allows to monitor data from various services using a single dashboard.
CloudWatch is natively integrated with the over 70 AWS-related services.
Cloud-based applications including an AWS applications create a large volumes of data through the metrics and logs.
CloudWatch allows simply collect and integrate all data from different applications and services and provide a visual representation of the analyzed data on the dashboard.
2. Collects and analyze metrics from AWS and on-premise applications
Thanks to its seamless integration with an over 70 AWS services, CloudWatch can gather and publish metric data automatically.
This contain 1-minute native – and customized – metrics with 1-second granularity.
CloudWatch is also encouraged on a hybrid AWS architecture that used both on-premises and cloud-based resources.
Using this metric and log data, now optimize an AWS services and resources to achieve a best performance and throughput.
3. Improve your operational efficiency and optimize your available resource
The Amazon CloudWatch service offers real-time insights into cloud operations that enable to optimize operational an efficiency and reduce costs.
By monitoring the utilization of an AWS resources, can be better informed of the typeof workload capacities that need require for anapplications.
Through the use of configured alarms, CloudWatch can automate an actions based on preconfigured thresholds or on basis of machine learning algorithms that can find anomalies in the metric data.
4. Improve operational visibility
With the Amazon CloudWatch service, gain operational visibility across all the running applications, networks, infrastructure stacks, and other AWS services.
For instance, can use CloudWatch to screen the memory usage and bandwidth for any application, so as to find them for better performance.
Additionally, can perform metric-related mathematical operations to derive an operational insights from the data.
For instance, aggregate memory usage across the multiple EC2 instances.
As a result, gain complete visibility of an entire system and can find and resolve any performance problems.
5. Extract valuable insights
Finally, Amazon CloudWatch enables to extract valuable and actionable insights from created logs of various AWS services and applications.
With CloudWatch, only need to pay for the log queries that can run, which can also scale with more log volume and complexity.
How to create CloudWatch Dashboards?
Amazon CloudWatch dashboards are customizable dashboards that offer a unified view of all the AWS resources – including those that are located in various AWS regions. As an AWS administrator, create an unlimited number of CloudWatch dashboards on the AWS account.
You can made the dashboard using the:
- CloudWatch console
- PutDashboard API
how can create a CloudWatch dashboard by using the CloudWatch console:
- 1. Open the CloudWatch console.
- 2. From a navigation pane, click Dashboards > Create a dashboard.
- 3. From the “Create new dashboard” box that appears, enter the dashboard name and then click “Create a dashboard.”
- If enter the dashboard name as “CloudWatch-Default,” dashboard will be displayed on a CloudWatch home page. Alternatively, if use the name “CloudWatch-Default-
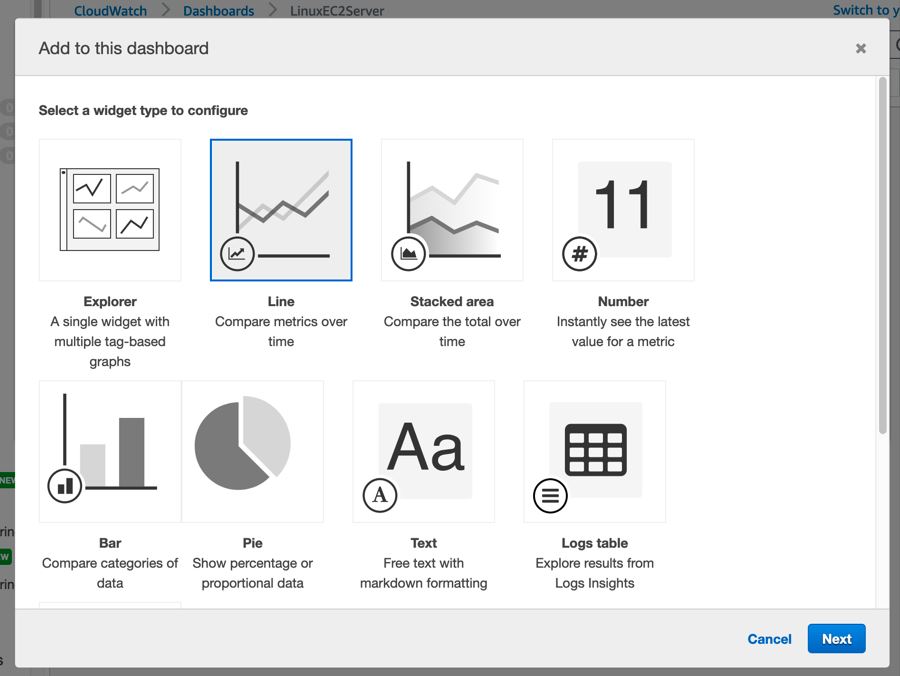
- 4. As required, perform any of a following actions in the “Add to this dashboard” box:
a. To add a graph to the dashboard:
Select either Line or the Stacked Area and then click a Configure.
From the “Add metric graph” dialog box, choose the metrics to included in the graph and then click a “Create widget.”
b. To add a number that displays a metric on a dashboard:
Select Number and then click the Configure.
Select metrics to be included in the graph from a “Add metric graph” dialog box and then click a “Create widget.”
c. For adding a text block to a dashboard:
Select Text and then click a Configure.
From the “New text widget” dialog box, choose “Markdown” and then add and a format of text.
Click “Create widget.”
- 5. Repeat Step 4 to add more dashboard widgets if need
- 6. Save the dashboard.
Can also create or modify a CloudWatch dashboard by using the PutDashboard API function.
Here are some of the general parameters that are used with this API:
DashboardName (mandatory): denote the dashboard name in String format.
DashboardBody (mandatory): contains all the dashboard data including the widgets to be added and their location on a dashboard.
How to create and configure CloudWatch Alarms?
Amazon CloudWatch allows to made both the following types of alarms:
Metric alarms screen a single metric or a math metric that is based on the mathematical expression.
Composite alarms are triggered only if the condition for all other configured alarms are satisfied.
can also create an alarm that is based on:
- Static threshold of the single metric
- Anomaly detection
- Metric math expression
How can create a CloudWatch alarm – based on the single metric – using the CloudWatch console:
- 1. Open the CloudWatch console.
- 2. From the navigation pane, click Alarms > Create Alarm.
- 3. Select metric and then perform either of the below actions:
Select the service namespace containing the metrics that need to include.
Search for a metric in the search box and then press a Enter.
- 4. From the “Graphed metrics” tab, perform the below actions:
From Statistics, choose any of an available statistics or percentiles.
From Period, denote the evaluation period of the alarm.
Click “Select metric” to display the “Specify metric and conditions” page that display all information of the metric and statistics that can have specified.
- 5. From the “Conditions” tab, perform the following actions:
Specify the name and description of an alarm.
Use the “Whenever is” field to specify the threshold value of a metric.
Click “Additional configuration.”
In “Datapoints to alarm,” denote the number of evaluation periods (or data points) required to trigger the alarm.
From “Missing data treatment,” configure the alarm settings in the event of missing data points.
Click Next.
- 6. From the “Notification” tab, select an Amazon SNS topic that should be notified when an alarm is triggered.
- 7. Select the respective options if need the alarm to perform auto-scaling or any other EC2 actions.
- 8. In the “Preview and create” tab, preview the alarm settings and then click a “Create alarm.”
How create a CloudWatch alarm – based on an anomaly detection – by using the CloudWatch console:
- 1. Perform Steps 1 to 4 as specified the above.
- 2. From the “Conditions” tab, perform the below actions:
Select the “Anomaly detection” option
Use the “Whenever is” field to denote the range of metric values that can trigger the alarm.
Specify the anomaly detection number in a “Anomaly detection threshold” field
Click “Additional configuration.”
In “Datapoints to alarm,” denote the number of evaluation periods (or data points) need to trigger the alarm.
From “Missing data treatment,” configure an alarm settings in the event of missing data points.
Click Next.
- 3. Perform Steps 6 to 8 (as specified above) to made the alarm.
- 1. Perform Steps 1 to 4 as specified in a first procedure.
- 2. Click “Add a math expression” to add the new row for the expression:
- Add a math expression under the “Details” for column of the new row.
- Add a metric or other mathematical expression under the “Id” column.
- Add more math expressions if needed.
- 3. Click “Select metric” to show the “Specify metric and conditions” page that shows data of the metric math expression that have specified.
- 4. Perform the remaining steps
- 5. Perform Steps 6 to 8 (as specified in the first procedure) to generate the alarm.
Conclusion
Using the Amazon CloudWatch service, that can monitor cloud-based applications and other AWS services and troubleshoot any performance problems With its single and centralized dashboard, an AWS administrators now have complete visibility into an applications and services running in a same or various AWS regions.