
- Financial Performance – A Complete Tutorial
- How Six Sigma Principles Can Progress Your Productivity – Tutorial
- Google Analytics Pro Tutorial | Fast Track your Career
- Activity-Based Costing Tutorial | Know about Definition, Process, & Example
- Create a workbook in Excel Tutorial | Learn in 1 Day
- Excel ROUNDUP Formula Tutorial | Learn with Functions & Examples
- Business Analytics with Excel Tutorial | Learn In 1 Day
- SAP Tutorial – Free Guide Tutorial & REAL-TIME Examples
- IBM SPSS Statistics Tutorial: Getting Started with SPSS
- SAP Security Tutorial | Basics & Definition for Beginners
- SAP Simple Finance Tutorial | Ultimate Guide to Learn [Updated]
- SAP FIORI Tutorial | Learn in 1 Day FREE
- Introduction to Business Analytics with R Tutorial | Ultimate Guide to Learn
- Tableau Desktop Tutorial | Step by Step resource guide to learn Tableau
- Implementing SAP BW on SAP HANA | A Complete Guide
- SAP HANA Administration | Free Guide Tutorial & REAL-TIME Examples
- Tableau API Tutorial | Get Started with Tools, REST Basics
- SAP FICO ( Financial Accounting and Controlling ) Tutorial | Complete Guide
- Alteryx Tutorial | Step by Step Guide for Beginners
- Getting started with Amazon Athena Tutorial – Serverless Interactive | The Ultimate Guide
- Introduction to Looker Tutorial – A Complete Guide for Beginners
- Sitecore Tutorials | For Beginners Learn in 1 Day FREE |Ultimate Guide to Learn [UPDATED]
- Adobe Analytics Tutorial – The Ultimate Student Guide
- Splunk For Beginners – Learn Everything About Splunk with Free Online Tutorial
- An Overview of SAP HANA Tutorial: Learn in 1 Day FREE
- Statistical Package for the Social Sciences – SPSS Tutorial: The Ultimate Guide
- Splunk For Beginners – Learn Everything About Splunk with Free Online Tutorial
- Pentaho Tutorial – Best Resources To Learn in 1 Day | CHECK OUT
- Statistical Package for the Social Sciences – SPSS Tutorial: The Ultimate Guide
- An Overview of SAP HANA Tutorial: Learn in 1 Day FREE
- Spotfire Tutorial for Beginners | Quickstart – MUST- READ
- JasperReports Tutorial: Ultimate Guide to Learn [BEST & NEW]
- Charts and Tables – Qlikview Tutorial – Complete Guide
- TIBCO Business Works | Tutorial for Beginners – Learn From Home
- Cognos TM1 Tutorial : Learn Cognos from Experts
- Kibana
- Power BI Desktop Tutorial
- Tableau Tutorial
- SSAS Tutorial
- Creating Tableau Dashboards
- MDX Tutorial
- Tableau Cheat Sheet
- Analytics Tutorial
- Lean Maturity Matrix Tutorial
- MS Excel Tutorial
- Business Analysis Certification Levels & Their Requirements Tutorial
- Solution Assessment and Validation Tutorial
- Lean Six Sigma Tutorial
- Enterprise Analysis Tutorial
- Create Charts and Objects in Excel 2013 Tutorial
- Msbi Tutorial
- MicroStrategy Tutorial
- Advanced SAS Tutorial
- OBIEE Tutorial
- Tableau Server Tutorial
- OBIA Tutorial
- Business Analyst Tutorial
- Cognos Tutorial
- Qlik Sense Tutorial
- SAP-Bussiness Objects Tutorial
- SAS Tutorial
- PowerApps Tutorial

Introduction to Business Analytics with R Tutorial | Ultimate Guide to Learn
Last updated on 10th Aug 2022, Blog, Business Analytics, Tutorials
Introduction :
R is a GNU project that is freely available under the GNU (General Public License). R also comes with double forms that have been pre-assembled for a very long time for frameworks from Unix and other similar frameworks (FreeBSD, Linux), Windows, and moreover MacOS. launch of the “R programming Language”! The R Development Core Team now develops the R programming language, which was originally established by Ross Ihaka and Robert Gentleman at the University of Auckland in New Zealand. The computer language “S,” developed by John Chambers at Bell Labs, is executed in “R.”
Types:
R is a powerful endeavor-driven programming language that has the following notable components:
R is free and open-source software! Yes, R is totally free! It is authorized under GPL (similarly as Linux) and you have all the opportunity to do whatever you like to do with R! You can be just about as innovative as could be expected and make fascinating adjustments with regards to it. R is open for incorporation into different frameworks as well. While dealing with R programming language, you can get information whether it is on SAS, SPSS, SQL Server, Oracle or Excel and furthermore coordinate R in different applications and web-servers.
R is used to write computer programmes for data analysis! R is a crucial information analysis tool that includes a huge selection of computations for data recovery, handling, examination, and high-quality measurable examples. General factual techniques like mean, middle, circulations, covariance, relapse, non-direct blended impacts, GLM, GAM, and the list goes on have the underpinnings in R.The R programming language’s components may access every area of the research findings and combine logical reasoning to reach precise conclusions that are crucial for organizations. For instance, precise information on the number of people (and their experiences) using a particular adaptable phone might be quite beneficial to a portable corporation in running its business.
Key characteristics of Business Analytics With R:
1.R is a free and open-source programme!:
R is indeed free! You have complete flexibility to do whatever you want with R because it is GPL-licensed (like Linux). You can be as imaginative as you like and make intriguing changes to it. R is adaptable and can be integrated into other systems. You can retrieve data from SAS, SPSS, SQL Server, Oracle, or Excel while working with the R programming language. You can also integrate R with different applications and web servers.
2. R is a computer language developed for data analysis!:
The main function of R is data analysis, and it contains a large number of algorithms for data retrieval, processing, analysis, and advanced statistical visualizations. The list of integrated universal statistical methods in R is endless and includes mean, median, distributions, covariance, regression, non-linear mixed effects, GLM, GAM, and more. The R programming language’s features can access all regions of research results and integrate different analytical techniques to come to specific, important conclusions for enterprises.
3. Object-oriented programming is used in R!:
In fact, it is true! The R programming language features robust object-oriented programming capabilities when compared to other statistical languages. This is due to the fact that the programming language R evolved from S. Despite being skilled at creating completely object-oriented applications, R bases its OOP approach on generic functions rather than class hierarchies. Three OOP systems, S3, S4, and R5, make up the package R. The ideas of classes and methods constitute the foundation for these features. Comparing R to common object-oriented languages like Perl, Python, Ruby, and so on would be unjust.
4. R is a computer language that can be translated!:
R is frequently an interpreted programming language that has amazing branching, looping, and modular programming capabilities using functions. Functionality for a wide range of statistical operations, including time series analysis, traditional parametric and nonparametric tests, linear and nonlinear regression models, clustering, smoothing, and more, is included in the R distribution. Additionally, expert R programmers can write “C” code to interact directly with R objects.
5. R generates top-notch graphics!:
The versatile graphical environment of R programming provides a large range of graphical functions for data presentations, including bar graphs, pie charts, histograms, time series, dot plots, image plots, 3D surfaces, scatter plots, maps, etc. With R, you may create countless variations of your visuals and create original graphics by fusing various graph kinds.
6. Advanced Analytics are provided via Business Analytics with R!:
Rmetrics Project for computational finance and BioConductor for the analysis and comprehension of high-throughput genomic data are just two examples of the outstanding domain-specific R suites available. In addition to these suites, there are a number of add-on packages for R, including Task Views and CRAN (a network of ftp and web servers set up globally to hold the most recent and identical versions of the code and documentation for R) (Guides for the R functions and packages which are handy for certain methodologies and disciplines).
7. The community for Business Analytics with R is close-knit!:
The 2 million-strong R programming language community is thriving and expanding quickly! R has evolved into a programming culture among programmers all around the world. You may quickly search the internet for websites, forums, blog entries, and publications about the R programming language. For instance, you may search, evaluate, and tag CRAN programmes on Crantastic, a community website for R packages. Use the hashtag #rstats on Twitter to find R tweets on the social media platform.
Making preparations for predictive modeling:
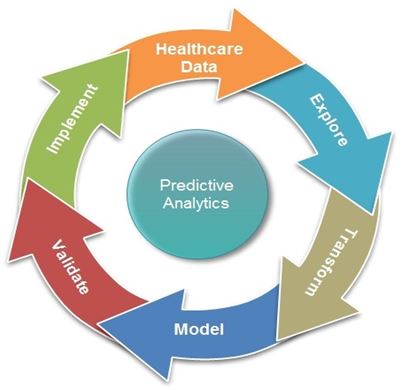
In this first chapter, we’ll get things going by creating a common language for models and examining the predictive modeling procedure in depth. This chapter will give a brief overview of the important distinctions of both fields, which are crucial information for a predictive modeler. A large portion of predictive modeling involves the fundamental ideas of statistics and machine learning. We’ll place special emphasis on the value of understanding how to assess a model that is suitable for the kind of issue we’re seeking to address. In addition to a caret, a very helpful R package for predictive modelers, we will also show off our first model, the k-nearest neighbors model, in the last section.
Models:
Because models are the foundation of predictive analytics, we’ll start our trip by discussing models and what they look like. A model is a representation of a condition, process, or system that we are attempting to comprehend and make sense of. We create models so that we can deduce things from them and, more significantly for this book, so that we can forecast the future. In this book, we will examine some of the many various shapes and flavors that models can take. Models can be a collection of rules or an equation that connects variables that we can see or measure. a straightforward concept that most of us are familiar with from school
Understanding data:
The models we shall examine in this book have two crucial and defining features. The first of them is that, in the discipline of predictive analytics, models are constructed from data rather than from technical specifications or business rules, mathematical reasoning, logical induction, or known facts. More specifically, we will assume that we will begin with some data that is somehow connected to or derived from the work at hand for any particular prediction task that we wish to complete. For instance, if we wish to develop a model to forecast annual rainfall in different regions of a country, we might have gathered (or have the means to collect)
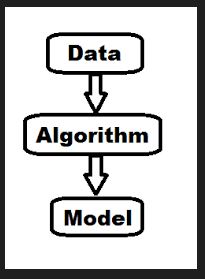
The core components of a model:
We have so far established several fundamental ideas underlying models and a common vocabulary for discussing data. We’ll examine the fundamental elements of a statistical model in this section. The essential elements are typical:
- a series of equations whose variables need to be adjusted
- a few typical data for the system or procedure we’re attempting to simulate
- a notion that defines the goodness of fit of the model
- a technique for updating the parameters to raise the goodness of fit of the model
Types of models:
Now that we have a general understanding of what makes up a model, we can investigate some of the frequent distinctions modelers make to classify various models.Models for reinforcement learning that are supervised, unsupervised, semi-supervised, andThe iris data set, which included four characteristics and one output variable, namely the species variable, has already been examined. The distinguishing feature of the supervised learning setting—the most typical situation encountered—is having the output variable available for all the observations in the training data. In a nutshell, the benefit of training a model in a supervised learning environment is that we know the precise prediction to make for each data point in our training set.
Statistical and non-statistical models:
The majority of the models we will come across are parametric models, and we saw an illustration of a straightforward linear model in the section before this one. The trait of parametric models is that they frequently describe a functional form. In other words, they narrow down the issue of choosing from among all feasible functions for the target function to a certain family of functions that make up a parameter set. Choosing exact values for the parameters simply requires choosing the specific function that will define the model. So, going back to our three-feature linear model example, we can see that we have the two options for parameters shown below.
Models for regression and categorization:
In general, supervised learning is crucial to the distinction between regression and classification models, which has to do with the kind of output we’re trying to predict. Regression models attempt to forecast a quantitative or numerical value, such as the stock market index, the volume of precipitation, or the price of a project. Classification models attempt to predict a value from a limited range of classes or categories, despite their potential for being rather extensive. Predicting a website’s subject, a user’s next word, a person’s gender, or if a patient has a specific disease based on a set of symptoms are a few examples of this.
1. Motives for Including R under the category of Complete Analytical Environment:
For the following reasons, R qualifies as a full analytical environment.Multiple operating systems and interfaces for entering commands: R offers many interfaces, from the command line to a variety of specialized graphical user interfaces (GUIs) for desktop use (Chap. 2). SNOW, RApache, RMpi, R Web, and Rserve are just a few of the numerous packages available in R today for clusters, cloud computing, and remote server settings.
2. B’s additional benefits over other analytical software:
The source code for R is built to guarantee full embedding and tailored solutions for a specific application. The benefit of open source code is that it has undergone thorough peer evaluation in journals and academic literature. This implies that flaws will be discovered, their details will be disseminated, and solutions will be provided openly. Aside from the most recent version of Tableau Software, R provides the best data visualization tools. R offers a large range of customisable animation and visuals for use in its extensive data visualization. The graphical library of packages in R was more sophisticated and was adding new features every day, which is the main reason why third-party software first started developing interfaces to R.
3. Disparities Between R as an Analytical Platform and R as a Statistical Language:
It does occasionally become necessary to distinguish between statistical computing and analytics. Analytics is more focused on business goals than statistics, which is more instrument and technique based. In essence, statistics are numerical data that describe, recommend, or forecast (predictive). Analytics is a tool that supports decision-making. Purely statistical and non analytical analytics are those on which no choice is to be taken or is being evaluated. Therefore, the simplicity of making the right selection distinguishes a good analytical platform from one that is less so.
4. The Price and Advantages of Using R:
Utilizing R has only one expense: the time required to master it. The lack of a marketplace for packages or applications where developers can earn money for developing new packages discourages professional mainstream programmers from using R to the extent that several other platforms, such as iOS, Android, and Salesforce, provide better opportunities for coding professionals to make money. However, the number of R packages has increased enormously over the past few years due to the current passion and engagement of the enormous numbers of R developers, who are mostly sponsored by academics. The benefits of R for business analytics, data mining, and business intelligence/data visualization—three distinct fields in the data sciences—are listed below.
5. Combining SAS and R:
The resources listed below provide an overview of how to use SAS Institute products with R: Base. SAS, SAS/Graph, and SAS/Stat.
6. Short Interview: Using JMP and R:
The SAS Institute’s adoption of R as a supplementary language shows how far R has advanced from being a marginal player to a widely used statistical computing platform. This is a brief excerpt from an interview with researcher Kelci Miclaus from the SAS Institute’s JMP branch from February 2012, which also contains a case study on how using R might benefit analytics companies even more.
Types of Business Analysis :
- Descriptive analysis
- Diagnostic analysis
- Predictive analytics
- Prescriptive analytics
1. Descriptive analysis: To comprehend what has occurred in the past or what is happening right now, summarize the data that your business currently has. Because descriptive analysis involves data collection and mining procedures, it is the most straightforward type of analysis. Members of organizations like shareholders, investors, marketing executives, and sales executives now have access to data. gives information on customer behavior and assists in identifying strengths and weaknesses. This aids in defining potential focused marketing strategy development.
2. Diagnostic analysis: By focusing on present occurrences rather than historical performance, this kind of analysis helps identify the trends’ underlying causes. To find the reason for the event, employ methods like data mining, drilldown, and data detection. Probabilities and probabilities are used in diagnostic analysis to determine why an event occurs. For classification and regression, methods like sensitivity analysis and training algorithms are employed.
3 Predictive analytics: Statistical models and machine learning (ML) approaches are employed in this type of analysis to forecast the likelihood of upcoming events. Create a model based on the findings of the descriptive analysis to estimate the likelihood of an item. Predictive analytics is performed by experts in machine learning. Greater precision is possible than with only business intelligence. Sentiment analysis is one of the most widely used applications. Social media user data already available is gathered and used to construct a complete picture of the user’s viewpoint. This information is examined to forecast their feelings (positive, neutral, or negative).
4. Predictive analytics: It goes beyond predictive analytics to make recommendations for suboptimal actions. It recommends specific actions to achieve the desired outcomes and suggests all favorable outcomes based on a specific course of action. It is primarily based on two factors: a powerful feedback system and continuous iterative analysis. Discover the link between actions and their consequences. A common application for this type of analysis is the development of a recommender system.
Business Analytics FAQs:
1. What exactly is enterprise analytics? In a nutshell, business analytics is a method by which organizations use various technological and statistical techniques to investigate data in order to gain new insights that can also aid in decision-making.
2. What is the purpose of enterprise analytics? Business Analytics is responsible for a variety of tasks. They work on using statistical data, big data, and information visualization as a resource in business selection and imposing organizational changes. They also aid in the prediction of outcomes based entirely on insights and the making of informed decisions.
3. The three primary types of enterprise analytics are: Descriptive Statistics Analytics Predictive Analytics for Prescription
4. Can you give me some examples of enterprise analytics? Today, almost every business makes use of business analytics. Growing advertising strategies, increasing sales, improving economic efficiency, streamlining processes, increasing productivity, and using predictive analytics are some real-world examples of enterprise analytics.
5. Is business analytics a viable career path? Yes, business analytics is a rewarding career. Organizations rely on Business Analysts to provide valuable insights that can be used in decision making. Business analytics specialists are needed in all industries, including financial institutions and e-commerce sites. Upskilling withinside the area of enterprise analytics assists you to energy beforehand your profession.
6. How difficult is enterprise analytics? The learning of consequences may also differ from one character to the next. Some people may find enterprise analytics difficult, while others may be able to quickly grasp the concepts. However, deciding on the best method of learning (online guides, video tutorials, books, etc.) will make it easier. Choosing the best online guides with mentor guidance will make the journey much easier.
7. Is an enterprise analyst a job in IT? A comprehensive set of technical skills, including statistical evaluation software, SQL and database query languages, information mining, information visualization, enterprise intelligence, and tender skills, is required for an enterprise analyst. IT Business Analyst is one of the career paths you can pursue as a student.
8. Is coding required for enterprise analytics? Business Analytics is heavily focused on data. However, some of those tools may also include SQL and Python, so having some coding and programming knowledge is required. The requirements may also differ depending on the company and your job description.
9. What skills are required for an enterprise analyst? Some of the skills required for enterprise analysts include: Analytical and problem-solving abilities Proficiency in oral and written communication Basic programming language understanding Understanding of business shapes Analysis of Cost-Benefit Statistical analysis software (e.g. R, SAS, SPSS, or STATA)
10. How do I get started in business analytics? There is no one-size-fits-all way to begin a career in business analytics. Taking charge of the PGP Data Science.
Conclusion:
Thus, one thing we discovered about the R programming language is that it is virtually limitless in terms of data analysis. It has some outstanding features that should be investigated further for a powerful and flexible data computation. With the way R’s functionality and popularity are growing, the R programming language will be around for a long time, assisting organizations in the complex process of data analysis.