
- What is Dimension Reduction? | Know the techniques
- Top Data Science Software Tools
- What is Data Scientist? | Know the skills required
- What is Data Scientist ? A Complete Overview
- Know the difference between R and Python
- What are the skills required for Data Science? | Know more about it
- What is Python Data Visualization ? : A Complete guide
- Data science and Business Analytics? : All you need to know [ OverView ]
- Supervised Learning Workflow and Algorithms | A Definitive Guide with Best Practices [ OverView ]
- Open Datasets for Machine Learning | A Complete Guide For Beginners with Best Practices
- What is Data Cleaning | The Ultimate Guide for Data Cleaning , Benefits [ OverView ]
- What is Data Normalization and Why it is Important | Expert’s Top Picks
- What does the Yield keyword do and How to use Yield in python ? [ OverView ]
- What is Dimensionality Reduction? : ( A Complete Guide with Best Practices )
- What You Need to Know About Inferential Statistics to Boost Your Career in Data Science | Expert’s Top Picks
- Most Effective Data Collection Methods | A Complete Beginners Guide | REAL-TIME Examples
- Most Popular Python Toolkit : Step-By-Step Process with REAL-TIME Examples
- Advantages of Python over Java in Data Science | Expert’s Top Picks [ OverView ]
- What Does a Data Analyst Do? : Everything You Need to Know | Expert’s Top Picks | Free Guide Tutorial
- How To Use Python Lambda Functions | A Complete Beginners Guide [ OverView ]
- Most Popular Data Science Tools | A Complete Beginners Guide | REAL-TIME Examples
- What is Seaborn in Python ? : A Complete Guide For Beginners & REAL-TIME Examples
- Stepwise Regression | Step-By-Step Process with REAL-TIME Examples
- Skewness vs Kurtosis : Comparision and Differences | Which Should You Learn?
- What is the Future scope of Data Science ? : Comprehensive Guide [ For Freshers and Experience ]
- Confusion Matrix in Python Sklearn | A Complete Beginners Guide | REAL-TIME Examples
- Polynomial Regression | All you need to know [ Job & Future ]
- What is a Web Crawler? : Expert’s Top Picks | Everything You Need to Know
- Pandas vs Numpy | What to learn and Why? : All you need to know
- What Is Data Wrangling? : Step-By-Step Process | Required Skills [ OverView ]
- What Does a Data Scientist Do? : Step-By-Step Process
- Data Analyst Salary in India [For Freshers and Experience]
- Elasticsearch vs Solr | Difference You Should Know
- Tools of R Programming | A Complete Guide with Best Practices
- How To Install Jenkins on Ubuntu | Free Guide Tutorial
- Skills Required to Become a Data Scientist | A Complete Guide with Best Practices
- Applications of Deep Learning in Daily Life : A Complete Guide with Best Practices
- Ridge and Lasso Regression (L1 and L2 regularization) Explained Using Python – Expert’s Top Picks
- Simple Linear Regression | Expert’s Top Picks
- Dispersion in Statistics – Comprehensive Guide
- Future Scope of Machine Learning | Everything You Need to Know
- What is Data Analysis ? Expert’s Top Picks
- Covariance vs Correlation | Difference You Should Know
- Highest Paying Jobs in India [ Job & Future ]
- What is Data Collection | Step-By-Step Process
- What Is Data Processing ? A Step-By-Step Guide
- Data Analyst Job Description ( A Complete Guide with Best Practices )
- What is Data ? All you need to know [ OverView ]
- What Is Cleaning Data ?
- What is Data Scrubbing?
- Data Science vs Data Analytics vs Machine Learning
- How to Use IF ELSE Statements in Python?
- What are the Analytical Skills Necessary for a Successful Career in Data Science?
- Python Career Opportunities
- Top Reasons To Learn Python
- Python Generators
- Advantages and Disadvantages of Python Programming Language
- Python vs R vs SAS
- What is Logistic Regression?
- Why Python Is Essential for Data Analysis and Data Science
- Data Mining Vs Statistics
- Role of Citizen Data Scientists in Today’s Business
- What is Normality Test in Minitab?
- Reasons You Should Learn R, Python, and Hadoop
- A Day in the Life of a Data Scientist
- Top Data Science Programming Languages
- Top Python Libraries For Data Science
- Machine Learning Vs Deep Learning
- Big Data vs Data Science
- Why Data Science Matters And How It Powers Business Value?
- Top Data Science Books for Beginners and Advanced Data Scientist
- Data Mining Vs. Machine Learning
- The Importance of Machine Learning for Data Scientists
- What is Data Science?
- Python Keywords
Dispersion in Statistics – Comprehensive Guide
Last updated on 27th Oct 2022, Artciles, Blog, Data Science
- In this article you will get
- Introduction
- Definition of Statistics Dispersion
- Estimates of Dispersion
- Dispersion Measures and their types
- Calculating Dispersion
- Conclusion
Introduction
Statistics cannot be adequately explained by fundamental tendency measures. The suggestion between two statistics units will be the same even though they may differ. Therefore, one needs to comprehend the amount of variability in order to explain statistics. The dispersion measures are used to help provide this. Three often used metrics of dispersion are range, interquartile variety, and general deviation.
Definition of Statistics Dispersion
In statistics, the term “dispersion” refers to how dispersed a set of data is. Data that is distributed, stretched, or spread out among various categories is said to be in a condition of dispersion. Finding the magnitude of the distribution values that are predicted from the collection of data for the particular variable entails doing so. In statistics, the term “dispersion” refers to numerical data that is likely to change in any situation where the average value assumption is made.
The classification of the dataset into its own distinct dispersion criteria, such as variance, standard deviation, and range, in statistics facilitates the understanding of the dataset.
A collection of metrics called dispersion makes it possible to evaluate the caliber of data in a quantitatively objective way. Most data science courses begin with the fundamentals of statistics, and one such subject that you cannot afford to overlook is dispersion.
Estimates of Dispersion
Nearly the same unit is used in the dispersion measurements as in the quantity being measured. There are numerous measures of dispersion that we can use to gain deeper understanding of the data, including:
- Standard Deviation
- Skewness
- Range
Dispersion Measures and their types
Two basic categories of the Measure of Dispersion in Statistics provide strategies to gauge how diversely distributed the data is. In biological statistics, it is mostly employed. By determining whether or not they include units, we can quickly categorize them.
As a result, we can categorize the data into the following two groups:
- Measures of Absolute Dispersion
- Relative Dispersion Measures
Measures of Absolute Dispersion:
Absolute Measures of Dispersion is a measure of dispersion that has units; it uses the same unit as the initial dataset. The standard or mean deviation are two examples of the dispersion quantities used to indicate the absolute measure of dispersion. Rupees, centimeters, marks, kilogrammes, and other amounts that are measured according to the circumstance can all be used to describe the absolute measure of dispersion.
Types of Absolute Dispersion measures in statistics:
Range:The difference between the highest and smallest value of the data variability is measured by range. The most basic measure of dispersion is the range.The average of the values is used to generate the term “mean” (). Add all the results together, then divide the result by the total number of words to obtain the Mean.
Variance (2):The variance is easily computed by adding up the squared distances between each term in the distribution and the mean, dividing by the sum of those squared distances, and multiplying the result by the total number of terms in the distribution.
Standard Deviation:The square root of Variance is a common way to visualize standard deviation. Any data must first have a variance before the standard deviation can be calculated. The ideal way to measure dispersion is using standard deviation.
Mean deviation:Also referred to as an average deviation, mean deviation can be calculated using the mean or median of the data. A different item that follows the central tendency is used to depict mean deviation as its arithmetic deviation.
Relative Dispersion Measures:
In statistics, the values without units represent the relative measure of dispersion. To compare the distribution of two or more datasets, a relative measure of dispersion is employed.
The only distinction between the Relative Measure of Dispersion and the Absolute Measure of Dispersion is the quantity used for measurement.
Types of Relative Measure of Dispersion: Relative Measure of Dispersion is the calculation of the coefficient of Dispersion when two series that have significantly different averages are compared.
When comparing two series using various measurement units, the coefficient of dispersion is most frequently used.
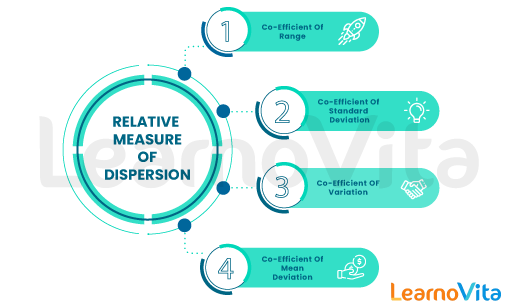
1.Coefficient of Range:This statistic is determined by dividing the difference between the distribution’s largest and smallest terms by the sum of those terms.
Formula:
- L = the greatest number and L – S / L + S
- S is the lowest value.
2.Coefficient of Variation:The coefficient of variation is used to compare the homogeneity or consistency of the two sets of data.
Formula:
- C.V. equals (/X)100 X equals standard deviation
- σ = mean
3.Standard deviation coefficient:The standard deviation coefficient is the ratio of the standard deviation to the mean of the term distribution.
Formula:
- σ = ( √( X – X1)) / (N – 1) (N – 1)
- Difference = ( X – X1)
- (Standard Deviation)
- N stands for “all”
4.Coefficient of quartile deviation:The ratio of the difference between the upper and lower quartiles to the total of the upper and lower quartiles is known as the coefficient of quartile deviation.
Formula:
- ( Q3 – Q3) / ( Q3 + Q1)
- Q3 is the upper quarter
- Q1 is the lower quartile.
5.Coefficient of Mean Deviation:Using the data’s mean or median, the coefficient of mean deviation can be calculated.
- Mean Deviation with Mean: X – M / N
- | X – X1 | / N Mean Deviation using Mean
When using Python with data science, this is made easier because the programming language provides a variety of statistical packages for this. These formulae are very useful when calculating various elements of data.
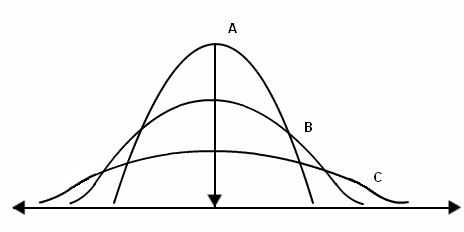
Why statistics should consider dispersion?
Grasp of statistics requires an understanding of dispersion. Understanding ideas like the diversification of the data, how the data is distributed, how it is preserved, and how the data is kept over the core value or central tendency is beneficial.In addition, statistics’ dispersion offers us a technique to learn more about the distribution of data.
For illustration,The Mean, Median, or Range of 3 independent samples may be the same, yet their levels of variability may be entirely different.
Calculating Dispersion
The many dispersion measures that are mentioned in the various types of Measures of Dispersion discussed above can be used to calculate dispersion with ease. It is crucial to comprehend the changes in words and usage before measuring the data.
The dispersion can be calculated using the method listed below:
- Typical standard deviation
- Variance
- Marginal deviation
Statistical dispersion representation:
Pie charts and graphs are two common ways to display dispersion in statistics. Some of the various techniques employed include:
- Box plots
- Stem plots
- Leaf plots
- Dot plots
Example: The values 3,8,6,10,12,9,11,10,12,7, what is their variance?The formula below can be used to determine how the values have varied:
- (σ2) = ∑ ( X − μ)2 / N \s(σ2) = 7.36
What is a prime instance of dispersion?
A non-statistical example of dispersion is the rainbow, which is made up of white light that is divided into seven distinct colors by wavelengths.
It can be measured statistically in the following ways:
- Average standard deviation
- Standard deviation of the mean
- Average absolute deviation
- Interquartile variation
- Typical deviation
Conclusion
In statistics, dispersion is a measure of how variable some data or words are. Where some of the instrumental measurements are determined to be inaccurate, such variability may result in random measurement mistakes.
It is a statistical method of expressing how the terms are distributed throughout the various data sets. The data is always found to be more dispersed the more sets of values there are. The values in this range can range from 5 to 10 to 1000 to 10,000. The range of descriptive statistics provides a description of this distribution of data. Dot plots, box plots, and other visual representations of statistics’ measures of dispersion are available. Learn about dispersion and other statistical concepts in the knowledgehut program’s beginning Python with Data Science course.