
- Financial Performance – A Complete Tutorial
- How Six Sigma Principles Can Progress Your Productivity – Tutorial
- Google Analytics Pro Tutorial | Fast Track your Career
- Activity-Based Costing Tutorial | Know about Definition, Process, & Example
- Create a workbook in Excel Tutorial | Learn in 1 Day
- Excel ROUNDUP Formula Tutorial | Learn with Functions & Examples
- Business Analytics with Excel Tutorial | Learn In 1 Day
- SAP Tutorial – Free Guide Tutorial & REAL-TIME Examples
- IBM SPSS Statistics Tutorial: Getting Started with SPSS
- SAP Security Tutorial | Basics & Definition for Beginners
- SAP Simple Finance Tutorial | Ultimate Guide to Learn [Updated]
- SAP FIORI Tutorial | Learn in 1 Day FREE
- Introduction to Business Analytics with R Tutorial | Ultimate Guide to Learn
- Tableau Desktop Tutorial | Step by Step resource guide to learn Tableau
- Implementing SAP BW on SAP HANA | A Complete Guide
- SAP HANA Administration | Free Guide Tutorial & REAL-TIME Examples
- Tableau API Tutorial | Get Started with Tools, REST Basics
- SAP FICO ( Financial Accounting and Controlling ) Tutorial | Complete Guide
- Alteryx Tutorial | Step by Step Guide for Beginners
- Getting started with Amazon Athena Tutorial – Serverless Interactive | The Ultimate Guide
- Introduction to Looker Tutorial – A Complete Guide for Beginners
- Sitecore Tutorials | For Beginners Learn in 1 Day FREE |Ultimate Guide to Learn [UPDATED]
- Adobe Analytics Tutorial – The Ultimate Student Guide
- Splunk For Beginners – Learn Everything About Splunk with Free Online Tutorial
- An Overview of SAP HANA Tutorial: Learn in 1 Day FREE
- Statistical Package for the Social Sciences – SPSS Tutorial: The Ultimate Guide
- Splunk For Beginners – Learn Everything About Splunk with Free Online Tutorial
- Pentaho Tutorial – Best Resources To Learn in 1 Day | CHECK OUT
- Statistical Package for the Social Sciences – SPSS Tutorial: The Ultimate Guide
- An Overview of SAP HANA Tutorial: Learn in 1 Day FREE
- Spotfire Tutorial for Beginners | Quickstart – MUST- READ
- JasperReports Tutorial: Ultimate Guide to Learn [BEST & NEW]
- Charts and Tables – Qlikview Tutorial – Complete Guide
- TIBCO Business Works | Tutorial for Beginners – Learn From Home
- Cognos TM1 Tutorial : Learn Cognos from Experts
- Kibana
- Power BI Desktop Tutorial
- Tableau Tutorial
- SSAS Tutorial
- Creating Tableau Dashboards
- MDX Tutorial
- Tableau Cheat Sheet
- Analytics Tutorial
- Lean Maturity Matrix Tutorial
- MS Excel Tutorial
- Business Analysis Certification Levels & Their Requirements Tutorial
- Solution Assessment and Validation Tutorial
- Lean Six Sigma Tutorial
- Enterprise Analysis Tutorial
- Create Charts and Objects in Excel 2013 Tutorial
- Msbi Tutorial
- MicroStrategy Tutorial
- Advanced SAS Tutorial
- OBIEE Tutorial
- Tableau Server Tutorial
- OBIA Tutorial
- Business Analyst Tutorial
- Cognos Tutorial
- Qlik Sense Tutorial
- SAP-Bussiness Objects Tutorial
- SAS Tutorial
- PowerApps Tutorial
IBM SPSS Statistics Tutorial: Getting Started with SPSS
Last updated on 11th Aug 2022, Blog, Business Analytics, Tutorials
What is Amazon Redshift?
Custom Tables enables summarizing SPSS Statistics data, and view analyses as presentation-quality, production-ready tables.It provides analytical capabilities to help from data, and provides advanced features that allow people to easily read and interpret.
What is a custom table in a database?
It cannot be portrayed as such an extension to a common application database table because it is a separate table.A hang-off table is a table with a many-to-one relationship with a constant application database table.
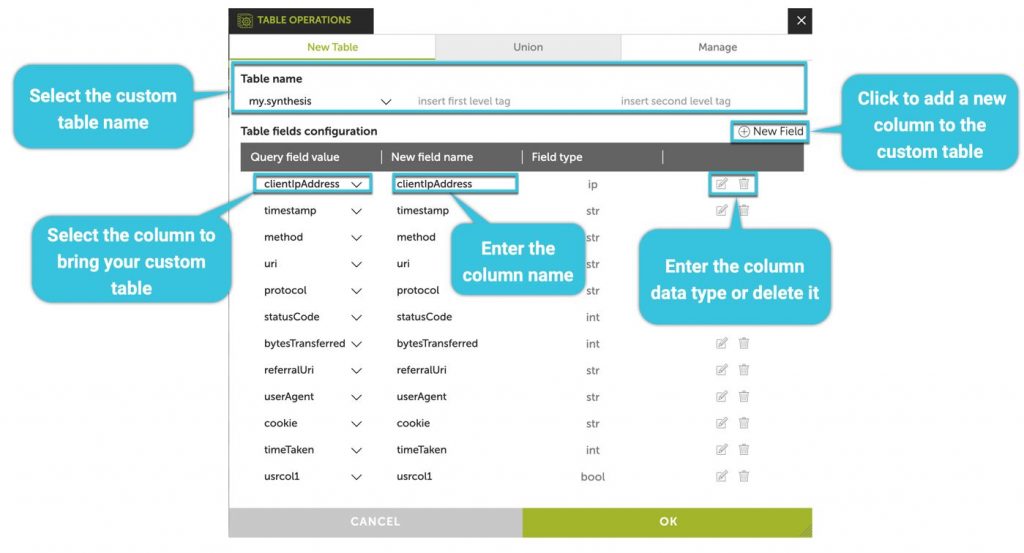
create a Custom Table:
To create Custom Tables, Sign in to Google Analytics.
- 1.Click Admin, and navigate to the relevant property.
- 2.In the PROPERTY column, click Custom Tables.
- 3.Click +New Custom Table.
- 4.Enter a title.
- 5.Select a view from the View drop-down menu.
- 6.Click +add dimension, and add up to six dimensions.
- 7.Click +add metric, and add up to 25 metrics.
- 8.If desired, click +add segments, and add up to four segments.
- 9.If desired, click +add filter.
- 10.Click Save.
After creating a Custom Table, it can take up to two days for unsampled data to display in the Custom Tables reports on the Customization tab.At that point, I would have the 2 days of data initiated from the creation date of the table.Analytics adds historical data for the thirty days prior to the creation date of the table.When the fresh, unsampled data becomes available, that prior data is also accessible.Likethat, if property is undergoing routine maintenance carried out by the Analytics system.It can take up to forty days for that historical data to appear.If property is undergoing routine maintenance, will see a message to that effect in the table.
Use Custom Table reports:
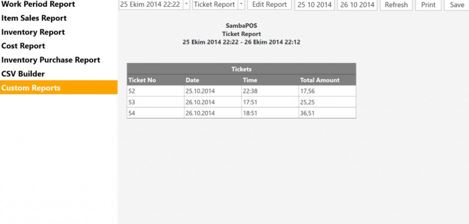
To see the reports created from Custom Tables, go to the Custom Tables section of the Customization tab.Make sure to select the view in which created the Custom Table.
What’s in the Custom Tables module?
More than a simple reporting tool, IBM SPSS Custom Tables combines comprehensive analytical capabilities with interactive table-building features to help learn from the data and communicate the results of analyses as professional-looking tables that are simple to read and interpret.
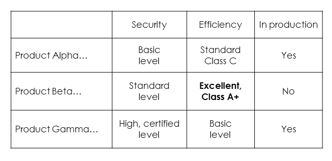
- Compare means or proportions for demographic groups, customer segments, time periods or other categorical variables when include inferential statistics.
- Select summary statistics – from easy counts for categorical variables to measures of dispersion – and sort categories by any summary statistic used.
- Choose from 3 significance tests: Chi-square test of independence, comparison of column means or comparison of column proportions .Drag and drop the variables onto the interactive table builder to create output as pivot tables.
- Preview tables in real time and change them as create them
- Exclude specific categories, view missing value cells and add subtotals to the tables.
- Operating systems supports: Windows, Mac, Linux
- Users frequently create crosstabs and mean reports in SPSS Statistics Base without the Tables module, then copy and paste the results into a different programme to make further changes before putting the results into their report.
- With IBM SPSS Tables, you have extensive control over the look and feel of tabular reports.
The following are some of IBM SPSS Tables’ key features:
- Capabilities for category management to examine missing value cells, exclude particular categories, and add subtotals to tables.
- Data collection and tabulation for numerous responses.
- Make tables that combine a wide variety of summary statistics: Means, medians, subtotals, percentiles, weighted and unweighted counts and percentages
- Control over the column titles, decimal display, typeface, and visible lines.
- The resulting tables can be represented in multiple formats by custom alterations and creation or use of TableLook templates before being exported to Word, Excel, PowerPoint, HTML or PDF.
IBM SPSS Custom Tables is an analytical tool that helps to augment the reports with information readers need to make more informed decisions.Use inferential statistics—also known as significance testing—in tables to perform common analyses:Compare means or proportions for demographic groups, customer segments, time periods, or other categorical variables; and identify trends, changes, or major differences in data.
IBM SPSS Custom Tables includes the following significance tests are:
- Chi-square test of independence
- Comparison of column means (t test)
- Comparison of column proportions (z test)
can also choose from a different summary statistics, which include everything from simple counts for categorical variables to measures of dispersion. Summary statistics are included for:
- Categorical variables
- Multiple response sets
- Scale variables
- Custom total summaries for categorical variables
When analysis is complete, can use IBM SPSS Custom Tables can be used to create customized tabular reports suitable for a variety of audiences—including those without a technical background.
Preview your tables during production:
With IBM SPSS Custom Tables’ interactive table preview builder see how tables look as to create or modify them. can make adjustments along the way, ensuring that the final table is exactly what is needed.
For example:
- Move variables from the row to column.
- Collapse big or complex tables for a more concise view.
- View variable categories while working with them—and before adding them to tables.
- Preview the assembly of variables (e.g., dimensions, stacking, or nesting), the categories of each variable, and requested statistics
Customize table layout and appearance:
IBM SPSS Custom Tables gives a more level of control over that layout and appearance of the tables.
For example:
- Make totals and subtotals without changing data file
- Make tables more precise by changing variable types or excluding categories.
- Sort categories by any summary statistic in the table and hide the categories that comprise subtotals.
- Select from 16 pre-formatted styles in TableLooks™ (found within IBM SPSS Statistics Base) or create your own styles.
- Through Statistics Base, can also add boldface lines; draw lines; align left, right, or center; and specify titles and footnotes.
Make results available easily:
IBM SPSS Custom Tables helps to high the workflow by producing all results as IBM SPSS pivot tables.Can simply export them to Microsoft® Word or Excel® with formatting intact.so the information gets to the right people-rapidly and accurately.