
- Tosca Automation Salary in India – How much does a tosca automation earn? [ Job & Future ]
- What is API Testing | Definition, Benefits, Types & Tool | All you need to know [ OverView ]
- Different Types of Testing in Software | Everything You Need to Know
- Automation Testing Vs Manual Testing | Know Their Differences and Which Should You Learn?
- Software Quality Management Techniques | A Complete Guide with Best Practices
- Manual Testing Vs Automation Testing| How its Work [ OverView ]
- What is Performance Testing? : A Complete Guide with Best Practices
- What is End-to-End (E2E) Testing? | A Definitive Guide | Everything You Need to Know
- Sanity Testing vs Smoke Testing : Know Their Differences and Which Should You Learn?
- Roles and Responsibilities of A Automation Test Engineer : All you need to know
- What Is The Scope of Software Testing?
- Certified Tester Foundation Level (CTFL) Certification
- Selenium IDE
- How to Handle Multiple Windows in Selenium?

Software Quality Management Techniques | A Complete Guide with Best Practices
Last updated on 04th Nov 2022, Artciles, Blog, Software Testing
- In this article you will learn:
- 1.Introduction to a Software Quality Management.
- 2.Tools for a Software Quality Management.
- 3.Features and Characteristics.
- 4.Types and methods.
- 5.Benefits.
- 6.Conclusion.
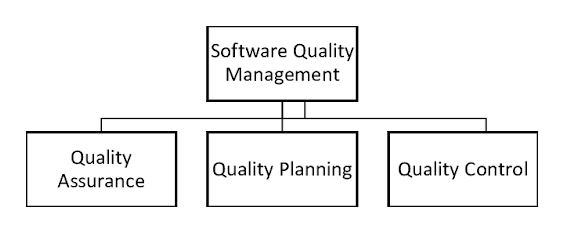
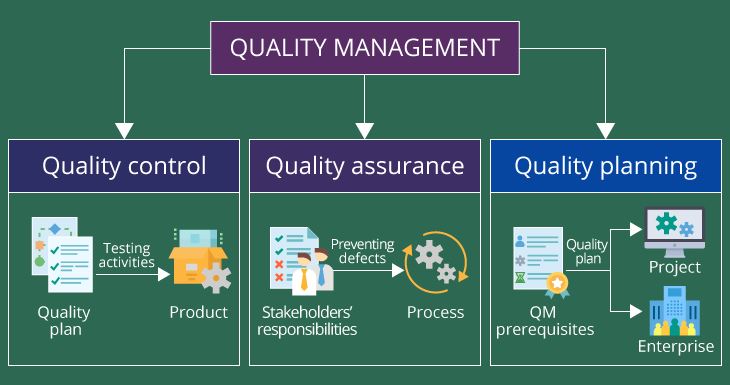
Introduction to a Software Quality Management:
- Within information system, software is tool and tools have to be selected for a quality and suitability.
- This is a role of requirements. But software is more than tool.
- It finds a performance of the system and therefore it is critical to a quality of system.
Tools for a Software Quality Management:
1. Flowchart:
- A flowchart is the diagram that represents workflow process, algorithm, or a step-by-step a process connected by the arrows in various directions.
- These flowcharts are used to represent an organisational structures, login systems, document a work process flows, billing transaction flows etc.
- Flowcharts allow us to identify an actual flow of events in a system. It is a stage of a process that will provide an information or picture of what the process looks like and shed some light on a quality issues. The flowchart helps to identify where an exactly the quality problem lies in the process.
2. check sheet:
Check sheet is used to collect a data and information in simple format. It increases an accuracy in the data collection process with simple methods and formats. It also significantly reduces a data collection efforts. This data collection is based on a real facts and figures rather than any imaginary numbers and objects. This data collection method are produces some kind of a output and this output is in a various data format which is always simpler for analysis.
3. Cause-Effect Diagram:
- The cause-effect diagram is also known as a fish diagram because shape is somewhat similar to lateral view of a fish skeleton. During problem-solving everyone in a team has a various opinion about the problem or a root cause of the problem.
- The FISH The diagram captures all reasons, ideas and uses a brainstorming methods to identify strongest root cause. The cause-effect diagram records are causes of a specific problems or the problems related to the processor system. Will find many various causes for specific problem.
4. Pareto chart:
- A Pareto chart is the bar graph as well as line graph that graphically summarises the group of data. The data can be related to a cost, time, defects etc. Here the bars in the graph represent a values in descending order i.e longest bar on a left and the shortest bar on right and the cumulative total is a represented by lines.
- The left vertical line or axis represents a frequency of an events; This event may be a related to cost, defect or a some other unit of measurement. The right vertical axis are represents a cumulative percentage of a total number of events.
5. Control chart:
- Control charts, also known as a statistical process controls, are used to find whether business processes are in a state of control. A control chart is a graph that shows how a process changes are over time.
- If analysis of control chart indicates that a processes are stable and have a little variation and are under control, no change is a necessary to process control parameters.
- The control chart helps to find the sources of variation if a processes are not under control. This means that are corrective action is need for the a process control parameter.
6. Histogram:
- A histogram is the graphical representation in bar chart that shows where a pattern occurs in the variety of positions. It is a distribution of numerical data and it offers an essential information about a size and dispersion or spread of a set of a sample data.
- The numerical information can be of any type like a marks obtained during an examination, number of a new employees joined in a specific month, number of complaints are received per category etc. The histogram shows an intensity of a specific problem and displays the data in one go. visual format.
7. Scatter Diagram:
A scatter diagram is the graphical representation that shows a relationship between two variables. It is the quality management tool, in which the data is represented as point and each point on a graph indicates a value on a horizontal and vertical axis. Of these two variables, one variable is an independent and the other variable is a dependent on a first variable.New and updated a tools continue to the proliferate across a software quality spectrum, with an expansion options in a testing automation, performance testing,mobile testing, niche testing bug a tracking and more. Here are few favourite software quality tools:
- Selenium (Web Application Testing).
- Robot Framework (Acceptance Testing).
- Appium (mobile testing).
- Jmeter (load test).
- Jenkins (Continuous Testing).
- Postman / Robot Framework (API Testing).
- firebug/firepath (online debugging).
- GitLab (project and source code hosting).
- UIAutomator (Galen Framework).
- Pycharm, Eclipse (source code editor) etc.
Features and Characteristics:
Software quality is the judgement about a value of a software from a specific point of view. Software quality is an often decomposed into individual quality characteristics.
User perspective:
- There are more features that are important from a point of view of the user.
- Does a software provide a full range of a desired functionality for its intended purpose?
- Does a software work reliably to produce right results on a right inputs?
- Does a software function safely and securely in a response to bad input?
Is a software easy to use?
- Does a software act reactively or does it seem unnecessarily slow?
- Does a software work well with the other software employed by the user?
Operational perspective:
- Considering a user quality problems as important, the IT group responsible for a deploying and maintaining software may be concerned with the other issues.
- Is a software protected from a malicious attacks aimed at compromising the other components of IT infrastructure?
- Does a software make good use of a computing resources or does it seem to need more memory and processing power than is necessary?
Developer perspective:
- Beyond a user and operational perspectives, developers of a software may consider the other quality factors, particularly focusing on a quality of the source code.
- How simple is it to modify the software to adapt to changing needs?
- Whether a software can be adapted to operate a well on a variety of various computing platforms.
Types and methods:
Software testing can be divided into the several types. Every type has its own application, requirements, advantages and disadvantages. Software testing is majorly divided into the two different types: functional and non-functional testing.
Functional testing-
Functional tests are run to an ensure that a software under test conforms to a software requirement specification. Functional testing types are include:
Unit testing- Unit testing involves a testing independent modules of a software. This test is usually run by a programmer to test a compiled code.
Integration testing- Testing of all the modules of the software to an nensure that they work in a harmony with each other. This testing technique is a especially important in a distributed systems.
System test- Testing an entire system as per a software requirements.
Cleanliness test- a Prudence test checks whether planned functionality is working as an expected.
Smoke test- Smoke test checks are whether a software is fully tested or not.
Interface test- Interface testing finds whether two separate a components of the software can communicate with the each other.
Regression testing- Regression testing is a testing the application as a whole to test new change in functionality.
Beta/acceptance testing- Acceptance or user acceptance testing tests a software against its requirements to check a whether the end to end flow is as per a requirements of user.
Non-functional test-
Non-functional testing tests a non-functional requirements of a software to determine its performance, usability, and reliability. Non-functional test types are include:
Performance test- Performance testing checks a whether software performs to find a standards and a performance requirements.
load test- Load testing finds the behaviour of software under a specific load conditions that may cause a performance degradation.
Benefits:
- Increase a productivity of a development team.
- Improved Product Quality – Test statistics and defect a tracking are more accurate and up-to-date.
- Rework costs are be reduced as a defects are detected earlier in a software project development life cycle at each stage.
- Increased level of a confidence in existing a product management and future product development.
- The increased reliability would be are highly qualitative as a software produced.
- Save money.
- Inspires a client confidence.
- Maintains a great user experience.
- Brings a more benefits.
Conclusion:
Have explored all basic quality management and improvement tools here in this article.Every quality tool has unique features and benefits for a specific situation and these tools can be used for problem-solving depending on the situation. However not all the quality control tools can be used for problem-solving.