
- What is Dimension Reduction? | Know the techniques
- Top Data Science Software Tools
- What is Data Scientist? | Know the skills required
- What is Data Scientist ? A Complete Overview
- Know the difference between R and Python
- What are the skills required for Data Science? | Know more about it
- What is Python Data Visualization ? : A Complete guide
- Data science and Business Analytics? : All you need to know [ OverView ]
- Supervised Learning Workflow and Algorithms | A Definitive Guide with Best Practices [ OverView ]
- Open Datasets for Machine Learning | A Complete Guide For Beginners with Best Practices
- What is Data Cleaning | The Ultimate Guide for Data Cleaning , Benefits [ OverView ]
- What is Data Normalization and Why it is Important | Expert’s Top Picks
- What does the Yield keyword do and How to use Yield in python ? [ OverView ]
- What is Dimensionality Reduction? : ( A Complete Guide with Best Practices )
- What You Need to Know About Inferential Statistics to Boost Your Career in Data Science | Expert’s Top Picks
- Most Effective Data Collection Methods | A Complete Beginners Guide | REAL-TIME Examples
- Most Popular Python Toolkit : Step-By-Step Process with REAL-TIME Examples
- Advantages of Python over Java in Data Science | Expert’s Top Picks [ OverView ]
- What Does a Data Analyst Do? : Everything You Need to Know | Expert’s Top Picks | Free Guide Tutorial
- How To Use Python Lambda Functions | A Complete Beginners Guide [ OverView ]
- Most Popular Data Science Tools | A Complete Beginners Guide | REAL-TIME Examples
- What is Seaborn in Python ? : A Complete Guide For Beginners & REAL-TIME Examples
- Stepwise Regression | Step-By-Step Process with REAL-TIME Examples
- Skewness vs Kurtosis : Comparision and Differences | Which Should You Learn?
- What is the Future scope of Data Science ? : Comprehensive Guide [ For Freshers and Experience ]
- Confusion Matrix in Python Sklearn | A Complete Beginners Guide | REAL-TIME Examples
- Polynomial Regression | All you need to know [ Job & Future ]
- What is a Web Crawler? : Expert’s Top Picks | Everything You Need to Know
- Pandas vs Numpy | What to learn and Why? : All you need to know
- What Is Data Wrangling? : Step-By-Step Process | Required Skills [ OverView ]
- What Does a Data Scientist Do? : Step-By-Step Process
- Data Analyst Salary in India [For Freshers and Experience]
- Elasticsearch vs Solr | Difference You Should Know
- Tools of R Programming | A Complete Guide with Best Practices
- How To Install Jenkins on Ubuntu | Free Guide Tutorial
- Skills Required to Become a Data Scientist | A Complete Guide with Best Practices
- Applications of Deep Learning in Daily Life : A Complete Guide with Best Practices
- Ridge and Lasso Regression (L1 and L2 regularization) Explained Using Python – Expert’s Top Picks
- Simple Linear Regression | Expert’s Top Picks
- Dispersion in Statistics – Comprehensive Guide
- Future Scope of Machine Learning | Everything You Need to Know
- What is Data Analysis ? Expert’s Top Picks
- Covariance vs Correlation | Difference You Should Know
- Highest Paying Jobs in India [ Job & Future ]
- What is Data Collection | Step-By-Step Process
- What Is Data Processing ? A Step-By-Step Guide
- Data Analyst Job Description ( A Complete Guide with Best Practices )
- What is Data ? All you need to know [ OverView ]
- What Is Cleaning Data ?
- What is Data Scrubbing?
- Data Science vs Data Analytics vs Machine Learning
- How to Use IF ELSE Statements in Python?
- What are the Analytical Skills Necessary for a Successful Career in Data Science?
- Python Career Opportunities
- Top Reasons To Learn Python
- Python Generators
- Advantages and Disadvantages of Python Programming Language
- Python vs R vs SAS
- What is Logistic Regression?
- Why Python Is Essential for Data Analysis and Data Science
- Data Mining Vs Statistics
- Role of Citizen Data Scientists in Today’s Business
- What is Normality Test in Minitab?
- Reasons You Should Learn R, Python, and Hadoop
- A Day in the Life of a Data Scientist
- Top Data Science Programming Languages
- Top Python Libraries For Data Science
- Machine Learning Vs Deep Learning
- Big Data vs Data Science
- Why Data Science Matters And How It Powers Business Value?
- Top Data Science Books for Beginners and Advanced Data Scientist
- Data Mining Vs. Machine Learning
- The Importance of Machine Learning for Data Scientists
- What is Data Science?
- Python Keywords
What is Data Analysis ? Expert’s Top Picks
Last updated on 27th Oct 2022, Artciles, Blog, Data Science
- In this article you will learn:
- 1.What Is Data Analysis?
- 2.What Is the Process of Data Analysis?
- 3.Seven Principal kinds of knowledge Analysis.
- 4.What role does data analysis play in research?
- 5.How Do You Analyze Data?
- 6.Conclusion.
What Is Data Analysis?
Although numerous individuals, organisations, and specialists have varied approaches to data analysis, the majority of them may be condensed into a single term. Data analysis is the process of cleansing, modifying, and processing raw data in order to obtain useful, usable information that assists businesses in making educated decisions. The technique aids in mitigating the inherent risks associated with decision-making by offering valuable insights and facts, which are frequently displayed as charts, graphics, tables, and graphs.Every time we make a decision in our daily lives by examining what has occurred in the past or what will occur if we make that decision, we demonstrate a straightforward use of data analysis. This entails assessing the past or the future and making a decision based on that analysis.It is not commonplace to hear the term “big data” mentioned in data analysis conversations. Data analysis is essential for transforming massive amounts of data into valuable information.
What Is the Process of Data Analysis?
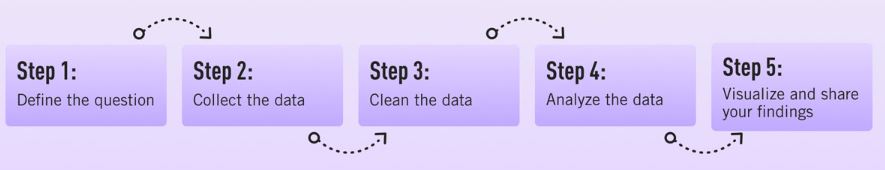
Answering “what is data analysis?” is merely the initial step. Now we will examine its performance. The process of data analysis, or alternatively, the processes of data analysis, entails collecting all the data, processing it, studying it, and utilising it to identify patterns and other insights. The steps involved in data analysis are:
- Ask yourself why you are conducting this study, what type of data you intend to use, and what data you intend to evaluate.
- Data Collection: Using the specified needs as a guide, it is now time to gather data from your sources. Sources include case studies, surveys, interviews, questionnaires, direct observation, and focus groups. Ensure that the collected data are organised for analysis.
- Not all of the data you acquire will be useful, so now is the time to clean it up. This procedure involves removing white spaces, duplicate records, and fundamental errors. Before submitting the material for analysis, data cleansing is required.
- Data Analysis entails utilising data analysis software and other tools to analyse and comprehend the data and draw conclusions. Excel, Python, R, Looker, Rapid Miner, Chartio, Metabase, Redash, and Microsoft Power BI are data analysis tools.
- Now that you have your results, you must interpret them and determine the most effective courses of action based on your findings.
- Data visualisation is a euphemism for “graphically displaying your information so that it can be read and understood by others.” You can utilise a variety of tools, including charts, graphs, maps, and bulleted lists. Visualization enables you to gain significant insights by comparing datasets and revealing relationships.
Seven Principal kinds of knowledge Analysis:
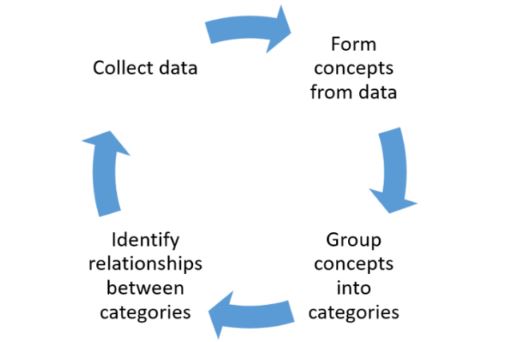
Before we delve into the seven major types of information analysis methodology, it’s vital that we have a tendency to quickly review the most classes of study, beginning with descriptive analysis and ending with prescriptive analysis. This will increase the quality and effort of information analysis, as well as the price to the business.
Explanatory Analysis:
The descriptive analysis methodology is the first step in every analytical method and seeks to answer the issue of what occurred by sorting, manipulating, and decoding data from various sources in order to transform it into useful information for the organisation. creative arts A descriptive analysis is important because it allows us to present our knowledge in a meaningful way, although it should be noted that this analysis alone cannot predict future results or answer questions such as the causes of the incident, nor does it organise and prepare your data for further analysis.
Cohort Evaluation:
Using historical data, this method of statistics analysis examines and analyses a specific section of individual behaviour, which is then grouped with others with similar characteristics. gaining a comprehensive understanding of customer needs or an in-depth understanding of a larger audience.Cohort analyses can be highly useful for doing marketing analyses since they allow you to determine the impact of your ads on certain customer groups. Assume, for instance, that you are running an email marketing campaign requesting that clients sign up for your website. To accomplish this, you design variations of the campaign with unique layouts, calls to action, and advertisement content. Later, you may use cohort analysis to track the efficacy of your marketing campaign over time and to determine the type of content that encourages your customers to join up, purchase again, or otherwise participate.Google Analytics is a useful tool for purchasing that began with the cohort evaluation method. Read this helpful guide to learn more about the advantages and limitations of using cohorts in GA.
Analysis of Regression:
Regression analysis uses historical data to determine how the cost of a dependent variable is influenced when one (linear regression) or more independent variables (multiple regression) change or stay the same. How they’ve performed in the past can help you predict their future performance and make better business decisions.If you want to delve deeper into this type of analysis, read this newsletter and learn more about how you might benefit from regression.
Fourth, Neural Networks:
The neural community bureaucracy is the basis for an intelligent system learning algorithms. It is a form of data-driven evaluation that attempts to determine, with minimal intervention, how the human mind processes comprehension and anticipates values. Neural networks investigate each of them independently. This implies that they will continue to evolve with each statistical transaction throughout time.
Predictive statistics evaluation is a common area of use for neural networks. There are BI reporting tools that implement this feature, such the predictive analytics device from datapine. Customers may make various kind of forecasts quickly and easily using this equipment. Simply choose the statistics to process depending on your KPIs, and the software programme will compute the forecasts based on current and previous information. Thanks to its user-friendly design, anyone in your organisation can control them. You should not be a sophisticated statistics expert.
Factor Evaluation:
Factor analysis, often known as “dimensionality reduction,” is a type of statistical analysis intended to explain the variance between observable linked variables in terms of presumably fewer unseen variables known as factors. To the discovery of unbiased latent variables, the ideal analytical method for maximising particular statistical segments.
The client’s appraisal of a product is an ideal instance of this method of statistical evaluation. The initial score is based on a variety of factors, including colour, shape, usability, modern trends, materials, comfort, place where the object was purchased, and frequency of usage. Therefore, the list might be unlimited depending on the circumstance.
Data mining:
A technique of evaluation This time period encompasses engineering metrics and insights for added value, direction, and context. Using exploratory statistical analysis, data mining attempts to identify dependencies, relationships, data patterns, and tendencies to develop and improve knowledge. Adopting a records mining mentality is crucial to success when considering how to analyse records; as a result, this topic is well worth exploring in greater detail.
The datapine intelligent records alerts are an exemplary form of data mining. With the assistance of artificial intelligence and machine learning, they provide automated signs depending on explicit instructions or occurrences inside a dataset. For instance, if you are monitoring provide chain KPIs, you may configure an intelligent alarm to trigger when invalid or low-quality records are detected. By doing so, you may be able to delve deeply into the issue and resolve it quickly and effectively.
Textual analysis:
Text assessment, often known as “text mining” in the business world, is the process of organizing large textual data sets in a way that makes them easier to manage. By adhering to this cleaning procedure in minute detail, you will be able to extract the data that is truly relevant to your business and use it to develop actionable insights that will move you forward.
Text analytics is made more efficient with the use of contemporary data analyst tools and techniques. The combination of machine learning and intelligent algorithms enables the execution of advanced analytic techniques, such as sentiment analysis. This method enables you to identify the goals and emotions of a text, such as whether it is positive, negative, or neutral, and then assign it a score based on positive attributes and classes relevant to your brand. Typically, sentiment analysis is used to determine brand and product recognition and the success of the customer experience. Check out this fascinating article to learn more about the topic.
By reading information from many word-primarily based sources, such as product evaluations, articles, social media interactions, and survey replies, you will gain valuable insights into your target market’s desires, preferences, and pain factors. This will allow you to create campaigns, services, and messages that fit the individual needs of your customers, expanding your target market and enhancing customer retention. One of the only pieces of data analysis equipment and methods you will ever purchase.
What role does data analysis play in research?
The majority of a researcher’s time is spent sifting through data. This is the literal definition of the term “research.” However, the information age of today frequently generates a deluge of data, sufficient to overwhelm even the most devoted researcher.
Therefore, data analysis plays a crucial role in transforming this information into a more accurate and relevant format, thereby making researchers’ jobs easier.
Descriptive statistics, inferential analysis, and quantitative analysis are only a few of the numerous techniques available to researchers through data analysis.
In conclusion data analysis provides researchers with superior data and enhanced methods for analyzing and studying this data.
How Do You Analyze Data?
Now that we’ve answered the questions “what is statistical analysis?” and “why is it important?” and covered the many types of statistical analysis techniques, it’s time to delve deeper into how to conduct your analysis by running through these 15 basic procedures.
Collaborate on your desires:
- Before you start reading your statistics or drilling down into any evaluation strategies, it’s important to sit down with all the key stakeholders in your organization, determine your top marketing campaign or strategic goals, and gain a fundamental understanding of the types of insights that will greatly benefit your development or provide you with the degree of imagination and foresight you need to transform your organization.
Establish your questions:
- After stating your primary objectives, you should recall which questions must be answered in order to accomplish your task. This is one of the most significant data analytics methods, as it will serve as the cornerstone for your success.
Data democratization:
- After giving your data analytics strategy some genuine direction and determining which questions must be answered to extract gold standard value from the available data for your employer, you should continue with data democratization.
- Data democratization is a method that aims to connect data from several repositories accurately and swiftly so that all employees have access to it at all times. You may extract information from text, photos, videos, numbers, and other formats. Then, conduct cross-database analysis to acquire more advanced insights to share interactively with the remainder of the organization.
- After identifying your most valuable statistical assets, you need to organize all of this information in a standard manner to start accumulating your insights. Therefore, DataPine provides a simple all-in-one data connections feature to join all of your internal and external data repositories and modify them at will. In addition, Datapine’s end-to-end response routinely refreshes your statistics, allowing you to focus on conducting the right analysis to grow your organization.
Clean your numbers:
- After harvesting so many reassessments, you may be left with a substantial number of records that are difficult to manage. At the same time, you may encounter incorrect data that could be misleading for your analysis. The smartest thing you can do to avoid dealing with this in the future is to clean up the statistics. This system is necessary before visualizing it since it ensures that the insights you get from it are true.
- There are numerous things you must search for when purifying your data. The most important one is to eliminate any duplicate observations, which often arise when using multiple internal and external reassessments of statistics. You can also add missing codes, restore empty fields, and eliminate poorly formed data.
- The use of textual content statistics is one more common method of purification. As stated previously, the majority of businesses today analyze consumer reviews, social media comments, questionnaires, and various other textual inputs. In order for algorithms to discover patterns, textual data must be reevaluated to eliminate incorrect characters and grammatical or spelling problems.
- The primary objective of data cleansing is to prevent you from drawing false conclusions that could affect your business in the long term. Through the use of smooth statistics, you’ll also help enterprise intelligence equipment better interact with your records and generate more studies for your employer.
Set your KPIs:
- Set a number of key overall performance indicators (KPIs) to assist you in tracking, measuring, and shaping your development in some key areas once you’ve reset your statistics, wiped clean your data, and installed simple queries that require your insights to solve.
- KPIs are essential to both qualitative and quantitative research evaluation methodologies. This is one of the most important methods of statistical analysis that you should not miss.
Omit vain statistics:
- After justifying your data analysis tactics and techniques and describing your objective, you should locate the raw data you’ve gathered from all reassessments and use your KPIs as a guide to eliminate any records you feel are unnecessary.
- Trimming the informational fat is one of the most important analysis strategies, as it allows you to focus your analytical efforts and extract every last drop of value from the remaining ‘lean’ data.
Develop a road map for statistical control:
- Developing a data governance road map can help your data analysis methodologies and strategies succeed on a more sustainable basis, despite the fact that this step is optional at the moment (you will have gained a wealth of knowledge and developed a relatively sound strategy by now). These roadmaps, if developed effectively, are also designed to be modified and scaled over time.
- Investing sufficient effort in developing a roadmap to assist you store, manipulate, and manage your data internally can make your assessment strategies more fluid and functional – one of the most successful types of data analysis techniques available today.
Integrate generation:
- There are numerous techniques for analyzing data, but one of the most significant parts of analytic success in a business environment is integrating the correct decision support software and technology.
- Robust evaluation structures will now not only permit you to extract crucial statistics from your most valuable assets while running with dynamic KPIs to provide you with actionable insights; it will also provide the records in a digestible, visible, interactive layout from one central, live dashboard. A method for statistical analysis on which you can rely.
- By integrating the proper generation into your statistical technique, statistics evaluation, and core statistics analytics technique, you’ll keep your insights from fragmenting, saving you time and effort while allowing you to derive the maximum value from your enterprise’s most valuable insights.
- Examine our collection of dashboard examples for a look at the power of software for the purpose of analysis and to enhance your methods for analyzing data.
Conclusion:
Data analysis involves examining, modifying, modeling, and converting data in accordance with the requirements of the research topic. The conclusion is the ultimate conclusion formed from the data analysis, literature review, and observations.