
- What is Lean?| Everything You Need to Know
- What is SAP Workflow? : A Complete Guide
- Difference between Tableau and Power BI | Benefits and Special Features
- Data Warehouse in Tableau | Everything You Need to Know
- What is Tableau Server?| Everything You Need to Know | A Definitive Guide
- What is Dax in Power BI? | A Comprehensive Guide
- Upgrade in Tableau Desktop and Web Authoring | A Complete Guide with Best Practices
- What is SAP HANA | SAP HANA Database Connection | All you need to know [ OverView ]
- SAP BPC – What is Business Planning and Consolidation? : All you need to know [ OverView ]
- Root Cause Analysis: Definition, Examples & Methods | All you need to know [ OverView ]
- Seven Basic Quality Improvement Ishikawa Tools | Important asset to control quality in your project [OverView]
- What is Power BI | Its Use Cases and Applications | All you need to know [ OverView ]
- How and why to measure and analyze employee productivity | Everything You Need to Know
- Top 10 Employee Retention Strategies | Everything You Need to Know
- What are LookML Projects and the Developer Mode | How to Create LookML Projects?
- What are Slowly Changing Dimension | SCD Types and Implementations | Step-By-Step Process
- What is Pareto Chart and How to Create Pareto Chart | A Complete Guide For Beginners
- What does an Agile Business Analyst do | Required Skills, Roles and Responsibilities [ Job & Future ]
- What is Lean Management? | Role and Concepts of Lean Management | Expert’s Top Picks
- A Definitive Guide of Working Capital Management with Best Practices & REAL-TIME Examples
- Business Analytics with Excel Fundamentals | A Complete Guide For Beginners
- Business Analyst : Job Description | All you need to know [ Job & Future ]
- How to create a Splunk Dashboard | A Complete Guide For Beginners [ OverView ]
- What is Splunk Logging ? | The Ultimate Guide with Expert’s Top Picks
- Alteryx vs Tableau | Know Their Differences and Which Should You Learn?
- What is Predictive Analytics? : Step-By-Step Process with REAL-TIME Examples
- An Overview of SAS Stored Processes | The Ultimate Guide with Expert’s Top Picks
- How to Create Conditional Formatting in Cognos Report Studio | A Complete Guide
- Difference between OLTP vs OLAP | Know Their Differences and Which Should You Learn?
- ECBA vs CCBA vs CBAP | A Complete Guide For Beginners | Know Their Differences and Which Should You Learn?
- Import Custom Geocode Data in Tableau | Everything You Need to Know [ OverView ]
- Data Warehouse Tools : Features , Concepts and Architecture
- PGDM vs MBA | Know Their Differences and Which Should You Learn?
- Most Popular Data Visualization Tools | A Complete Beginners Guide | REAL-TIME Examples
- Tableau vs Looker : Comparision and Differences | Which Should You Learn?
- Benefits of Employee Satisfaction for the Organization [ Explained ]
- DAX In Power BI – Learn Power BI DAX Basics [ For Freshers and Experience ]
- Power Bi vs Tableau : Comparision and Differences | Which Should You Learn?
- What is Alteryx Tools | Alteryx ETL Tools | Comprehensive Guide
- What is Tableau Prep? : Comprehensive Guide | Free Guide Tutorial & REAL-TIME Examples
- What are Business Intelligence Tools ? : All you need to know [ OverView ]
- Tableau Aggregate Functions | A Complete Guide with REAL-TIME Examples
- Intervalmatch Function in Qlikview | Everything You Need to Know [ OverView ]
- QlikView Circular Reference | Free Guide Tutorial & REAL-TIME Examples
- Data Blending in Tableau | A Complete Guide with Best Practices | Free Guide Tutorial [ OverView ]
- Splunk vs ELK | Differences and Which Should You Learn? [ OverView ]
- QlikSense vs QlikView | Differences and What to learn and Why?
- What Is Measurement System Analysis | Required Skills | Everything You Need to Know
- Splunk Timechart | Free Guide Tutorial & REAL-TIME Examples
- What Is Image Processing ? A Complete Guide with Best Practices
- What is a Business Analysis ? A Complete Guide with Best Practices
- Top Business Analytics Tools | Comprehensive Guide
- Business Analyst Career Path [ Job & Future ]
- Time Series Analysis Tactics | A Complete Guide with Best Practices
- What is Splunk ? Free Guide Tutorial & REAL-TIME Examples
- Which Certification is Right for You: Six Sigma or Lean Six Sigma?
- SAS Vs R
- Top Technology Trends for 2020
- Data Analyst vs. Data Scientist
- What are the Essential Skills That You Need to Master in Data Analyst?
- What is Six Sigma?
- Common Cause Variation Vs Special Cause Variation
- Reasons to Get a Six Sigma Certification
- What Is Strategic Enterprise Management and its Components?
- What Are The Benefits Measurement Constrained Optimization Methods?
- What Is the Benefit of Modern Data Warehousing?
- What Is Corporate Social Responsibility (CSR)?
- What Is The Purpose and Importance Of Financial Analysis?
- What is Insights-as-a-Service (IaaS)?
- Business Analytics With R Programming Languages
- Where Are The 8 Hidden Wastes?
- What Are Market Structures?
- What is Cost of Quality (COQ)?
- What is Build Verification Testing?
- Quality Improvement in Six Sigma
- What is Process Capability Analysis?
- How To Measure The Effectiveness Of Corporate Training
- SAP Financials And SAP Accounting Modules
- Tips to Learn Tableau
- Why Should I Become a CBAP?
- History And Evolution of Six Sigma
- How to use Control Chart Constants?
- Data Analytics Course For Beginners
- How to Build a Successful Data Analyst Career?
- Data Analytics Vs Business Analytics
- What is SAP Certification?
- Books To Read For a Six Sigma Certification
- Six Sigma Green Belt Salary
- What is the ASAP Methodology?
- Complete list of SAP modules

Data Analytics Course For Beginners
Last updated on 01st Oct 2020, Artciles, Blog, Business Analytics
Data Science and Data Analytics are two most trending terminologies of today’s time. Presently, data is more than oil to the industries. Data is collected into raw form and processed according to the requirement of a company and then this data is utilized for the decision making purpose. This process helps the businesses to grow & expand their operations in the market. But, the main question arises – What is the process called? Data Analytics is the answer here. And, Data Analyst and Data Scientist are the ones who perform this process.
What is Data Analytics?
Data or information is in raw format. The increase in size of the data has lead to a rise in need for carrying out inspection, data cleaning, transformation as well as data modeling to gain insights from the data in order to derive conclusions for better decision making process. This process is known as data analysis.
Data Mining is a popular type of data analysis technique to carry out data modeling as well as knowledge discovery that is geared towards predictive purposes. Business Intelligence operations provide various data analysis capabilities that rely on data aggregation as well as focus on the domain expertise of businesses. In Statistical applications, business analytics can be divided into Exploratory Data Analysis (EDA) and Confirmatory Data Analysis (CDA).
Subscribe For Free Demo
Error: Contact form not found.
EDA focuses on discovering new features in the data and CDA focuses on confirming or falsifying existing hypotheses. Predictive Analytics does forecasting or classification by focusing on statistical or structural models while in text analytics, statistical, linguistic and structural techniques are applied to extract and classify information from textual sources, a species of unstructured data. All these are varieties of data analysis.
The revolutionising data wave has brought improvements to the overall functionalities in many different ways. There are various emerging requirements for applying advanced analytical techniques to the Big Data spectrum. Now experts can make more accurate and profitable decisions.
In the next section of the Data Analytics tutorial, we are going to see the difference between Data Analysis and Data Reporting.
Key Features
- 3 hours of online self-paced learning
- Lifetime access to self-paced learning
- Industry-recognized course completion certificate
- Real-world case studies and examples
Introduction to Data Analytics Course Curriculum
Eligibility
This Data Analytics for beginners course is ideal for anyone who wishes to learn the fundamentals of data analytics and pursue a career in this growing field. The course also caters to CxO-level and middle management professionals who want to improve their ability to derive business value and ROI from analytics.
Pre-requisites
This Introduction to Data Analytics for Beginners course has been designed for all levels, regardless of prior knowledge of analytics, statistics, or coding. Familiarity with mathematics is helpful for this course.
Data Analysis Process
Now in the Data Analytics tutorial, we are going to see how data is analyzed step by step.
1. Business Understanding
Whenever any requirement occurs, firstly we need to determine the business objective, assess the situation, determine data mining goals and then produce the project plan as per the requirement. Business objectives are defined in this phase.
2. Data Exploration
For the further process, we need to gather initial data, describe and explore data and lastly verify data quality to ensure it contains the data we require. Data collected from the various sources is described in terms of its application and the need for the project in this phase. This is also known as data exploration. This is necessary to verify the quality of data collected.
3. Data Preparation
From the data collected in the last step, we need to select data as per the need, clean it, construct it to get useful information and then integrate it all. Finally, we need to format the data to get the appropriate data. Data is selected, cleaned, and integrated into the format finalized for the analysis in this phase.
4. Data Modeling
After gathering the data, we perform data modeling on it. For this, we need to select a modeling technique, generate test design, build a model and assess the model built. The data model is build to analyze relationships between various selected objects in the data. Test cases are built for assessing the model and model is tested and implemented on the data in this phase.
5. Data Evaluation
Here, we evaluate the results from the last step, review the scope of error, and determine the next steps to perform. We evaluate the results of the test cases and review the scope of errors in this phase.
6. Deployment
We need to plan the deployment, monitoring and maintenance and produce a final report and review the project. In this phase, we deploy the results of the analysis. This is also known as reviewing the project.
The complete process is known as the business analytics process.
Skills required to become a Data Analyst
Data Analytics Tutorial is incomplete without knowing the necessary skills required for the job of a data analyst. In today’s world, there is an increasing demand for analytical professionals.
All the data collected and the models created are of no use if the organization lacks skilled data analysts. A data analyst requires both skills and knowledge for getting good data analytics jobs.
To be a successful analyst, a professional requires expertise on the various data analytical tools like R & SAS. He should be able to use these business analytics tools properly and gather the required details. He should also be able to take decisions which are both statistically significant and important to the business.
Technical & Business Skills for Data Analytics
In this part of the data analytics tutorial, we will discuss the required technical and business skills.
Technical skills for data analytics:
- Packages and Statistical methods
- BI Platform and Data Warehousing
- Base design of data
- Data Visualization and munging
- Reporting methods
- Knowledge of Hadoop and MapReduce
- Data Mining
Business Skills Data analytics:
- Effective communication skills
- Creative thinking
- Industry knowledge
- Analytic problem solving
What Does a Data Analyst Do?

Whether you’re a candidate looking to work as an analyst or a growing company looking to make use of big data, this is probably a question you have. With so many Data Analyst job descriptions out there and everybody wanting to get a handle on their big data analytics, it can be hard to settle on what exactly a Data Analyst does all day.
The picture above gives you a good start. It can be helpful to think of a Data Analyst as the person who helps business users answer business questions by developing charts like the one in the picture above.
A Data Analyst’s work will, first of all, vary both according to the type of department they work in, such as Sales or Finance, and the types of projects they are asked to work on. Generally, a Data Analyst’s job is to retrieve and collect data, organize it. They then use it to find correlations and patterns that produce meaningful conclusions relevant to the business. They essentially sift through business numbers and data and report what “stories” this information is hiding.

Best On-Demand Data Analytics Course from Real-Time Experts
Weekday / Weekend BatchesSee Batch DetailsData Analyst responsibilities include processing, cleaning and assembling data in databases according to business user (i.e. CFO or Sales Manager) requirements. They often work with Business Analysts (in this case, a separate and different role) who procure the information they need to help the business make decisions from the Data Analysts. To this effect, Data Analysts spend a lot of time developing systems for collecting the data and compiling data into reports.
Core Data Analyst Skills
Data analytics bachelor degree programs have exploded to try and meet the forecast demand for Data Analysts. MBA programs, sports management, finance and accounting degree programs are starting to incorporate data analytics into their curriculum, too. Data Analyst certification programs from companies such as Cloudera and Dell EMC are now available.
So, then what are the core skills that anyone graduating with a related degree must have?
Data Analysts must, of course, have analytical skills and be good with numbers, math and be comfortable with statistics. Analysts must also have a command of common data analysis tools and be able to build queries using them. SQL and Excel are the main tools that all Data Analysts need to master.
Because their primary responsibility is to create and present accurate informative reports, Data Analysts should be able to use visualization tools such as SAS, Cognos, Tableau and Python and R visualization libraries.
In addition, Data Analysts should typically have command of at least one programming language among R, SAS an Python (QuantHub allows employers to test for all three of these). The programing language of choice for Data Analysts had historically been SAS and R. However, a 2019 survey by analytics recruiters Burtchworks found that Python had finally edged out SAS and R as the preferred language of Data Analysts.

The figure to the right shows the results of the survey over the past few years.
Lastly, on the soft skill side Data Analysts must have a collaborative nature and have great communication skills.
No Consensus on Skills Required
Despite these core skills, a 2019 study by the Initiative for Analytics and Data Science Standards showed that employers vary significantly in terms of the skills they “think” Data Analysts should have and the skills that so-called Data Analysts describe on their resumes. The first figure below shows the skills that Data Analysts put on their LinkedIn profiles in 2019. Many are the same ones we described as core skills.
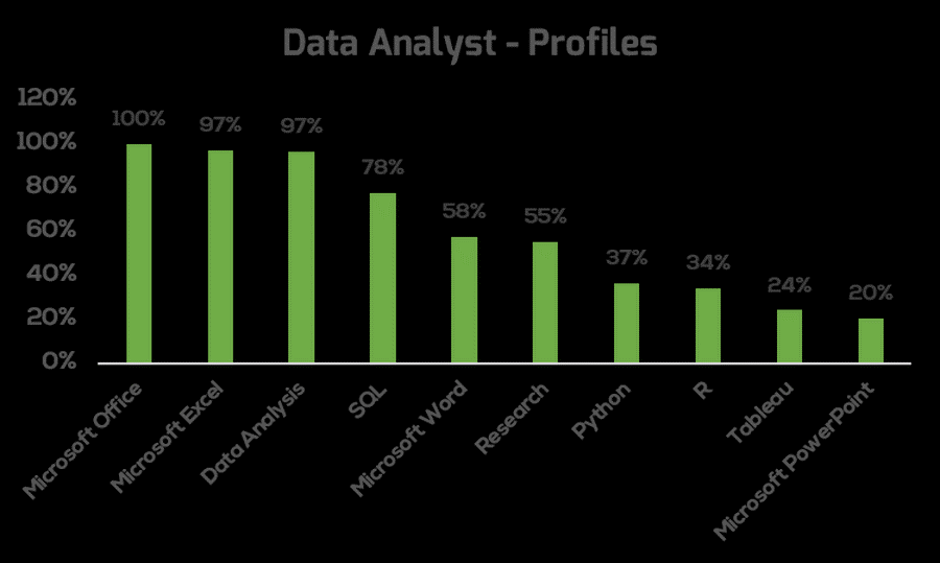
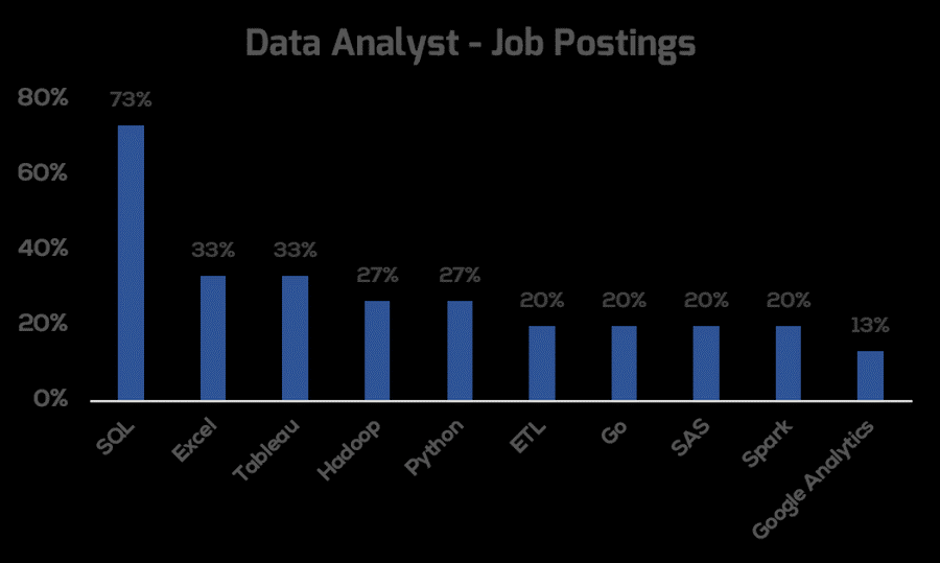
However, the figure below shows the skills that employers list as being required for Data Analysts as posted on LinkedIn. Many Data Analysts still consider Excel and Powerpoint – old school tools – to be relevant. However, employers are asking for modern tools such as Spark and Go. Employers are also looking for familiarity with Hadoop and ETL data management tools which are not to be found in the top 10 listed skills on Data Analyst resumes. Surprisingly “data analysis” is a top skill listed on candidate profiles, but isn’t listed as a “skill” on job descriptions.
This disconnect in terms of what Data Analysts should know and do will make it harder for employers to ramp up their Data Analyst roles.
Data Analyst Job Descriptions – Examples
Employers are not entirely to blame for this disconnect. The fact is that any particular Data Analyst role is unique for many reasons. It’s thus difficult to ascertain exactly what skills and knowledge are needed to get the job done. To give you an idea of the wide and varied nature of the Data Analyst role, here’s a few types of Data Analyst job descriptions.
Operations Analyst – Operations Analysts focus on the internal processes of a business such as reporting systems or manufacturing and distribution. With the advent of IoT in manufacturing, these roles are multiplying, as are specialized degree programs in Operations analytics. This role can be found in just about any size and type of company. It’s no wonder this role is forecast by the US Labor Bureau to grow by 26% from 2018-2028.
Customer Data Analyst – Another highly sought after employee is one that can take customer data and helps to transform it into a business advantage by providing ideas for operational efficiencies or revenue growth. That is what a Customer Data Analyst does. This role largely supports sales and marketing.
Sports Data Analyst – One of the most popular and growing data analyst job markets is in the area of sports data analysis. Data analytics is changing the face of industries such as Major League Baseball, the National Basketball League and Major League Soccer. Data affects every area of athletics from athlete and team performance to marketing to sports medicine. As with operations analytics, sports analytics is a growing undergraduate degree program.
Healthcare Data Analyst – Another industry that has exploded with data analytics jobs is healthcare. Following the digitalization of patient records across the country and the globe, healthcare organizations and related industries such as health insurance and pharmaceuticals are scrambling to make sense of all this patient and medical data. Healthcare analytics is now a commonly offered degree program on campuses across the US.
It’s clear that the database technologies and platforms that a healthcare company and a sports data company use will vary, as will the types of analyses and information reporting that is required on a day to day basis. The moral of the story is the same as for Data Scientists – be flexible and hire for a portfolio of data analytics skills rather than try to find a unicorn that can do it all.
How Automation Impacts Data Analyst Demand?
In 2020 and beyond, new types of tools and technologies will continuously alter the nature of requisite Data Analyst skills. Companies are increasingly automating their data analytics platforms.
Despite this automation, rather than decreasing the skills required of Data Analysts, automation will likely increase the volume of data analytics possible and the accessibility of data analytics as a function. With more businesses able to automate their data processing and analytics-related tasks going forward, we’ll see an increase in the demand for humans who can understand, manipulate, apply and communicate data analytics.
Automation will also reduce the need for Data Analysts to spend time cleaning and collecting data. They’ll have more time to spend finding patterns and interpreting it for value-added use – and that will only increase the value of this role over time.