
- What is Lean?| Everything You Need to Know
- What is SAP Workflow? : A Complete Guide
- Difference between Tableau and Power BI | Benefits and Special Features
- Data Warehouse in Tableau | Everything You Need to Know
- What is Tableau Server?| Everything You Need to Know | A Definitive Guide
- What is Dax in Power BI? | A Comprehensive Guide
- Upgrade in Tableau Desktop and Web Authoring | A Complete Guide with Best Practices
- What is SAP HANA | SAP HANA Database Connection | All you need to know [ OverView ]
- SAP BPC – What is Business Planning and Consolidation? : All you need to know [ OverView ]
- Root Cause Analysis: Definition, Examples & Methods | All you need to know [ OverView ]
- Seven Basic Quality Improvement Ishikawa Tools | Important asset to control quality in your project [OverView]
- What is Power BI | Its Use Cases and Applications | All you need to know [ OverView ]
- How and why to measure and analyze employee productivity | Everything You Need to Know
- Top 10 Employee Retention Strategies | Everything You Need to Know
- What are LookML Projects and the Developer Mode | How to Create LookML Projects?
- What are Slowly Changing Dimension | SCD Types and Implementations | Step-By-Step Process
- What is Pareto Chart and How to Create Pareto Chart | A Complete Guide For Beginners
- What does an Agile Business Analyst do | Required Skills, Roles and Responsibilities [ Job & Future ]
- What is Lean Management? | Role and Concepts of Lean Management | Expert’s Top Picks
- A Definitive Guide of Working Capital Management with Best Practices & REAL-TIME Examples
- Business Analytics with Excel Fundamentals | A Complete Guide For Beginners
- Business Analyst : Job Description | All you need to know [ Job & Future ]
- How to create a Splunk Dashboard | A Complete Guide For Beginners [ OverView ]
- What is Splunk Logging ? | The Ultimate Guide with Expert’s Top Picks
- Alteryx vs Tableau | Know Their Differences and Which Should You Learn?
- What is Predictive Analytics? : Step-By-Step Process with REAL-TIME Examples
- An Overview of SAS Stored Processes | The Ultimate Guide with Expert’s Top Picks
- How to Create Conditional Formatting in Cognos Report Studio | A Complete Guide
- Difference between OLTP vs OLAP | Know Their Differences and Which Should You Learn?
- ECBA vs CCBA vs CBAP | A Complete Guide For Beginners | Know Their Differences and Which Should You Learn?
- Import Custom Geocode Data in Tableau | Everything You Need to Know [ OverView ]
- Data Warehouse Tools : Features , Concepts and Architecture
- PGDM vs MBA | Know Their Differences and Which Should You Learn?
- Most Popular Data Visualization Tools | A Complete Beginners Guide | REAL-TIME Examples
- Tableau vs Looker : Comparision and Differences | Which Should You Learn?
- Benefits of Employee Satisfaction for the Organization [ Explained ]
- DAX In Power BI – Learn Power BI DAX Basics [ For Freshers and Experience ]
- Power Bi vs Tableau : Comparision and Differences | Which Should You Learn?
- What is Alteryx Tools | Alteryx ETL Tools | Comprehensive Guide
- What is Tableau Prep? : Comprehensive Guide | Free Guide Tutorial & REAL-TIME Examples
- What are Business Intelligence Tools ? : All you need to know [ OverView ]
- Tableau Aggregate Functions | A Complete Guide with REAL-TIME Examples
- Intervalmatch Function in Qlikview | Everything You Need to Know [ OverView ]
- QlikView Circular Reference | Free Guide Tutorial & REAL-TIME Examples
- Data Blending in Tableau | A Complete Guide with Best Practices | Free Guide Tutorial [ OverView ]
- Splunk vs ELK | Differences and Which Should You Learn? [ OverView ]
- QlikSense vs QlikView | Differences and What to learn and Why?
- What Is Measurement System Analysis | Required Skills | Everything You Need to Know
- Splunk Timechart | Free Guide Tutorial & REAL-TIME Examples
- What Is Image Processing ? A Complete Guide with Best Practices
- What is a Business Analysis ? A Complete Guide with Best Practices
- Top Business Analytics Tools | Comprehensive Guide
- Business Analyst Career Path [ Job & Future ]
- Time Series Analysis Tactics | A Complete Guide with Best Practices
- What is Splunk ? Free Guide Tutorial & REAL-TIME Examples
- Which Certification is Right for You: Six Sigma or Lean Six Sigma?
- SAS Vs R
- Top Technology Trends for 2020
- Data Analyst vs. Data Scientist
- What are the Essential Skills That You Need to Master in Data Analyst?
- What is Six Sigma?
- Common Cause Variation Vs Special Cause Variation
- Reasons to Get a Six Sigma Certification
- What Is Strategic Enterprise Management and its Components?
- What Are The Benefits Measurement Constrained Optimization Methods?
- What Is the Benefit of Modern Data Warehousing?
- What Is Corporate Social Responsibility (CSR)?
- What Is The Purpose and Importance Of Financial Analysis?
- What is Insights-as-a-Service (IaaS)?
- Business Analytics With R Programming Languages
- Where Are The 8 Hidden Wastes?
- What Are Market Structures?
- What is Cost of Quality (COQ)?
- What is Build Verification Testing?
- Quality Improvement in Six Sigma
- What is Process Capability Analysis?
- How To Measure The Effectiveness Of Corporate Training
- SAP Financials And SAP Accounting Modules
- Tips to Learn Tableau
- Why Should I Become a CBAP?
- History And Evolution of Six Sigma
- How to use Control Chart Constants?
- Data Analytics Course For Beginners
- How to Build a Successful Data Analyst Career?
- Data Analytics Vs Business Analytics
- What is SAP Certification?
- Books To Read For a Six Sigma Certification
- Six Sigma Green Belt Salary
- What is the ASAP Methodology?
- Complete list of SAP modules

Data Analytics Vs Business Analytics
Last updated on 30th Sep 2020, Artciles, Blog, Business Analytics
Big data is transforming and powering decision-making everywhere. From large enterprises to higher education and government agencies, data from a plethora of sources is helping organizations expand their reach, boost sales, operate more efficiently, and launch new products or services.
In order to make sense of all this data and use it to be more competitive, companies must apply both business analytics and data analytics. There’s often confusion about these two areas, which can seem interchangeable. In this article, we’ll examine the goals of each function and compare roles and responsibilities to help you decide which path is right for you.
Subscribe For Free Demo
Error: Contact form not found.
Business analytics vs. data analytics: An overview
Both business analytics and data analytics involve working with and manipulating data, extracting insights from data, and using that information to enhance business performance. So, what are the fundamental differences between these two functions?
Business analytics focuses on the larger business implications of data and the actions that should result from them, such as whether a company should develop a new product line or prioritize one project over another. The term business analytics refers to a combination of skills, tools, and applications that allows businesses to measure and improve the effectiveness of core business functions such as marketing, customer service, sales, or IT.
Data analytics involves combing through massive datasets to reveal patterns and trends, draw conclusions about hypotheses, and support business decisions with data-based insights. Data analysis attempts to answer questions such as, “What is the influence of geography or seasonal factors on customer preferences?” or “What is the likelihood a customer will defect to a competitor?”. The practice of data analytics encompasses many diverse techniques and approaches and is also frequently referred to as data science, data mining, data modeling, or big data analytics.
An intro to business analytics
Business analytics (BA) is the iterative exploration of an organization’s data, with a focus on applying statistical analysis techniques to reveal information that can help drive innovation and financial performance. Analytics-driven organizations treat big data as a valuable corporate asset that fuels business planning and supports future strategies, and business analytics helps them get maximum value from this goldmine of insights.
There are three main kinds of business analytics — descriptive, predictive and prescriptive. These are usually implemented in stages and together can answer or solve just about any question or problem a company may have.
- Descriptive analytics answer the question, ‘What has happened?” This type of analytics evaluates historical data for insights on how to plan for the future. Thanks to the widespread availability of self-service data access and discovery tools and dashboards, executives and non-technical professionals can reap the benefit of insights generated by big data to improve business performance.
- Predictive analytics is the next step on the path to insight. It uses machine learning and statistical techniques to help businesses anticipate the likelihood of future events. However, because predictive analytics is probabilistic in nature, it cannot actually predict the future; it can only suggest the most likely outcome based on what has happened in the past.
- Prescriptive analytics explores possible actions to take based on the results of descriptive and predictive analysis. This type of analytics combines mathematical models, and business rules to optimize decision making by recommending multiple possible responses to different scenarios and tradeoffs.
Organizations may use any or all of these techniques, though not necessarily in this order. Business analytics can be implemented in any department, from sales to product development to customer service, thanks to readily available tools with intuitive interfaces and deep integration with many data sources. Many of these solutions offer users the ability to apply advanced analytic models without the help of a data scientist, creating new opportunities to find hidden insights in large datasets.
Business analytics requires adequate volumes of high-quality data, so organizations seeking accurate outcomes must integrate and reconcile data across different systems, then determine what subsets of data to make available to the business.

An intro to data analytics
Data analytics is the process of collecting and examining raw data in order to draw conclusions about it. Every business collects massive volumes of data, including sales figures, market research, logistics, or transactional data. The real value of data analysis lies in its ability to recognize patterns in a dataset that may indicate trends, risks, or opportunities. Data analytics allows businesses to modify their processes based on these learnings to make better decisions. This could mean figuring what new products to bring to market, developing strategies to retain valuable customers, or evaluating the effectiveness of new medical treatments.
Most commonly-used data analysis techniques have been automated to speed the analytical process. Thanks to the widespread availability of powerful analytics platforms, data analysts can sort through huge amounts of data in minutes or hours instead of days or weeks using:
- Data mining: Involves sorting through large data sets to identify trends, patterns, and relationships.
- Predictive analytics: Aggregates and analyzes historical data to help organizations respond appropriately to future outcomes like customer behavior and equipment failures.
- Machine learning: Uses statistical probabilities to teach computers to process data faster than conventional analytical modeling.
- Big data analytics: Applies data mining, predictive analytics, and machine learning tools to transform data into business intelligence.
- Text mining: Spots patterns and sentiments in documents, emails, and other text-based content.
As more organizations move their critical business applications to the cloud, they are gaining the ability to innovate faster with big data. Cloud technologies create a fast-moving, innovative environment where data analytics teams can store more data and access
Business analytics vs. data analytics: A comparison
Most people agree that business and data analytics share the same end goal of applying technology and data to improve business performance. In a data-driven world where the volume of information available to organizations continues to grow exponentially, the two functions can even work in tandem to maximize efficiency, reveal useful insights, and help businesses succeed.
This side-by-side comparison should help clear up some of the confusion between business and data analytics.

Learn Data Analytics Certification Training Course From Experienced Instructors
Weekday / Weekend BatchesSee Batch Details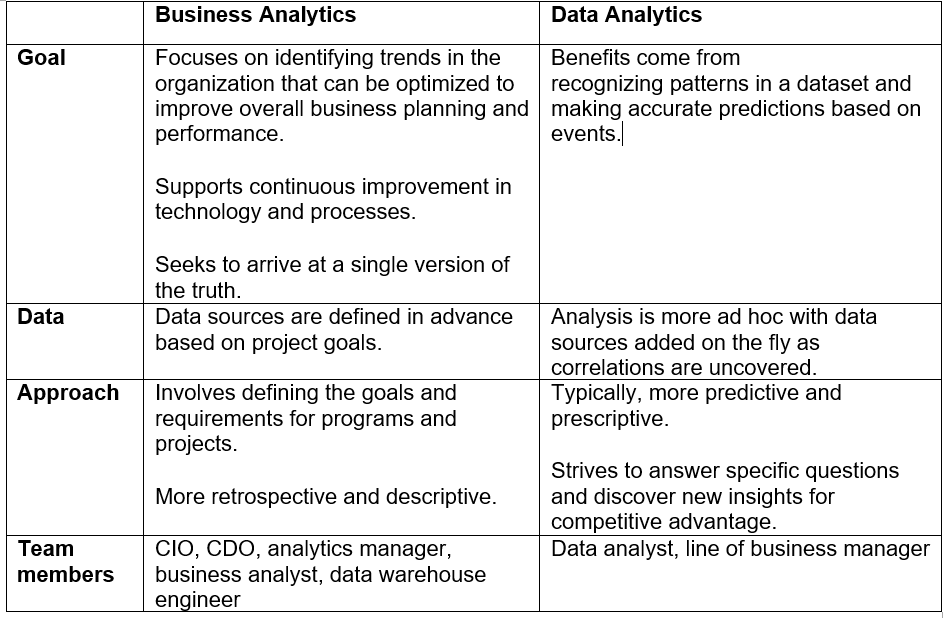
Business analyst vs. data analyst: A comparison of roles
Business analysts and data analysts both work with data. The difference is what they do with it. Business analysts use data to make strategic business decisions. Data analysts gather data, manipulate it, identify useful information from it, and transform their findings into digestible insights. Analyzing data is their end goal.
People in either role need to have a love of all things data, possess an analytical mind, have good problem-solving skills, and the ability to see and work towards the bigger picture. But if you’re trying to decide between these two career paths, it’s equally important to understand how they differ.
- Business analysts use data to identify problems and solutions, but do not perform a deep technical analysis of the data. They operate at a conceptual level, defining strategy and communicating with stakeholders, and are concerned with the business implications of data. Data analysts, on the other hand, spend the majority of their time gathering raw data from various sources, cleaning and transforming it, and applying a range of specialized techniques to extract useful information and develop conclusions.
- Business analysts typically have extensive domain or industry experience in areas such as e-commerce, manufacturing, or healthcare. People in this role rely less on the technical aspects of analysis than data analysts, although they do need a working knowledge of statistical tools, common programming languages, networks, and databases.
- Business analysts must be proficient in modeling and requirements gathering, whereas data analysts need strong business intelligence and data mining skills, along with proficiency with in-demand technologies like machine learning and AI.
- For business analysts, a solid background in business administration is a real asset. Many business analysts come from backgrounds in management, business, IT, computer science, or related fields. On the other hand, a math or information technology background is desirable for data analysts, who require an understanding of complex statistics, algorithms, and databases.
Additional required abilities of each role
Aside from technical and role-specific skills, business and data analysts each need some additional abilities to be successful.
A business analyst needs to be able to:
- Take a holistic view of a business problem or challenge.
- Work with individuals across the organization to get the information necessary to drive change.
- Develop clear, understandable business and project plans, reports, and analyses.
- Engage and communicate with stakeholders at all levels of the organization.
- Present recommendations clearly and persuasively for a range of audiences.
A data analyst needs to be able to:
- Translate data into meaningful business insights.
- Work well independently.
- Identify relevant data sets and add them on the fly.
- Report results in a clear and meaningful way.
- Define new data collection and analysis processes as needed.
Getting started with business or data analytics
From the newest startups to established global enterprises, every organization needs to leverage data for innovation and business growth. The practices of data analytics and business analytics share a common goal of optimizing data to improve efficiency and solve problems, but with some fundamental differences.
Whichever path you choose, you’ll need to gather relevant, trusted data from many sources quickly, easily, and securely. Talend Data Fabric speeds the analytics process by providing a single suite of cloud-based self-service applications for data integration and integrity. Because when you’re confident in your data’s quality, your stakeholders will be confident they’re making the right business decisions every time. Try Talend Data Fabric today to begin making data-driven decisions