
- Agile Sprint Planning | Everything You Need to Know
- What is Project Management Process ? : A Complete Guide
- What is Lean Management? : A Complete Guide
- What is ITIL ? Know about the Framework
- What is Six Sigma?| Know the tools used
- What is Kanban Training?|Know more about it
- Project Management Tools and Techniques : A Complete Guide
- What is Project Management? Everything You need to Know | Salary for the role
- Srum Org Certification? All you need to know about it
- MS Project Certification | All you need to know
- What is Project Manager? Know about the salary
- Six Sigma Certification Cost | Know all details about it
- Difference Between PMO and Project Manager? | Expert’s Top Picks
- What are Project Management Tools | Its Techniques | Everything You Need to Know
- What is Agile |Its Methodology and Types | How to Implement [ OverView ]
- What is a Product Roadmap? | How to Create one | A Complete Guide with Best Practices
- Scrum vs Kanban | Agile at Scale | New Agile BenchMark
- How to Effectively Manage Stakeholders | A Complete Guide For Beginners with Experts Top Picks
- What is Scaled Agile Framework (SAFe) | The Leading Framework For Business Agility | Everything You Need to Know
- How to Become a Project Manager | A Definitive Guide with Best Practices
- Time Management Tools to Help You Succeed as a Professional | Expert’s Top Picks
- Top 10 Tips for Agile Sprint Planning To Implement Efficient Marketing | Step-By-Step Process with REAL-TIME Examples
- What is ICP-ACC (ICAgile Certified Agile Coaching)? | A Definitive Guide with Best Practices [ OverView ]
- How To Run An Effective Agile Retrospective-Agile management | Everything You Need to Know
- What Skills Does One Acquire After The PMP Certification?
- A Definitive Guide: Most Effective and Proven Time Management Techniques [ OverView ]
- What Gaps I Filled After CSM Certification For my Scrum Project? [ OverView ]
- How to Create A Plan And Manage Your Projects Better?: Step-By-Step Process [ OverView ]
- What is User Story Mapping? : A Complete Guide with Best Practices
- What is Design Thinking ? : Benefits and Special Features | A Definitive Guide with Best Practices
- What is the Capability Maturity Model (CMM) [ For Freshers and Experience ]
- What is Sprint Planning ? | A Definitive Guide | Step-By-Step Process with REAL-TIME Examples
- What is Total Productive Maintenance (TPM) and How Does It Help in Equipment Effectiveness [ OverView ]
- What are Agile Metrics ? : A Complete Guide For Beginners [ OverView ]
- What is Agile Marketing and Why Do You Need It | Step-By-Step Process with REAL-TIME Examples
- Why is Retrospection Needed? : A Complete Guide For Beginners [ OverView ]
- Developing Project Schedule : Role of Float, Leads, and Lags [ OverView ]
- Project Life Cycle vs Product Life Cycle | Know Their Differences and Which Should You Learn?
- Projects in Business Environments | A Complete Guide For Beginners [ OverView ]
- What is Business Agility ? and Why is it Important ? Expert’s Top Picks
- The Most Important Benefits of Blended Learning | A Complete Guide For Beginners
- Can Business Analyst be a Project Manager? : Expert’s Top Picks
- Why A PMO Is Second In Line To A Project Manager ? | Expert’s Top Picks
- Devops vs Waterfall | A Definitive Guide and Which Should You Learn?
- Jira vs Trello | Know Their Differences and Which Should You Learn?
- Key Values and Principles Behind the Agile Manifesto | A Definitive Guide
- What are Scrum Ceremonies : The Ultimate Guide with Expert’s Top Picks
- Business Analyst vs Financial Analyst | Know Their Differences and Which Role is Better ?
- Learn Burndown Charts With Jira : Comprehensive Guide [ For Freshers and Experience ]
- What Is Scrum XP? : Step-By-Step Process with REAL-TIME Examples
- Phases of Project Management | Step-By-Step Process | Expert’s Top Picks
- Project Manager Salary in India – How much does a PM earn? [ Job & Future ]
- Why Do Scrum Masters Get Paid so Much? [For Freshers and Experience]
- What Best Describes a Scrum Team? All you need to know [ OverView ]
- JIRA vs TFS | Differences and Which Should You Learn?
- Anti-patterns of a Scrum Master : Step-By-Step Process
- SCM Tools and Frameworks | A Complete Guide with Best Practices
- Stages of Team Development | Everything You Need to Know
- Project Management Consultant : Job Description, Skills Required | Everything You Need to Know
- CSM vs PSM : Difference You Should Know
- Top Characteristics of a Project Manager : Expert’s Top Picks
- Roles And Responsibilities Of A Product Owner : Everything You Need to Know
- Common Project Risks and How to Tackle Them | Expert’s Top Picks
- Benefits of Having Shorter Sprints in Agile – Everything You Need to Know
- Group Discussion Tips | A Complete Guide with Best Practices
- PMP Certification Cost : All you need to know
- DMAIC Process and Methods | All you need to know [ OverView ]
- Agile Scrum Vs Kanban | Know the difference
- Deming vs Juran vs Crosby
- What is Project Scope Management and Why It’s Important?
- The Basic Principles of Project Management
- Top PMP Exam Questions and Answers for 2020
- Risk Management Strategies
- Roles and Responsibilities of A Scrum Master
- ROM Estimate Vs Definitive Estimate
- Guidelines for Creating and Maintaining a WBS Dictionary
- How to Become a Certified ScrumMaster?
- Top Professional Skills for 2020
- Fast Tracking Vs Crashing
- PMP Vs PRINCE2 Vs CAPM
- PMP Earned Value Management (EVM) And Formulas
- What is Certified Scrum Professional (CSM)?
- Top Leadership Theories Every Manager Should Know
- What is Deliverables in Project Management?
- How To Prepare For TOEFL
- History and evolution of the PMP Certification
- What Is Float In Microsoft Project?
- Rules to set you up for success in project
- What is Scrum Project Management?
- What Is Estimating Activity Duration in Project Management?
- What Are The PMP Terminologies Relating To Cost Knowledge Area?
- What is Project Scope Management processes?
- What Are The Types of Organization In PMP?
- Books to Beat the Scrum Master Certification
- Agile Coach Vs Agile Consultant
- What is the cost of quality in project management?
- Signs Your Career May Be Stagnation and Tips to Overcome Downturn
- Certified ScrumMaster (CSM) Certification
- Lean Six Sigma Black Belt Certification
- What is schedule Activity in project management?
- Why Do We Need a Project Charter?
- PMP Certification Exam Preparation Mind Map
- Why Quality Professionals Should Use Infographics In Project Management?
- Role of Earned Value Technique in Project Management
- What is Project Quality Management?
- Tools and Techniques to Estimate Project Cost
- What is a Project Charter And Project Scope in Project Management?
- Why Should You Conduct Project Status Meetings with Your Team?
- The 7 R’s of Change Management
- What Are The Categories and sources of risk in your project?
- What Is a Network Diagram in Project Management?
- What are The Types of Contracts In PMP?
- Residual Risk Vs Secondary Risk
- Impact of the stakeholders on the projects
- Effort Vs Duration Vs Elapsed Time
- Agile vs Scrum
- What Is Six Sigma Quality Assurance?
- How to Close a Project?
- What Qualifications Do You Need to be a Project Manager?
- Project Management Vs General Operations Management
- Enterprise Environmental Factors & Organizational Process Assets
- What is a project manager?
- Important Questions for PMP Certification Exam
- How is the PMP Exam changing, in 2015 & 2020?
- How To Renew Your PMP Certification?
- The Importance of Having Project Acceptance Criteria in Your Projects
- Tips for PMP Exam Preparation
- What is requirement traceability matrix RTM in Project Management?
- Poor Performance Appraisal? Here are the tips to turn any negative feedback into positive.
- How to build a successful Career in Agile and Scrum?
- Importance of Tuckman ladder model in HR management
- How To Apply For The PMP® Exam In Easy Steps
- How to Write a Six Sigma Problem Statement
- What is a lessons learned document in PMI?
- Perform Quality Assurance Vs Perform Quality Control
- How to Improve Quality Management Consistently?
- Interactive Vs Push Vs Pull Communication
- what is risk management?
- Key Appraisal Questions to Prepare For
- What are the MSP Certifications?
- What Is A Six Sigma Control Plan?
- How to Create a Project Plan in Excel?
- Agile Prioritization Techniques
- Tips to Help Millennials Climb the Corporate Ladder
- What is an Issue Log?
- Advantages of PMP over MBA
- Top Successful Project Estimation Techniques
- PMP Examination Preparation – ITTO’s
- Employee Training Rewards That Actually Improve Learning
- Lean principles
- What Does It Take to Become a Successful Agile Coach
- Projects VS Programs
- The Role of Six Sigma in Manufacturing
- The Top Formulas to Memorize Before Your PMP Exam
- Roadmap to CSM (Certified Scrum Master) Certification
- What are Some Qualities of a Good Manager and Good Leader?
- How to Handle Project Monitoring and Controlling Processes?
- Top Free Agile Tools For Any Project Manager
- Risk Assessment in Project Management
- The Concept of Zero Defects in Quality Management
- The Importance of Work Packages in Project Scope Management
- How to Get Project Management Experience for PMP Certification
- Different Ways to Calculate the Estimate at Completion (EAC)
- What Is a ScrumMaster?
- What is Risk Register?
- Agile Certifications
- Top-down Approach Vs Bottom-up Approach
- Leadership Vs Management
- What is Feasibility Study and Its Importance in Project Management?
- What Is a Project Management Plan?
- The Professional Advantages of the CAPM Certification
- PRINCE2 Vs PMP
- Rita Mulcahy’s PMP Prep and PMBOK® Guide
- What is Project Cycle Management?
- What is Project and Process Metrics?
- PMBOK® Sixth Edition is Here! What Project Managers Should Know?
- CAPM Certification
- Top Project Selection Methods for Project Managers
- Free Float Vs Total Float
- What is Critical Chain Project Management?
- How to Build a Career in Project Management?
- Scrum Master or Product Owner: What Suits You Better?
- Project Documentation and its Importance
- What is Performance Reporting in the Project Management?
- Top Highest Paying Tech Jobs in India

Free Float Vs Total Float
Last updated on 30th Sep 2020, Artciles, Blog, Project Management
Free Float Vs Total Float
Total floats and free floats have an important role in the development of a network diagram. A better understanding of these terms will help you draw a network diagram and analyze a critical path.
Total Float
Float is also known as total float.
Total float is how long an activity can be delayed, without delaying the project completion date. On a critical path, the total float is zero.
Total float is often known as the slack.
You can calculate the total float by subtracting the Early Start date of an activity from its Late Start date.
Total Float = Late Start date – Early Start date
Or
You can get it by subtracting the activity’s Early Finish date from its Late Finish date.
Total Float = Late Finish date – Early Finish date
Subscribe For Free Demo
Error: Contact form not found.
Free Float
Free float is how long an activity can be delayed, without delaying the Early Start of its successor activity.
You can calculate the free float by subtracting the Early Finish date of the activity from the Early Start date of the next.
Free Float = ES of next Activity – EF of current Activity
Please note that if two activities are converging into a single activity, only one of these two activities may have a free float.
Example: 1
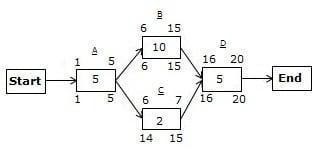
In the above network diagram, you can see two paths:
- 1. The first path is A->B->D with a 20-day duration.
- 2. The second path is A->C->D with a 12-day duration.
The path A->B->D is the critical path because it has the longest duration.
Calculating the Total Float
The path A->B->D is a critical path; therefore, it will not have a total float.
The path A->C->D is a non-critical path, so it can have a total float.
There are two methods to calculate the total float. In the first, you subtract the duration of the non-critical path from the critical path.
In the second method, you find the total float for any activity by subtracting the Early Start date from the Late Start date (LS – ES) or subtracting the Early Finish date from the Late Finish date (LF – EF) on any activity.
The first method of finding the total float
Total float = duration of the critical path – duration of the non-critical path
= (duration of the path A->B->D) – (duration of the path A->C->D)
= 20 – 12
= 8
Hence, the total float is eight days.
The second method of finding the total float
On the path A->C->D, Activity A and D lie on the critical path; therefore, they will not have a total float. Only Activity C can have a total float.
We can calculate the total float by using either the finish dates or start dates. I will show you both ways to find it.
First, we will go with the Late Finish and Early Finish dates:
Total float for Activity C = (LF of Activity C – EF of Activity C)
= 15 – 7
= 8
Now, the second formula:
Total float for Activity C = (LS of Activity C – ES of Activity C)
= 14 – 6
= 8
The durations are the same. This means that both formulas will give you the same result.
Calculating the Free Float
From the figure, you can see that only Activity C can have a free float because all other activities are on the critical path.
Let’s find it.
Free float of Activity C = ES of next activity – EF of Activity C – 1
= 16 – 7 – 1
= 8
Hence, the free float for Activity C is eight days.
Now we will discuss a more complex example.
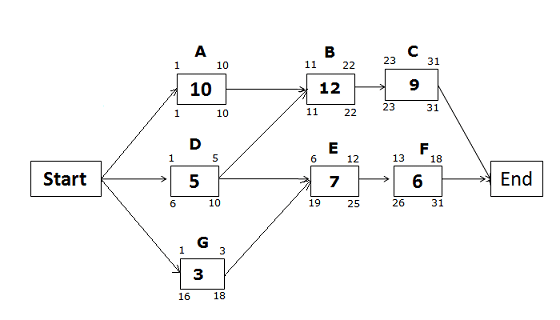
Example: 2
For the below-given network diagram, find which activities can have a free float and calculate the free and total float, considering the duration in days.

Enroll in PMP Training to Build Your Skills & Take Your Career to Next Level
- Instructor-led Sessions
- Real-life Case Studies
- Assignments
We know that:
Free float = ES of next activity – EF of current activity – 1
In the above diagram, Activity G can have the free float because Activity D and G converge on one common activity.
Activity D will not have a free float because its successor, Activity E, is starting the day after the completion of Activity D.
Free Float for Activity G
We know the formula for free float:
Free float of Activity G = Early Start of Activity E – Early Finish of Activity G – 1
= 6 – 3 – 1
= 2
Total Float for Activity G
Total float for Activity G = Late Finish of Activity G – Early Finish of Activity G
= 18 – 3
= 15
You can see here that the free float for Activity G is two days, and the total float is fifteen days. Both are different.
Critical Path Method Calculation Example
Let us understand the floats with the help of a small example. Refer to the following network diagram. It is solved using 1 method.
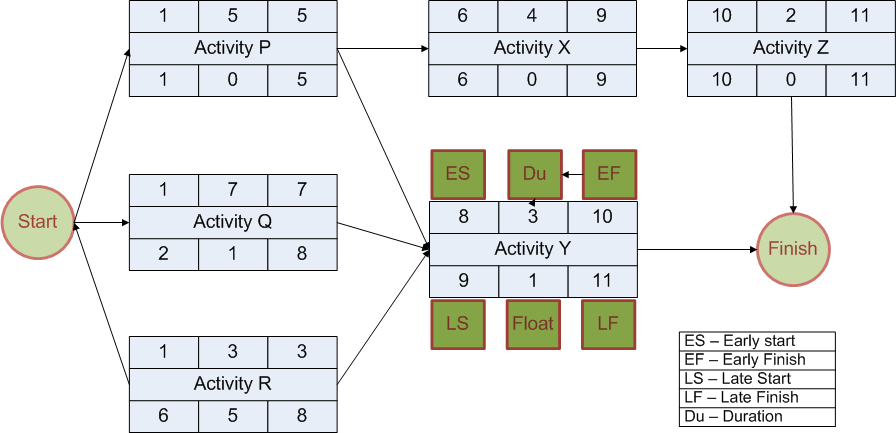
As per the above diagram:
- There are 6 activities viz. P, Q, R, X, Y, and Z.
- P, Q, and R start as soon as the project starts.
- X is the successor of P.
- Y is the successor of P, Q and R.
- Z is the successor of X.
Project Float is also referred to as Slack – some Project Management literature use the terms Total Slack and Free Slack. Some books just use ‘Float’ to refer to ‘Total Float’. In this article, I have used the Total Float (TF) and Free Float (FF).
Definition, Meaning And Formulae For Total Float
Total Float is the maximum amount of time an Activity can be delayed without delaying the Project.
e.g. if TF for an Activity Alpha is ‘n’ days, it means Activity Alpha can be delayed by ‘n’ days without impacting the Project Finish Date. Delaying Alpha may delay its successor but the finish date would remain the same.
You can refer to PMI’s Lexicon for a few other standard definitions.
The TF can be calculated by using either of the following formulas
TF = LF – EF
OR
TF = LS – ES
Both the formulas will produce the same result. e.g. In the above diagram TF for Activity P and Activity Q are 0 and 1 respectively.
Here are a few other pertinent points about TF:
- Buffer (Contingency Reserve) and TF are not the same. Buffer is purposefully introduced in an activity whereas TF is due to its placement in the Network Diagram.
- TF is calculated separately for each activity. TF is mentioned in the lower middle box of each activity in the above diagram.
- Some professionals feel that TF is a misnomer. It says ‘total’ but it is calculated for each activity and not for the entire path.
- TF is shared among the activities that are on the same path in a Network Diagram. If one activity uses TF, the TF of other activities will proportionately reduce. e.g. If Q uses 1 unit of TF on Path QY, then Y will have n0 TF.
- The activities on the Critical Path have the least amount of TF. Generally it is zero but it could be negative also. In the above diagram, PXZ is the Critical Path.
Definition, Meaning And Formulae For Free Float
Free Float is the amount of time an Activity can be delayed without impacting the Early Start date of any of its Immediate Successors.
You can refer to Max Wideman’s Glossary for a few other standard definitions.
e.g. Consider Activity Alpha & Activity Beta that have a Finish to Start relationship between them. Activity Beta is successor to Activity Alpha. If Activity Alpha has a FF of ‘n’ days, it means Activity Alpha can be delayed by ‘n’ days without impacting the Early Start of Activity Beta.
FF can be calculated by using one of the following formulas.
FF = min(ES of Successors) – (ES of Activity in Question) – (Duration of Activity in Question)
OR
FF = min(ES of Successors) – (EF of Activity in Question)
The first formula is a generic formula and will work for both o and 1 method in critical path analysis but the second one will work only if you have used 1 method.
Refer to the above network diagram again.
FF for Activity X is 0 as any delay in X will delay ES of Z.
FF Activity Q is 0 as any delay in Q will delay ES of Y. Notice that TF of Activity Q is 1.
FF Activity R is 4. The ES of Y will change only if R is delayed by more than 4 days. Notice that TF of Activity Q is 5.
Here are a few other pertinent points about FF:
- Lag and FF are not the same. Lag is purposefully introduced in an activity whereas FF is due to its placement in the Network Diagram.
- FF is calculated separately for each activity. FF is generally not mentioned in the Network Diagram.
- FF is useful when there is an imposed start date for a Successor activity.
- All the successor activities should be considered while calculating the FF.
- TF and FF of an Activity can be different.
- The above formula for FF is applicable for Finish to Start relationships only.