
- Financial Performance – A Complete Tutorial
- How Six Sigma Principles Can Progress Your Productivity – Tutorial
- Google Analytics Pro Tutorial | Fast Track your Career
- Activity-Based Costing Tutorial | Know about Definition, Process, & Example
- Create a workbook in Excel Tutorial | Learn in 1 Day
- Excel ROUNDUP Formula Tutorial | Learn with Functions & Examples
- Business Analytics with Excel Tutorial | Learn In 1 Day
- SAP Tutorial – Free Guide Tutorial & REAL-TIME Examples
- IBM SPSS Statistics Tutorial: Getting Started with SPSS
- SAP Security Tutorial | Basics & Definition for Beginners
- SAP Simple Finance Tutorial | Ultimate Guide to Learn [Updated]
- SAP FIORI Tutorial | Learn in 1 Day FREE
- Introduction to Business Analytics with R Tutorial | Ultimate Guide to Learn
- Tableau Desktop Tutorial | Step by Step resource guide to learn Tableau
- Implementing SAP BW on SAP HANA | A Complete Guide
- SAP HANA Administration | Free Guide Tutorial & REAL-TIME Examples
- Tableau API Tutorial | Get Started with Tools, REST Basics
- SAP FICO ( Financial Accounting and Controlling ) Tutorial | Complete Guide
- Alteryx Tutorial | Step by Step Guide for Beginners
- Getting started with Amazon Athena Tutorial – Serverless Interactive | The Ultimate Guide
- Introduction to Looker Tutorial – A Complete Guide for Beginners
- Sitecore Tutorials | For Beginners Learn in 1 Day FREE |Ultimate Guide to Learn [UPDATED]
- Adobe Analytics Tutorial – The Ultimate Student Guide
- Splunk For Beginners – Learn Everything About Splunk with Free Online Tutorial
- An Overview of SAP HANA Tutorial: Learn in 1 Day FREE
- Statistical Package for the Social Sciences – SPSS Tutorial: The Ultimate Guide
- Splunk For Beginners – Learn Everything About Splunk with Free Online Tutorial
- Pentaho Tutorial – Best Resources To Learn in 1 Day | CHECK OUT
- Statistical Package for the Social Sciences – SPSS Tutorial: The Ultimate Guide
- An Overview of SAP HANA Tutorial: Learn in 1 Day FREE
- Spotfire Tutorial for Beginners | Quickstart – MUST- READ
- JasperReports Tutorial: Ultimate Guide to Learn [BEST & NEW]
- Charts and Tables – Qlikview Tutorial – Complete Guide
- TIBCO Business Works | Tutorial for Beginners – Learn From Home
- Cognos TM1 Tutorial : Learn Cognos from Experts
- Kibana
- Power BI Desktop Tutorial
- Tableau Tutorial
- SSAS Tutorial
- Creating Tableau Dashboards
- MDX Tutorial
- Tableau Cheat Sheet
- Analytics Tutorial
- Lean Maturity Matrix Tutorial
- MS Excel Tutorial
- Business Analysis Certification Levels & Their Requirements Tutorial
- Solution Assessment and Validation Tutorial
- Lean Six Sigma Tutorial
- Enterprise Analysis Tutorial
- Create Charts and Objects in Excel 2013 Tutorial
- Msbi Tutorial
- MicroStrategy Tutorial
- Advanced SAS Tutorial
- OBIEE Tutorial
- Tableau Server Tutorial
- OBIA Tutorial
- Business Analyst Tutorial
- Cognos Tutorial
- Qlik Sense Tutorial
- SAP-Bussiness Objects Tutorial
- SAS Tutorial
- PowerApps Tutorial
Google Analytics Pro Tutorial | Fast Track your Career
Last updated on 24th Aug 2022, Blog, Business Analytics, Tutorials
Introduction:
Google Analytics is only a Google tool that will assist you in keeping tabs on your website, monitoring user activity, and providing you with all the important data required for the promotion of your website.You can track things like how many people visited your website, how long they spent there, and so on.The Google Analytics tool has been well-developed and may even reveal the duration of time required to load a page. In layman’s terms, Google Analytics is a programme that will get you accurate information about your website.You may use this information to boost traffic to your website even further. It can be used for both search engine optimization and BI purposes.
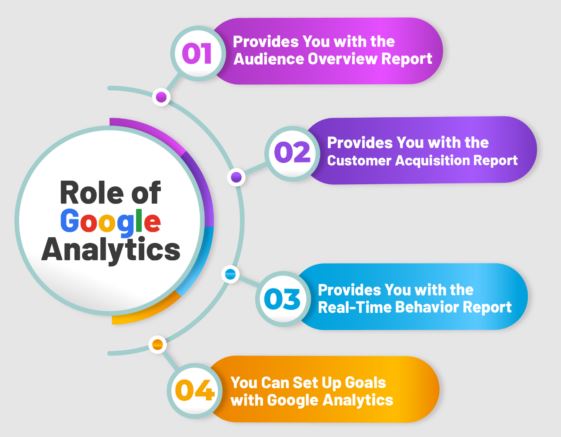
Why Do You Need Google Analytics?
- If you want to monitor how people use your website, Google Analytics is your best bet.
- Freely accessible via Google, this resource will help you learn more about your website’s visitors.
- You can get the most accurate picture of your website’s performance with the use of this application. Numerous questions critical to evaluating your site’s effectiveness have solutions you can access here.
- How Google Analytics Can Help SEO Analysis
- With Google Analytics, you may access a massive data set containing information on your site’s visitors and their actions.
- Insights into the demographics of your audience, the channels via which they arrive, and the behaviours they exhibit while on your site are all at your fingertips.
- Using this information, you may create more effective SEO strategies by identifying high-performing keywords, identifying areas of content that require improvement, and determining the most successful content and campaign types.
- Furthermore, this information will be accessible in real-time, allowing you to examine user behaviour and adapt your content accordingly.
Google Analytics Information and Metrics:
1. Visits: A user’s frequency of visits to your site is revealed here.
2. Unique Visitors: The number of distinct users that have visited your site over a given time period is exactly what this metric measures. In contrast to the overall number of visitors, this only includes the ones that were successful.All visits, not just new ones, will increase in Google Analytics if a visitor from a certain IP address returns to your site during that period.
3. Page Views: You can see how many pages a visitor has viewed during their session.4.
4.Pages/Visits: This metric represents the number of pages viewed relative to the total number of site visitors.
5. Average Visit Duration: What this informs you is how long, on average, a user spends exploring your site.
6. Bounce Rate: Google Analytics presents this as a vital piece of data. It gives you an idea of how many people visit your site but don’t return within a specified amount of time.Now, a user might bounce back for plenty of reasons and this time frame is still unknown. It could be anywhere from 5 minutes to 10 minutes.
7. Percentage of New Visits: This tells you how many people are seeing your site for the first time in that time period as a percentage of the total number of visitors.However, a Google Analytics tutorial can give you with additional, related knowledge, such as how to manipulate data and so on. With time, you will become fluent in these jargons and understand them like never before.Don’t put off installing Google Analytics any longer than necessary.
Let’s go a step further with this Google Analytics lesson and learn how to define objectives for use with Google Analytics.
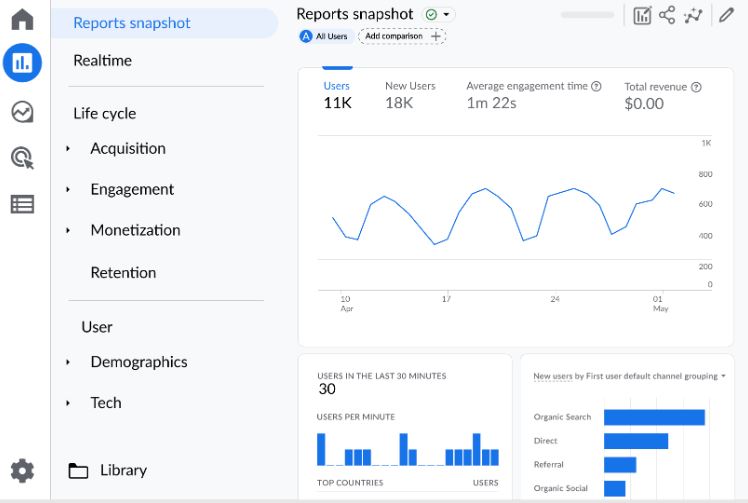
Google Analytics Infrastructure:
Google Analytics tracks information from websites and displays it in graphical formats like tables and charts.The above picture is the main page for Google Analytics. Let’s break down the webpage piece by piec:
Reports: Users can access a variety of reports in certain areas by clicking the ‘Reports’ button on the left side. There is data available on the following topics thanks to them.
Real-Time Reports: In real time, you can see information on visitors to your website, such as where they are and what they are looking at.
Audience: You can see how people interact with your content and what devices they use to visit your site, among other insights.
Acquisition: Here you may see detailed information on the origins of your visitors and how they found your site.
Behaviour: By examining metrics like bounce rate, page views, unique visitors, etc., you can get a sense of how people are navigating and interacting with your site.
Conversion: You can see how your site is assisting individuals in converting by using the conversion option.
Search: You can quickly locate the report you wish to examine or the relevant help files by using the search function.
Customize: Additionally, you can modify your Google Analytics dashboard to meet your needs and preferences.
Admin: You can access your Google Analytics account through this choice and make any necessary changes or modifications.You can find further reports by scrolling down the homepage.
Traffic Reports:
- You can use this information to tailor your advertising to the channels that have shown to yield the greatest results.
- Check out Acquisition -> Overview to see how successful your marketing campaigns are by seeing where your visitors are coming from.
- If, for instance, your site receives the bulk of its visitors from links to other sites, you can infer that your guest articles are doing their job.
Audience Reports:
- If you use these statistics to determine where your audience is located, you can tailor your data and content to meet their needs. It’s a great tool for figuring out what your readers want to see more of so you can create more of it.
- To see the channels from which users are coming to your site, navigate to Acquisition > All Traffic > Channels.
Behaviour Report:
- You can see exactly what’s working and what’s not with these reports.
- Behaviour > Site content > All Pages will show you detailed information on how each page performs. Using this information, you may write posts that will interest your readers.
Here are some things to consider when utilising Google Analytics.
Setting Up Your Google Analytics Dashboard:
The next step in this Google Analytics guide is to adjust your dashboard’s settings to match your website’s specific requirements.Check out this quick guide on how to personalise your Google Analytics dashboard before we get started with the procedures for customising your dashboard.
Property Settings:
You can see your audience, their interests, their locations, and more by turning on the special reports we’ve been talking about. To activate customised reports, pick Admin from the left menu, then click Property Settings. Here, you’ll want to make sure the following boxes are ticked:
1.Do you have the right URL?
2.Reports on Demographics and Interests
3. make use of Enhanced Link attribution
4.Make It Possible for Users’ Data to Be Used in Reporting
5.Is PPC data being populated, and is Google Ads connected?
6. Is there an effective connection to Google Search Console?
View Settings:
Verify the following tracking options, among others:
1.Commerce tracking
2.Site Search Tracking
3.URL Verification
4.Time and money zone verification
Select Admin, then click View Settings to activate these options.Most referral spam can be eliminated by using the Bot filtering option found toward the bottom of the page.You can even set a filter for your IP address in Google. To do so, follow the below steps:
1.Log in to Google Analytics.
2.Go to Admin -> View Setting -> Filters -> Add Filter
3.Then, name your filter.
4.Then choose to exclude.
5.Now, select choose traffic from the IP address and add your IP address.
6.Lastly, select the equal to option.
Alerts:
- The next step is to establish notifications for when the predetermined conditions are met. For individuals who rely on Google Analytics on a regular basis, this is crucial information.
- Create a new alert by selecting Admin > Custom Alert > New Alert from the menu.
- You can, for instance, be notified whenever there is a 25% daily drop or rise in your organic traffic.
Dashboard:
- In order to get the most of Google Analytics, setting up a dashboard is just as crucial as setting up alerts. The dashboard can be tailored to provide an overview of data and can be sorted according to the metrics you find most important. The information in a dashboard might be as simple as a summary or as complex as an in-depth analysis of your reports’ data.
- You can learn more about your site’s users and what they’re looking for by activating this feature.
- Before we wrap up our Google Analytics guide, let’s go over some best practises for making the most of the tool
Track visitor activities:
- To improve your site, you must first analyse user behaviour. Counting visits and pageviews won’t tell you much about how well received your material is among your target demographic.
- It’s important to track how often and for how long visitors return to a specific page. Having material that directly addresses a user’s pain point can be extremely effective in attracting that user to your site.
- You’ll find this information in the same spreadsheet as your other data. Please take the time to analyse these figures thoroughly so that you can draw meaningful conclusions.
Know your audience’s location:
- Since Google provides services in a variety of nations, including those with their own regional languages, your website may show up in search rankings in those countries as well. You should pay more attention to publishing the kind of information that interests readers around the world.
- In the “Demographics” section, you can learn where exactly your target audience lives. A greater number of vantage points are indicated by darker green.
Keep an eye out for popular keywords:
- The first step in any search engine optimization approach is to conduct a keyword search; Google Analytics then allows you to see which of those phrases led to site visitors. In this way, you’ll be able to monitor whatever that your users do. In the Traffic Sources section, you can see the most frequently used search terms that led people to your website.
- Your next inquiry after analysing the visitor data should be, “What can we do about it?” Using laser-targeted keywords can be difficult, but delivering specialty material that is not already available is the quickest approach to reach the correct people.
Backlinks via referrals:
- See the percentage of recommendations that resulted in site visits. Once you’ve identified your most profitable backlinks, you should concentrate on increasing traffic via those connections. In the Referrals section, you may examine statistics on both immediate and long-term referrals, providing you the opportunity to evaluate and contrast the performance of various backlinks.
- Let’s say that a certain ghost article attracted a sizable audience a year ago, but that number has since dwindled, leading to a decline in referral traffic. Therefore, it may be good to switch to working with an other site and abandon this one.
Social media flow:
- The best way to connect with customers in the modern era is through social media. Google Analytics may give you a rough idea of how many people are finding your site through social media and other similar resources.
- The social media flows are accessible via the Network Traffic menu item. This information also forms a flowchart page, which reveals which sites sent the most traffic to your landing page. Analyze the consistency of this social data over the course of several weeks or months.
Website Latency:
- Due to the increased speed of the internet, the latency of your website must also grow. If your web pages take too long to load, your visitors may become frustrated and leave without ever seeing your content.
- Site speed’s Overview section will provide you a general overview of how quickly your site loads. Particulars about individual pages, like their typical load times in seconds and more, are detailed there.
- Video and other graphic heavy pages sometimes take longer to load than text-only ones. Make sure that there aren’t too many images on your page.
Locate Bounce Pages:
- It’s important to keep a watch on both the pages that are bringing in the most traffic and the ones that are sending people away. Bounce rates can be measured with Google Analytics, as was just said.
- You can also analyse user behaviour and identify any unusual visitor behaviour that may be hurting your conversion rate by using this platform. However, keep in mind that high bounce rates are rather typical for content with unusual subject matter. Rather than frantically trying to reduce bounce rates, you should concentrate on making content that keeps people on your site.
Goal conversion:
- Many sites would rather have their visitors follow a prescribed procedure. Google Analytics’ data will point you in the right direction.
- Let’s pretend you run an online store and want to create a flowchart for customers to follow from the shopping cart to the payment page and then, once everything is settled, to the “thank you for your order” page.
- Setting up goal conversions can assist you even if you are not attempting to sell anything but rather to sign up for a forum or online app. Under the Conversions tab, you may track your progress toward your goals.
Visitor metrics:
- If your content is a good match for your keyword, people looking for that term are more likely to click over to your site. To keep them interested after they’ve arrived at your site, it needs to be interactive.
- Visitors’ profiles, both new and returning, can be tracked with Google Analytics. If you’re trying to compare something, this will help. Perhaps traffic was light at first, but then picked up as the counter went higher.
Landing page reports:
- Landing page reports can help you increase your conversion rate. You can see which pages are being visited the most by visitors by looking at the reports.
- Assuming your ‘blogs’ page serves as the primary entry point, you can boost your rankings by pointing more traffic to specific posts there. If you want to examine site data and boost conversion prospects, a landing page report for every page is invaluable. Advanced segments allow you to narrow down the overall traffic and identify the proportion of visitors who came from specific sources like social media or word-of-mouth.
In-page content analysis:
- Visitors’ actions on your whole website, down to individual pages, may be monitored in minute detail with Google Analytics. In spite of how much information there appears to be, it actually facilitates thorough investigation.
- In addition to the star rating, you can get reliable tracking numbers in the preview area above the page. Under the In-Page Analytics menu, it can be viewed graphically.
- You can even add image coding to your dashboard to better analyse traffic patterns here..
Custom searches:
- Google Analytics allows you to collect and analyse traffic statistics specifically for your website’s search functions. If you don’t have this capability enabled, you’re missing out on a tonne of potential customers.
- You’ll be able to monitor the most searched for terms on your site and see whether ornot your users find the results useful. A/B testing can be used to tailor analyses like these by reworking the search results page.
- In the Overview tab, you’ll find all the info you need to create your own site searches.
Real-time analysis:
- You can view current visitor activity on your site by visiting the real-time tracking page provided by Google Analytics. Charts and diagrams depicting the data will be made accessible. In addition, you will be able to view the link that led them to your website.
- You can see where your visitors are located at all times by scrolling to the bottom of the page and checking out the “Live Stats” section.
Intelligence events setup:
- You may not be able to monitor your site’s performance on a regular basis, and if you don’t, you may not notice a deviation from one factor to another; these variations may come as a shock when you examine your data.
- It can be useful to maintain track of critical values by setting up even indicator for intelligence occurrences. With this function, you can be alerted whenever significant deviations from patterns occur. Let’s pretend that one day, your website’s traffic unexpectedly increases by 200%. This is not typical, thus you will be informed of the deviation.
Conclusion:
The information in Google Analytics can be useful, but only if you know how to put it to work for you. If you are unfamiliar with Google Analytics but would like to learn how to utilise it for marketing research and decision making, a quick online course can get you up and running. Best practises for using the platform as a whole will also be covered.