
- What is Lean?| Everything You Need to Know
- What is SAP Workflow? : A Complete Guide
- Difference between Tableau and Power BI | Benefits and Special Features
- Data Warehouse in Tableau | Everything You Need to Know
- What is Tableau Server?| Everything You Need to Know | A Definitive Guide
- What is Dax in Power BI? | A Comprehensive Guide
- Upgrade in Tableau Desktop and Web Authoring | A Complete Guide with Best Practices
- What is SAP HANA | SAP HANA Database Connection | All you need to know [ OverView ]
- SAP BPC – What is Business Planning and Consolidation? : All you need to know [ OverView ]
- Root Cause Analysis: Definition, Examples & Methods | All you need to know [ OverView ]
- Seven Basic Quality Improvement Ishikawa Tools | Important asset to control quality in your project [OverView]
- What is Power BI | Its Use Cases and Applications | All you need to know [ OverView ]
- How and why to measure and analyze employee productivity | Everything You Need to Know
- Top 10 Employee Retention Strategies | Everything You Need to Know
- What are LookML Projects and the Developer Mode | How to Create LookML Projects?
- What are Slowly Changing Dimension | SCD Types and Implementations | Step-By-Step Process
- What is Pareto Chart and How to Create Pareto Chart | A Complete Guide For Beginners
- What does an Agile Business Analyst do | Required Skills, Roles and Responsibilities [ Job & Future ]
- What is Lean Management? | Role and Concepts of Lean Management | Expert’s Top Picks
- A Definitive Guide of Working Capital Management with Best Practices & REAL-TIME Examples
- Business Analytics with Excel Fundamentals | A Complete Guide For Beginners
- Business Analyst : Job Description | All you need to know [ Job & Future ]
- How to create a Splunk Dashboard | A Complete Guide For Beginners [ OverView ]
- What is Splunk Logging ? | The Ultimate Guide with Expert’s Top Picks
- Alteryx vs Tableau | Know Their Differences and Which Should You Learn?
- What is Predictive Analytics? : Step-By-Step Process with REAL-TIME Examples
- An Overview of SAS Stored Processes | The Ultimate Guide with Expert’s Top Picks
- How to Create Conditional Formatting in Cognos Report Studio | A Complete Guide
- Difference between OLTP vs OLAP | Know Their Differences and Which Should You Learn?
- ECBA vs CCBA vs CBAP | A Complete Guide For Beginners | Know Their Differences and Which Should You Learn?
- Import Custom Geocode Data in Tableau | Everything You Need to Know [ OverView ]
- Data Warehouse Tools : Features , Concepts and Architecture
- PGDM vs MBA | Know Their Differences and Which Should You Learn?
- Most Popular Data Visualization Tools | A Complete Beginners Guide | REAL-TIME Examples
- Tableau vs Looker : Comparision and Differences | Which Should You Learn?
- Benefits of Employee Satisfaction for the Organization [ Explained ]
- DAX In Power BI – Learn Power BI DAX Basics [ For Freshers and Experience ]
- Power Bi vs Tableau : Comparision and Differences | Which Should You Learn?
- What is Alteryx Tools | Alteryx ETL Tools | Comprehensive Guide
- What is Tableau Prep? : Comprehensive Guide | Free Guide Tutorial & REAL-TIME Examples
- What are Business Intelligence Tools ? : All you need to know [ OverView ]
- Tableau Aggregate Functions | A Complete Guide with REAL-TIME Examples
- Intervalmatch Function in Qlikview | Everything You Need to Know [ OverView ]
- QlikView Circular Reference | Free Guide Tutorial & REAL-TIME Examples
- Data Blending in Tableau | A Complete Guide with Best Practices | Free Guide Tutorial [ OverView ]
- Splunk vs ELK | Differences and Which Should You Learn? [ OverView ]
- QlikSense vs QlikView | Differences and What to learn and Why?
- What Is Measurement System Analysis | Required Skills | Everything You Need to Know
- Splunk Timechart | Free Guide Tutorial & REAL-TIME Examples
- What Is Image Processing ? A Complete Guide with Best Practices
- What is a Business Analysis ? A Complete Guide with Best Practices
- Top Business Analytics Tools | Comprehensive Guide
- Business Analyst Career Path [ Job & Future ]
- Time Series Analysis Tactics | A Complete Guide with Best Practices
- What is Splunk ? Free Guide Tutorial & REAL-TIME Examples
- Which Certification is Right for You: Six Sigma or Lean Six Sigma?
- SAS Vs R
- Top Technology Trends for 2020
- Data Analyst vs. Data Scientist
- What are the Essential Skills That You Need to Master in Data Analyst?
- What is Six Sigma?
- Common Cause Variation Vs Special Cause Variation
- Reasons to Get a Six Sigma Certification
- What Is Strategic Enterprise Management and its Components?
- What Are The Benefits Measurement Constrained Optimization Methods?
- What Is the Benefit of Modern Data Warehousing?
- What Is Corporate Social Responsibility (CSR)?
- What Is The Purpose and Importance Of Financial Analysis?
- What is Insights-as-a-Service (IaaS)?
- Business Analytics With R Programming Languages
- Where Are The 8 Hidden Wastes?
- What Are Market Structures?
- What is Cost of Quality (COQ)?
- What is Build Verification Testing?
- Quality Improvement in Six Sigma
- What is Process Capability Analysis?
- How To Measure The Effectiveness Of Corporate Training
- SAP Financials And SAP Accounting Modules
- Tips to Learn Tableau
- Why Should I Become a CBAP?
- History And Evolution of Six Sigma
- How to use Control Chart Constants?
- Data Analytics Course For Beginners
- How to Build a Successful Data Analyst Career?
- Data Analytics Vs Business Analytics
- What is SAP Certification?
- Books To Read For a Six Sigma Certification
- Six Sigma Green Belt Salary
- What is the ASAP Methodology?
- Complete list of SAP modules
Top Business Analytics Tools | Comprehensive Guide
Last updated on 27th Oct 2022, Artciles, Blog, Business Analytics
- In this article you will learn:
- 1.What are tools for business analytics?
- 2.Why is it important to do business analytics?
- 3.Business statistics have the following
- 4.Statistics for Business
- 5.Top Business Analytics tool trends
- 7.Conclusion
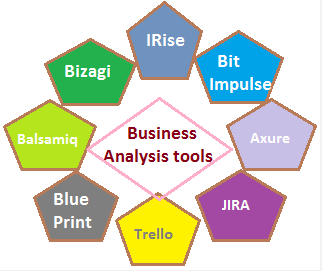
What are tools for business analytics?
Business analysts use a variety of application software that pulls data from different business systems, both quantitative and qualitative, and puts it in a repository. So, analysts can look at the data and analyze it so that smarter decisions can be made.
Most companies use a variety of business analytics software, such as statistical tools, predictive modeling tools, and data mining tools. These business analytics software applications give organizations a big-picture view of the key insights that help them be more efficient, productive, and profitable.
Business statistics have the following:
A business analyst must have these six things in an analysis tool:
Easy-to-Use Interface:
It should have a clear visual interface that lets the user do analytical tasks without having to write codes or edit them.
Ability to Gather Information:
Business users can get data from many different places, so the tool should be able to handle advanced data and enrichment.
Ideas you can use:
In the fast-paced business world of today, where even a few seconds of delay can make customers leave, the tool should be able to provide business intelligence that is ready to be used.
Simple to pass on:
To get network information to a place with more than one user, it should be easy to share.
Quick stats:
It should grow so that customised analysis and the creation of new modules can be done to meet the changing needs of the business.
Help with Integration:
It should be able to work with other major BI, statistics, or data recognition tools so that mobility and data compliance are not a problem.
Why is it important to do business analytics?
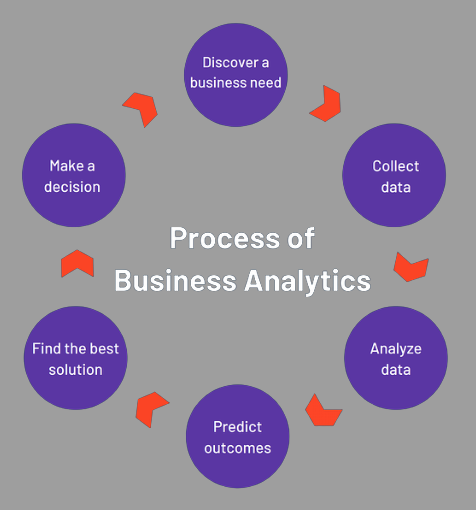
- Organizations use business statistics to make decisions that are based on facts. Business statistics give businesses a better idea of how to run their businesses and a better understanding of how they work. With this information, businesses can run more efficiently and automate their processes.
- Companies that run data and use business statistics often do better than the people of their time. This is because the information they get from business statistics helps them figure out why certain results happen, evaluate good business practices, and even predict whether or not certain results will be possible.
- Business statistics also give companies the help and coverage they need to make quick decisions that are right.
- The business analysis also helps gather important business information, which is another important part. It does this by showing information that is important.
- One part of a business analysis that can help any organisation get results faster is how efficient it is. Since they were first made, business statistics have helped businesses improve their efficiency in a big way.
- Business statistics collect a lot of data over time and put it in a way that makes it easy to look at. This lets businesses make faster decisions that are better thought out.
- Using business statistics is a way for organisations to reduce risks. It can help businesses avoid short-term and long-term risks by helping them make decisions based on data like customer preferences, trends, and so on.
Statistics for Business:
There are four types of business analytics, and each one is getting more complicated. They give us a way to go about getting application data in real time and in the future. Below, we go into detail about each of these types of business statistics:
1. Statistics That Describe
Organizational information is summed up so that people can understand what has happened in the past or what is happening right now. Descriptive statistics are a simple type of math because they combine data with data mining. It makes it easier for investors, shareholders, sales managers, and sales managers to get access to data. It can help you figure out your strengths and weaknesses and give you information about how your customers act. This helps come up with strategies for marketing to specific groups.
2. Diagnostic statistics
This kind of analysis helps move the focus from what happened in the past to what is happening now and figure out what factors affect trends. Methods like collecting data, mining data, and downgrading were used to figure out what caused the events to happen.
3. Analytics for the future
This kind of analysis uses mathematical models and machine learning to predict what will happen in the future. Using descriptive statistics, make models to figure out what objects might be. Experts in machine learning are hired to do analyses that can be predicted. In terms of accuracy, they can do better than traditional business intelligence. Emotional analysis is often used in this way. Existing information from social media is gathered and used to give a full picture of how users see things. This information is used to predict how they will feel (positive, neutral, or negative).
4. Written Analysis
It goes further than the predicted analysis and suggests the best next step to take. It shows all the good things that will happen if you follow a certain path and tells you what you need to do to get there. It depends a lot on two things: a strong system for responding and constant analysis. Find out how what you do affects the world around you. Statistics like these are often used to make programmes that suggest things to people.
Top Business Analytics tool trends:
Data enables business.
Organizations need it to stay successful and competitive, but they’ve always made big decisions by looking at a lot of data in the past. COVID-19, on the other hand, has shown that models that use data from the past are no longer useful. Data that is used to make business decisions must be collected, analyzed, and understood in real time so that organizations can respond to what is happening instead of making decisions based on what happened in the past.
As more businesses start to use a new business analysis method to find real-time data that can be analyzed, it will be important to understand new business statistics trends. These are the most likely things to happen in the future.
DataOps
DataOps, which stands for “data operations,” is a short-term method that makes it easier for organizations to keep track of their data analytics activities. It helps data professionals get important information out of raw data, and it uses the popularity of Facebook and Netflix to give them an edge over their competitors. The DataOps approach brings together the best ways that data professionals and well-known DevOps teams work. This combination makes data editing better and easier by letting people work together on it.
The continuous integration and delivery (CI/CD) method is used by DataOps. Automation is used in this method to speed up long processes, which increases productivity and gets results faster at all stages of a data analysis project.
Using your brain when making decisions
Many organizations rely on automation to help them make sense of their data faster and more accurately, but many are left wondering, “Now what?” Gartner says that more than a third of analysts in large companies will be doing DI by the year 2023.
For DI driving, data professionals usually review predictable, descriptive, diagnostic, descriptive, and deciding data. They also use artificial intelligence (AI) and machine learning (ML) to speed up the process of analyzing data, which would have to be done by hand otherwise. By using DI to improve business decision-making, organizations can improve the user experience, set themselves apart from competitors, and make more money.
At the edge, data is worked on.
Usually, the technology that makes it possible to analyze data is handled in a central data center. This means that the data collected by a business must be moved from where it is created and disconnected from the network to where the computing power is needed to process the data.
Edge computing is a new computer system that uses computer power on the edges of data centers to process data closer to where it came from. This cuts down on the amount of data that moves through the network, which lowers costs, shortens wait times, and lets data be processed in real time.
Processing in the Native Language
Native language processing (NLP) gets rid of a common problem in mathematics. Data professionals and other stakeholders who don’t have the skills to work with data but need to get business information from it can use different programming languages. NLP can be used in business statistics tools so that users of all skill levels can ask questions about data in their native language and get answers from the computer. By combining people, data tools, and analytics tools, NLP makes it possible for people without technical skills to gather and analyze data. This includes everyone from the C-suite to vendors, customer service, and marketing teams. They need it as quickly and easily as they can get it.
Conclusion:
Statistics in business is a great field to work in. It will make things better for businesses. Some big companies still use a lot of the business statistics tools that we use every day. Using business statistics has a lot of good points. Business statistics are also better than business intelligence because they are better at making predictions and figuring out what will happen based on what has already happened.