
- 10 Best Data Analytics Tools for Big Data Analysis | Everything You Need to Know
- What is Azure Databricks | A Complete Guide with Best Practices
- Elasticsearch Nested Mapping : The Ultimate Guide with Expert’s Top Picks
- Various Talend Products and their Features | Expert’s Top Picks with REAL-TIME Examples
- What is Apache Pig ? : A Definitive Guide | Everything You Need to Know [ OverView ]
- Introduction to HBase and Its Architecture | A Complete Guide For Beginners
- What is Azure Data Lake ? : Expert’s Top Picks | Everything You Need to Know
- What is Splunk Rex : Step-By-Step Process with REAL-TIME Examples
- What is Data Pipelining? : Step-By-Step Process with REAL-TIME Examples
- Dedup : Splunk Documentation | Step-By-Step Process | Expert’s Top Picks
- What Is a Hadoop Cluster? : A Complete Guide with REAL-TIME Examples
- Spark vs MapReduce | Differences and Which Should You Learn? [ OverView ]
- Top Big Data Challenges With Solutions : A Complete Guide with Best Practices
- Hive vs Impala | What to learn and Why? : All you need to know
- What is Apache Zookeeper? | Expert’s Top Picks | Free Guide Tutorial
- What is HDFS? Hadoop Distributed File System | A Complete Guide [ OverView ]
- Who Is a Data Architect? How to Become and a Data Architect? : Job Description and Required Skills
- Kafka vs RabbitMQ | Differences and Which Should You Learn?
- What is Apache Hadoop YARN? Expert’s Top Picks
- How to install Apache Spark on Windows? : Step-By-Step Process
- What is Big Data Analytics ? Step-By-Step Process
- Top Big Data Certifications for 2020
- What is Hive?
- Big Data Engineer Salary
- How Facebook is Using Big Data?
- Top Influencers in Big Data and Analytics in 2020
- How to Become a Big Data Hadoop Architect?
- What Are the Skills Needed to Learn Hadoop?
- How to Become a Big Data Analyst?
- How Big Data Can Help You Do Wonders In Your Business
- Essential Concepts of Big Data and Hadoop
- How Big Data is Transforming Retail Industry?
- How big Is Big Data?
- How to Become a Hadoop Developer?
- Hadoop Vs Apache Spark
- PySpark Programming
What is Big Data Analytics ? Step-By-Step Process
Last updated on 27th Oct 2022, Artciles, Big Data, Blog
- In this article you will learn:
- 1.What is Big Data Analytics.
- 2.Advantages of Big Data Analytics.
- 3.Big Data Analytics Lifecycle Phases.
- 4.Several Distinct Methods for Analyzing Big Data.
- 5.Big Data Analytics Tools.
- 6.Applications of Big Data in Multiple Industries.
- 7.The newest trends in analytics for big data.
- 8.Conclusion.
What is Big Data Analytics:
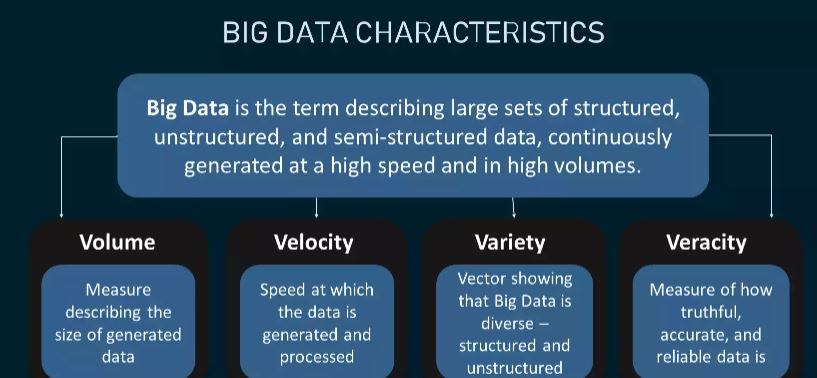
“Big data analytics” is the process of finding hidden patterns, trends, and connections in huge amounts of raw data to help people make decisions that are based on statistics. Statistical analysis techniques like clustering and regression are used in these methods, but they are applied to larger datasets with the help of more modern tools. Since the early 2000s, when advances in software and hardware made it possible for companies to manage large quantities of unstructured data, “big data” has been a popular term in the business world.Since then, advances in technology such as smartphones and Amazon have contributed to an even greater increase in the total size of the data sets that are available to groups. Because there are so many numbers, early innovation projects like Hadoop, Spark, and NoSQL databases have been made to store and process huge amounts of data. This field is constantly evolving as data engineers search for new ways to combine the massive amounts of complicated data generated by sensors, networks, transactions, intelligent devices, internet usage, and other sources. Even right now, methods for analyzing large amounts of data are being mixed with new technologies like machine learning to find and scale more complex insights.
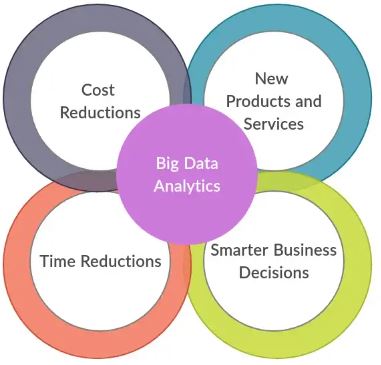
Advantages of Big Data Analytics:
1. Risk Assessment Use Case: Banco de Oro, a Philippine banking firm, employs Big Data analytics to detect fraudulent activities and inconsistencies. It is used by the organization to narrow down a list of suspects or root causes of problems.
2. Product Innovation and Development Use Case: Rolls-Royce, one of the world’s largest manufacturers of jet engines for airlines and the armed forces, employs big data analytics to determine how efficient engine designs are and where improvements can be made.
3. Organizational Decision Making that is Faster and Better: Starbucks employs Big Data analytics to make strategic decisions. For example, the company uses it to decide if a certain place is a good place for a new store. They will look at a variety of factors, including population, demographics, location accessibility, and more.
4. Enhance the Customer Experience Case Study: Delta Air Lines analyzes big data to improve customer experiences. They monitor tweets to learn about their customers’ travel experiences, such as delays. The airline recognizes negative tweets and takes the necessary steps to correct the situation.
Big Data Analytics Lifecycle Phases:
Let’s take a look at how Big Data analytics works:
The big data analytics lifecycle begins with a business case, which defines the reason and goal for the analysis:
Stage 1: Data Identification – A wide range of data sources are identified here.
Stage 2: Data filtering – All of the previously identified data is filtered here to remove corrupt data.
Stage 3: Data extraction – Data that is incompatible with the tool is extracted and then transformed.
Stage 4: Data aggregation – In this stage, data from different datasets with the same fields are combined.
Stage 5: Data analysis – Data is evaluated using analytical and statistical tools to discover useful information.
Stage 6 : Data visualisation – Big Data analysts can create graphic visualisations of the analysis using tools such as Tableau, Power BI, and QlikView.
Stage 7: Final analysis result – This is the final stage of the Big Data analytics lifecycle, in which the final analysis results are made available to business stakeholders who will take action.
Several Distinct Methods for Analyzing Big Data:
The following is a list of the four types of analytics used with big data:
1. Analytical Descriptive Statistics:
This provides a concise summary of the historical data in a format that is easy for people to read. This makes it easier to create reports about a company’s revenue, profit, sales, and other metrics, among other things. In addition to this, it assists in the compilation of statistics regarding social media.
Case Study: The Dow Chemical Company reviewed its historical data in order to improve the facility utilization rate across all of its office and laboratory space. By utilizing descriptive analytics, Dow was able to locate space that was not being used to its full potential. Due to the consolidation of space, the company was able to save almost $4 million in the United States annually.
2. Analytical and Diagnostic Procedures:
This is done in order to gain an understanding of the factors that contributed to the problem in the first place. Examples of these kinds of methods include drill-down analysis, data mining, and data recovery. Diagnostic analytics are utilized by organizations due to the fact that they offer a comprehensive understanding of a specific issue.
Use Case: A report from an e-commerce company shows that their sales have decreased, despite the fact that customers are continuing to add items to their shopping carts. This could be because the form didn’t load correctly, the shipping fee was too high, or there weren’t enough payment options. To determine the cause of the issue at hand, you can make use of diagnostic analytics.
3. Analytical Predictions and Modeling:
This type of analytics examines data from both the past and the present in order to forecast the future. Data mining, AI, and machine learning are all parts of predictive analytics, which looks at data from the past to predict what will happen in the future. It works by predicting trends among customers as well as trends among markets, and so on.
Use Case: PayPal figures out what kinds of precautions they need to take to keep their customers from doing anything illegal with their money. With the help of predictive analytics, the company compiles all of the historical information regarding payments and user behavior and then uses this information to develop an algorithm that can anticipate fraudulent activities.
4. The application of prescriptive analytics:
This method of analytics provides recommendations for how a particular issue can be resolved. Perspectival analytics can be used in conjunction with both predictive and descriptive analytics. Artificial intelligence and machine learning are relied on the majority of the time.
Use Case: Prescriptive analytics can be applied to increase the amount of profit that an airline makes. This type of analytics is used to make an algorithm that automatically changes flight prices based on a wide range of factors, such as customer demand, the weather, the destination, holiday seasons, and oil prices.
Big Data Analytics Tools:
The following is a list of some of the most important analytics tools for big data:
- Hadoop is a tool that assists in the storage and analysis of data.
- MongoDB is used on datasets that undergo frequent modifications.
- Talend is a platform that is used for the integration and management of data.
- The Cassandra database is a distributed system that is used to manage chunks of data.
- Spark is a tool that allows for the processing and analysis of large amounts of data in real time.
- A real-time computational system that is open-source and known as STORM.
- Kafka is a fault-tolerant storage platform that operates on the principle of distributed streaming.
Applications of Big Data in Multiple Industries:
The following is a list of some of the industries that make active use of big data:
- Big data analytics is used in e-commerce in a variety of ways, including predicting the behavior of customers and adjusting prices accordingly.
- Big data analytics help drive marketing campaigns with a high return on investment, which leads to more sales. This is thanks to marketing.
- Education: Used to create new and improve on existing courses based on the demands of the market.
- In healthcare, big data analytics are used along with a patient’s medical history to make a prediction about how likely it is that the patient will have certain health problems.
- Media and entertainment: Used to understand the demand for shows, movies, songs, and other types of content so that it can deliver a personalised recommendation list to its users.
- Financial services: Customers’ income and spending habits can help predict how likely they are to choose loans and credit cards, among other financial products and services.
- Used in the telecommunications industry to improve customer experience and make predictions regarding network capacity.
- Analytics that are based on a lot of data can help governments in many ways, including with law enforcement.
The newest trends in analytics for big data:
You might be surprised to learn that we produce more information in two days than we have throughout history. Yes, that’s true, and most people don’t even realize that we learn a lot just by surfing the Internet. If you don’t want to be caught off guard by technology in the future, pay attention to these modern trends in big data analytics and do well.
1. Data as carrier:
Usually, data is stored in data stores, which can be reached with the help of different programs. When software as a service, or SaaS, became popular, Daas was just the beginning. As with software-as-a-service packages, data as a service uses cloud technology to give customers and programs on-demand access to data no matter where the customers or packages are.Data as a Service “Data as a Service” is a new trend in big data analytics that could make it easier for analysts to get facts for business evaluation tasks and for different parts of a business or enterprise to share statistics.
2. Artificial intelligence needs to be more responsible and smarter:
Responsible and scalable AI will make it possible for algorithms to learn better and get to market faster. Businesses will get a lot more out of AI systems that help them come up with strategies that work. AI will be used on a large scale by businesses, which has been a great task up until now.
3. Analytics for the future:
Big data analytics has always been an important tool for businesses to stay ahead of the competition and achieve their objectives. They use basic analytics tools to put together a lot of data and figure out why different problems happen. Predictive techniques are used to look at both current data and data from the past in order to learn more about clients and possible risks and activities for a business.Large-scale data analysis that uses predictive analysis can guess what will happen in the future. This method is very green when it comes to correcting data that has been analyzed and put together to predict consumer response. This lets groups plan out the steps they need to take by knowing what the next step will be for a customer before they take it.
4. Quantum Computing:
With modern technology, it can take a long time to process a large amount of data. Quantum computers, on the other hand, can figure out the probability of an object’s state or an event before it is measured. This means that they can store a lot more information than classical computers.If we could only compress billions of pieces of data right now in just a few minutes, we could cut processing time by a huge amount, giving groups the chance to make well-timed decisions and get better results. Using quantum computing, this could be a possible way to do things. Putting quantum computers to the test for accurate, purposeful, and analytical studies across multiple companies could make business more accurate.
6. Processing of the natural language:
Natural Language Processing (NLP) is a part of artificial intelligence that helps computers and people talk to each other more. The goal of NLP is to be able to read and understand what people say. Most of the time, natural language processing is based on machine learning, and it is used to improve word processors or software that translates languages. Natural language processing techniques use grammar rules and algorithms to figure out what each sentence means and get the information they need from it.In natural language processing, most of the time, syntactic evaluation and semantic evaluation are used. Syntactic evaluation is the only one that looks at sentences and grammatical mistakes. Semantic evaluation, on the other hand, looks at what the data/text means.
7. Hybrid Clouds:
A cloud computing machine uses both a private cloud on-site and a public cloud run by a third party. The interfaces between the two clouds are orchestrated. A hybrid cloud gives you a lot of freedom and more ways to deploy your data by letting you switch between your private cloud and the public cloud. A company needs a private cloud to be able to use the public cloud in a flexible way.To do that, it needs to build a bigger datacenter with servers, a garage, a LAN, and a cargo balancer. The organization has to set up a virtualization layer or hypervisor to help the VMs and containers. and the deployment of a personal software program layer in the cloud. The use of software makes it possible to move data between the personal cloud and the public cloud.
8. Data Fabric:
Data cloth is a structure and set of data networks that work together. This gives stable functionality to a lot of endpoints, both on-premises and in the cloud. Data Fabric simplifies and organizes the data garage in both cloud and on-premises environments so that virtual transformation can happen. It lets people get access to data and share it in a shared data environment. It also provides a stable data control framework for the entire un-siloed garage.
9. XOps:
The goal of XOps (statistics, machine learning, modeling, and platform) is to find ways to save time and money. XOps is done by making sure that DevOps best practices are followed. So, to make sure performance, reusability, and repeatability are maintained while reducing time, replication and automation are needed. With these changes, prototypes could be made bigger, with layouts that can be changed and ruled structures that can be put together quickly and easily.
Conclusion:
The advent of Big Data ushered in a new era. A wide variety of organizations are increasingly relying on advanced analytics to drive strategic movement and deliver an improved customer experience. Because even the slightest shift in performance or the smallest amount of financial savings can result in massive profits, the majority of businesses are transitioning toward massive statistics.