

Machine Learning Interview Questions and Answers
Last updated on 27th Sep 2020, Blog, Interview Question, Machine Learning
Ready to face your next Machine Learning interview? Be interview-ready with this list of Machine Learning interview questions and answers, carefully curated by industry experts. Be ready to answer different questions like CRISP-DM, difference between univariate and bivariate analysis, chi-square test, difference between Type 1 and Type 2 Error, Bias-Variance trade-off. We have gathered a set of interview questions for machine learning that will help you become a machine learning engineer, data engineer.
1.What Are the Different Types of Machine Learning?
Ans:
There are three types of machine learning:
Supervised Learning
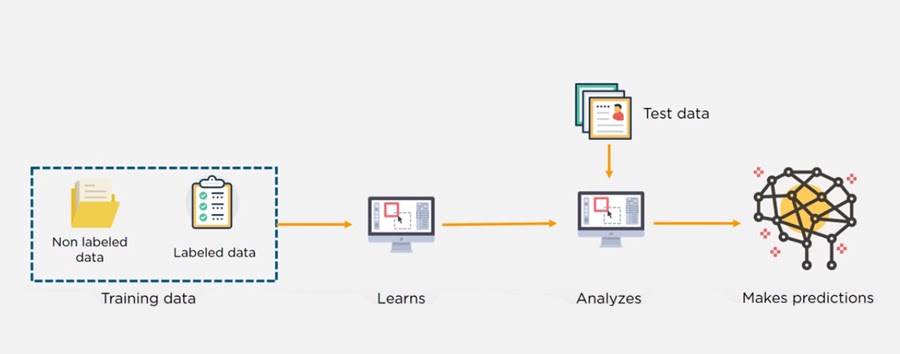
In supervised machine learning, a model makes predictions or decisions based on past or labeled data. Labeled data refers to sets of data that are given tags or labels, and thus made more meaningful.
Unsupervised Learning
In unsupervised learning, we don’t have labeled data. A model can identify patterns, anomalies, and relationships in the input data.
Reinforcement Learning
Using reinforcement learning, the model can learn based on the rewards it received for its previous action.
Consider an environment where an agent is working. The agent is given a target to achieve. Every time the agent takes some action toward the target, it is given positive feedback. And, if the action taken is going away from the goal, the agent is given negative feedback.
2.What is Overfitting, and How Can You Avoid It?
Ans:
Overfitting is a situation that occurs when a model learns the training set too well, taking up random fluctuations in the training data as concepts. These impact the model’s ability to generalize and don’t apply to new data.
When a model is given the training data, it shows 100 percent accuracy—technically a slight loss. But, when we use the test data, there may be an error and low efficiency. This condition is known as overfitting.
There are multiple ways of avoiding overfitting, such as:
- Regularization. It involves a cost term for the features involved with the objective function
- Making a simple model. With lesser variables and parameters, the variance can be reduced
- Cross-validation methods like k-folds can also be used
- If some model parameters are likely to cause overfitting, techniques for regularization like LASSO can be used that penalize these parameters
3.What is ‘training Set’ and ‘test Set’ in a Machine Learning Model? How Much Data Will You Allocate for Your Training, Validation, and Test Sets?
Ans:
There is a three-step process followed to create a model:
- 1.Train the model
- 2.Test the model
- 3.Deploy the model
| Training Set | Test Set |
|---|---|
| The training set is examples given to the model to analyze and learn70% of the total data is typically taken as the training datasetThis is labeled data used to train the model | The test set is used to test the accuracy of the hypothesis generated by the modelRemaining 30% is taken as testing datasetWe test without labeled data and then verify results with labels |
Consider a case where you have labeled data for 1,000 records. One way to train the model is to expose all 1,000 records during the training process. Then you take a small set of the same data to test the model, which would give good results in this case.
But, this is not an accurate way of testing. So, we set aside a portion of that data called the ‘test set’ before starting the training process. The remaining data is called the ‘training set’ that we use for training the model. The training set passes through the model multiple times until the accuracy is high, and errors are minimized.
Now, we pass the test data to check if the model can accurately predict the values and determine if training is effective. If you get errors, you either need to change your model or retrain it with more data.
Regarding the question of how to split the data into a training set and test set, there is no fixed rule, and the ratio can vary based on individual preferences.
4.How Do You Handle Missing or Corrupted Data in a Dataset?
Ans:
One of the easiest ways to handle missing or corrupted data is to drop those rows or columns or replace them entirely with some other value.
There are two useful methods in Pandas:
- IsNull() and dropna() will help to find the columns/rows with missing data and drop them
- Fillna() will replace the wrong values with a placeholder value
5.How Can You Choose a Classifier Based on a Training Set Data Size?
Ans:
When the training set is small, a model that has a right bias and low variance seems to work better because they are less likely to overfit.
For example, Naive Bayes works best when the training set is large. Models with low bias and high variance tend to perform better as they work fine with complex relationships.
6.Explain the Confusion Matrix with Respect to Machine Learning Algorithms.
Ans:
A confusion matrix (or error matrix) is a specific table that is used to measure the performance of an algorithm. It is mostly used in supervised learning; in unsupervised learning, it’s called the matching matrix.
The confusion matrix has two parameters:
- Actual
- Predicted
It also has identical sets of features in both of these dimensions.
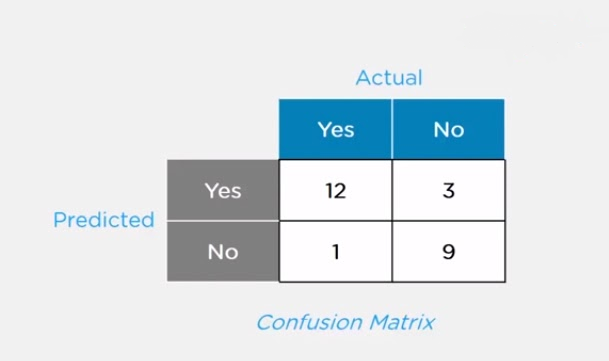
Here,
For actual values:
- Total Yes = 12+1 = 13
- Total No = 3+9 = 12
Similarly, for predicted values:
- Total Yes = 12+3 = 15
- Total No = 1+9 = 10
For a model to be accurate, the values across the diagonals should be high. The total sum of all the values in the matrix equals the total observations in the test data set.
For the above matrix, total observations = 12+3+1+9 = 25
Now, accuracy = sum of the values across the diagonal / total dataset
- = (12+9) / 25
- = 21 / 25
- = 84%
7.What Is a False Positive and False Negative and How Are They Significant?
Ans:
False positives are those cases which wrongly get classified as True but are False.
False negatives are those cases which wrongly get classified as False but are True.
In the term ‘False Positive,’ the word ‘Positive’ refers to the ‘Yes’ row of the predicted value in the confusion matrix. The complete term indicates that the system has predicted it as a positive, but the actual value is negative.
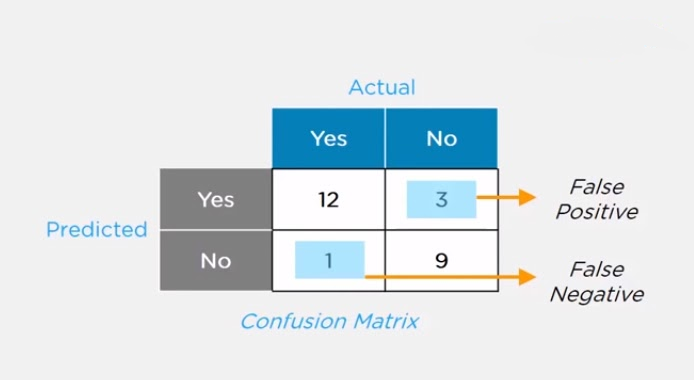
So, looking at the confusion matrix, we get:
- False-positive = 3
- True positive = 12
Similarly, in the term ‘False Negative,’ the word ‘Negative’ refers to the ‘No’ row of the predicted value in the confusion matrix. And the complete term indicates that the system has predicted it as negative, but the actual value is positive.
So, looking at the confusion matrix, we get:
- False Negative = 1
- True Negative = 9
8.What Are the Three Stages of Building a Model in Machine Learning?
Ans:
The three stages of building a machine learning model are:
- Model Building
Choose a suitable algorithm for the model and train it according to the requirement - Model Testing
Check the accuracy of the model through the test data - Applying the Model
Make the required changes after testing and use the final model for real-time projects
Here, it’s important to remember that once in a while, the model needs to be checked to make sure it’s working correctly. It should be modified to make sure that it is up-to-date.
9.What is Deep Learning?
Ans:
Deep learning is a subset of machine learning that involves systems that think and learn like humans using artificial neural networks. The term ‘deep’ comes from the fact that you can have several layers of neural networks.
One of the primary differences between machine learning and deep learning is that feature engineering is done manually in machine learning. In the case of deep learning, the model consisting of neural networks will automatically determine which features to use (and which not to use).
10.What Are the Differences Between Machine Learning and Deep Learning?
Ans:
| Machine Learning | Deep Learning |
|---|---|
| Enables machines to take decisions on their own, based on past dataIt needs only a small amount of data for trainingWorks well on the low-end system, so you don’t need large machines Most features need to be identified in advance and manually codedThe problem is divided into two parts and solved individually and then combined | Enables machines to take decisions with the help of artificial neural networksIt needs a large amount of training data Needs high-end machines because it requires a lot of computing power The machine learns the features from the data it is providedThe problem is solved in an end-to-end manner |
Subscribe For Free Demo
Error: Contact form not found.
11.What Are the Applications of Supervised Machine Learning in Modern Businesses?
Ans:
Applications of supervised machine learning include:
- Email Spam Detection
Here we train the model using historical data that consists of emails categorized as spam or not spam. This labeled information is fed as input to the model. - Healthcare Diagnosis
By providing images regarding a disease, a model can be trained to detect if a person is suffering from the disease or not. - Sentiment Analysis
This refers to the process of using algorithms to mine documents and determine whether they’re positive, neutral, or negative in sentiment. - Fraud Detection
Training the model to identify suspicious patterns, we can detect instances of possible fraud.
12.What is Semi-supervised Machine Learning?
Ans:
Supervised learning uses data that is completely labeled, whereas unsupervised learning uses no training data.
In the case of semi-supervised learning, the training data contains a small amount of labeled data and a large amount of unlabeled data.
13.What Are Unsupervised Machine Learning Techniques?
Ans:
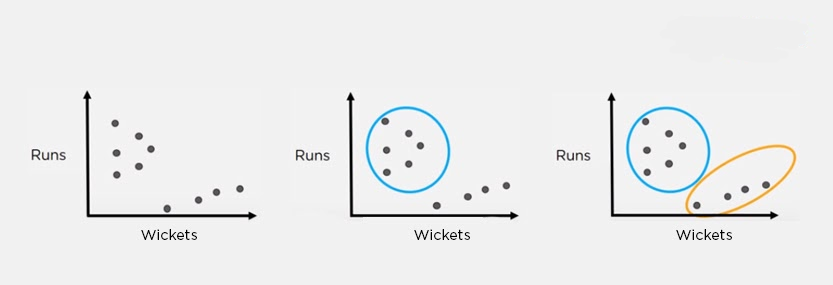
There are two techniques used in unsupervised learning: clustering and association.
Clustering
Clustering problems involve data to be divided into subsets. These subsets, also called clusters, contain data that are similar to each other. Different clusters reveal different details about the objects, unlike classification or regression.
Association
In an association problem, we identify patterns of associations between different variables or items.
For example, an e-commerce website can suggest other items for you to buy, based on the prior purchases that you have made, spending habits, items in your wishlist, other customers’ purchase habits, and so on.

14.What is the Difference Between Supervised and Unsupervised Machine Learning?
Ans:
- Supervised learning – This model learns from the labeled data and makes a future prediction as output
- Unsupervised learning – This model uses unlabeled input data and allows the algorithm to act on that information without guidance.
15.What is the Difference Between Inductive Machine Learning and Deductive Machine Learning?
Ans:
| Inductive Learning | Deductive Learning |
|---|---|
| It observes instances based on defined principles to draw a conclusionExample: Explaining to a child to keep away from the fire by showing a video where fire causes damage | It concludes experiencesExample: Allow the child to play with fire. If he or she gets burned, they will learn that it is dangerous and will refrain from making the same mistake again |
16.Compare K-means and KNN Algorithms.
Ans:
| K-means | KNN |
|---|---|
| K-Means is unsupervisedK-Means is a clustering algorithmThe points in each cluster are similar to each other, and each cluster is different from its neighboring clusters | KNN is supervised in natureKNN is a classification algorithmIt classifies an unlabeled observation based on its K (can be any number) surrounding neighbors |
17.What Is ‘Naive’ in the Naive Bayes Classifier?
Ans:
The classifier is called ‘naive’ because it makes assumptions that may or may not turn out to be correct.
The algorithm assumes that the presence of one feature of a class is not related to the presence of any other feature (absolute independence of features), given the class variable.
For instance, a fruit may be considered to be a cherry if it is red in color and round in shape, regardless of other features. This assumption may or may not be right (as an apple also matches the description).
18.Explain How a System Can Play a Game of Chess Using Reinforcement Learning.
Ans:
Reinforcement learning has an environment and an agent. The agent performs some actions to achieve a specific goal. Every time the agent performs a task that is taking it towards the goal, it is rewarded. And, every time it takes a step which goes against that goal or in reverse direction, it is penalized.
Earlier, chess programs had to determine the best moves after much research on numerous factors. Building a machine designed to play such games would require many rules to be specified.
With reinforced learning, we don’t have to deal with this problem as the learning agent learns by playing the game. It will make a move (decision), check if it’s the right move (feedback), and keep the outcomes in memory for the next step it takes (learning). There is a reward for every correct decision the system takes and punishment for the wrong one.
19.How Will You Know Which Machine Learning Algorithm to Choose for Your Classification Problem?
Ans:
While there is no fixed rule to choose an algorithm for a classification problem, you can follow these guidelines:
- If accuracy is a concern, test different algorithms and cross-validate them
- If the training dataset is small, use models that have low variance and high bias
- If the training dataset is large, use models that have high variance and little bias
20.How is Amazon Able to Recommend Other Things to Buy? How Does the Recommendation Engine Work?
Ans:
Once a user buys something from Amazon, Amazon stores that purchase data for future reference and finds products that are most likely also to be bought, it is possible because of the Association algorithm, which can identify patterns in a given dataset.

21.When Will You Use Classification over Regression?
Ans:
Classification is used when your target is categorical, while regression is used when your target variable is continuous. Both classification and regression belong to the category of supervised machine learning algorithms.
Examples of classification problems include:
- Predicting yes or no
- Estimating gender
- Breed of an animal
- Type of color
Examples of regression problems include:
- Estimating sales and price of a product
- Predicting the score of a team
- Predicting the amount of rainfall
22.How Do You Design an Email Spam Filter?
Ans:
Building a spam filter involves the following process:
- The email spam filter will be fed with thousands of emails
- Each of these emails already has a label: ‘spam’ or ‘not spam.’
- The supervised machine learning algorithm will then determine which type of emails are being marked as spam based on spam words like the lottery, free offer, no money, full refund, etc.
- The next time an email is about to hit your inbox, the spam filter will use statistical analysis and algorithms like Decision Trees and SVM to determine how likely the email is spam
- If the likelihood is high, it will label it as spam, and the email won’t hit your inbox
- Based on the accuracy of each model, we will use the algorithm with the highest accuracy after testing all the models

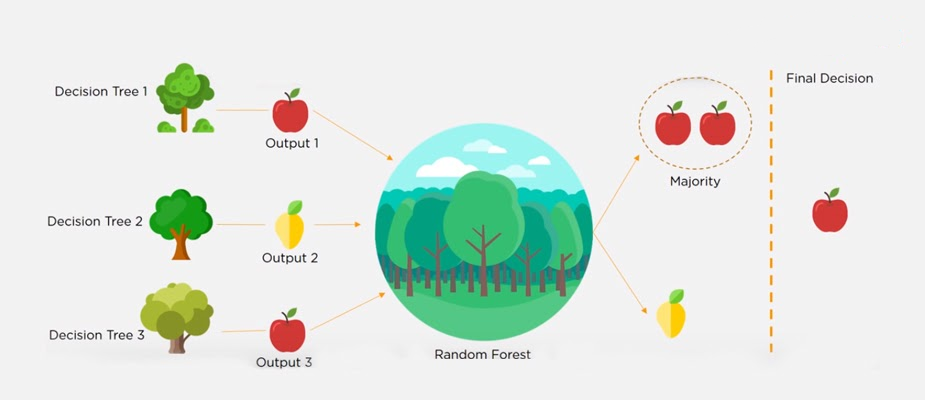
23.What is a Random Forest?
Ans:
A ‘random forest’ is a supervised machine learning algorithm that is generally used for classification problems. It operates by constructing multiple decision trees during the training phase. The random forest chooses the decision of the majority of the trees as the final decision.
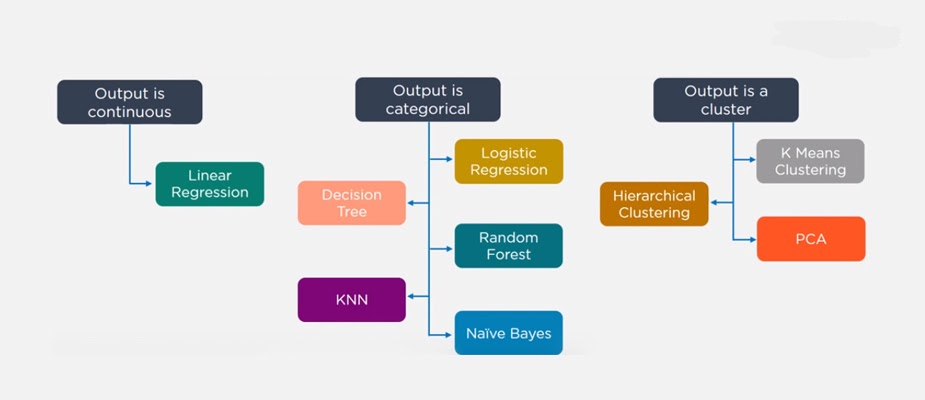
24.Considering a Long List of Machine Learning Algorithms, given a Data Set, How Do You Decide Which One to Use?
Ans:
There is no master algorithm for all situations. Choosing an algorithm depends on the following questions:
- How much data do you have, and is it continuous or categorical?
- Is the problem related to classification, association, clustering, or regression?
- Predefined variables (labeled), unlabeled, or mix?
- What is the goal?
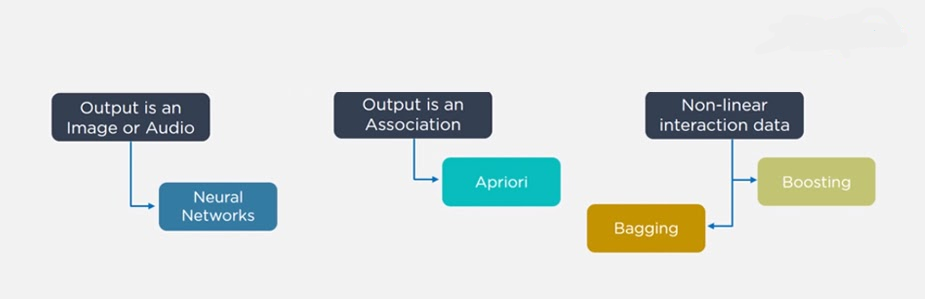
Based on the above questions, the following algorithms can be used:
25.What is Bias and Variance in a Machine Learning Model?
Ans:
Bias
Bias in a machine learning model occurs when the predicted values are further from the actual values. Low bias indicates a model where the prediction values are very close to the actual ones.
Underfitting: High bias can cause an algorithm to miss the relevant relations between features and target outputs.
Variance
Variance refers to the amount the target model will change when trained with different training data. For a good model, the variance should be minimized.
Overfitting: High variance can cause an algorithm to model the random noise in the training data rather than the intended outputs.
26.What is the Trade-off Between Bias and Variance?
Ans:
The bias-variance decomposition essentially decomposes the learning error from any algorithm by adding the bias, variance, and a bit of irreducible error due to noise in the underlying dataset.
Necessarily, if you make the model more complex and add more variables, you’ll lose bias but gain variance. To get the optimally-reduced amount of error, you’ll have to trade off bias and variance. Neither high bias nor high variance is desired.
High bias and low variance algorithms train models that are consistent, but inaccurate on average.
High variance and low bias algorithms train models that are accurate but inconsistent.
27.Define Precision and Recall.
Ans:
Precision
Precision is the ratio of several events you can correctly recall to the total number of events you recall (mix of correct and wrong recalls).
- Precision = (True Positive) / (True Positive + False Positive)
Recall
A recall is the ratio of a number of events you can recall the number of total events.
- Recall = (True Positive) / (True Positive + False Negative)
28.Explain the terms Artificial Intelligence (AI), Machine Learning (ML and Deep Learning?
Ans:
Artificial Intelligence (AI) is the domain of producing intelligent machines. ML refers to systems that can assimilate from experience (training data) and Deep Learning (DL) states to systems that learn from experience on large data sets. ML can be considered as a subset of AI. Deep Learning (DL) is ML but useful to large data sets. The figure below roughly encapsulates the relation between AI, ML, and DL:
In summary, DL is a subset of ML & both are subsets of AI.
Additional Information: ASR (Automatic Speech Recognition) & NLP (Natural Language Processing) fall under AI and overlay with ML & DL as ML is often utilized for NLP and ASR tasks.
29.What is the difference between deep learning and machine learning?
Ans:
machine learning
Machine Learning involves algorithms that learn from patterns of data and then apply it to decision making. Deep Learning, on the other hand, is able to learn through processing data on its own and is quite similar to the human brain where it identifies something, analyses it, and makes a decision.
The key differences are as follow:
The manner in which data is presented to the system.
Machine learning algorithms always require structured data and deep learning networks rely on layers of artificial neural networks.
30.How do you select important variables while working on a data set?
Ans:
There are various means to select important variables from a data set that include the following:
Identify and discard correlated variables before finalizing on important variables
The variables could be selected based on ‘p’ values from Linear Regression
Forward, Backward, and Stepwise selection
Lasso Regression
Random Forest and plot variable chart
Top features can be selected based on information gain for the available set of features.

Get JOB Oriented Machine Learning Training from Real Time Experts
- Instructor-led Sessions
- Real-life Case Studies
- Assignments
31.There are many machine learning algorithms till now. If given a data set, how can one determine which algorithm to be used for that?
Ans:
Machine Learning algorithm to be used purely depends on the type of data in a given dataset. If data is linear then, we use linear regression. If data shows non-linearity then, the bagging algorithm would do better. If the data is to be analyzed/interpreted for some business purposes then we can use decision trees or SVM. If the dataset consists of images, videos, audios then, neural networks would be helpful to get the solution accurately.
So, there is no certain metric to decide which algorithm to be used for a given situation or a data set. We need to explore the data using EDA (Exploratory Data Analysis) and understand the purpose of using the dataset to come up with the best fit algorithm. So, it is important to study all the algorithms in detail.
32.How are covariance and correlation different from one another?
Ans:
Covariance measures how two variables are related to each other and how one would vary with respect to changes in the other variable. If the value is positive it means there is a direct relationship between the variables and one would increase or decrease with an increase or decrease in the base variable respectively, given that all other conditions remain constant.
Correlation quantifies the relationship between two random variables and has only three specific values, i.e., 1, 0, and -1.
1 denotes a positive relationship, -1 denotes a negative relationship, and 0 denotes that the two variables are independent of each other.
33.State the differences between causality and correlation?
Ans:
Causality applies to situations where one action, say X, causes an outcome, say Y, whereas Correlation is just relating one action (X) to another action(Y) but X does not necessarily cause Y.
34.We look at machine learning software almost all the time. How do we apply Machine Learning to Hardware?
Ans:
We have to build ML algorithms in System Verilog which is a Hardware development Language and then program it onto an FPGA to apply Machine Learning to hardware.
35.Explain One-hot encoding and Label Encoding. How do they affect the dimensionality of the given dataset?
Ans:
One-hot encoding is the representation of categorical variables as binary vectors. Label Encoding is converting labels/words into numeric form. Using one-hot encoding increases the dimensionality of the data set. Label encoding doesn’t affect the dimensionality of the data set. One-hot encoding creates a new variable for each level in the variable whereas, in Label encoding, the levels of a variable get encoded as 1 and 0.
36.When does regularization come into play in Machine Learning?
Ans:
At times when the model begins to underfit or overfit, regularization becomes necessary. It is a regression that diverts or regularizes the coefficient estimates towards zero. It reduces flexibility and discourages learning in a model to avoid the risk of overfitting. The model complexity is reduced and it becomes better at predicting.
37.What is Bias, Variance and what do you mean by Bias-Variance Tradeoff?
Ans:
Both are errors in Machine Learning Algorithms. When the algorithm has limited flexibility to deduce the correct observation from the dataset, it results in bias. On the other hand, variance occurs when the model is extremely sensitive to small fluctuations.
If one adds more features while building a model, it will add more complexity and we will lose bias but gain some variance. In order to maintain the optimal amount of error, we perform a tradeoff between bias and variance based on the needs of a business.
Bias stands for the error because of the erroneous or overly simplistic assumptions in the learning algorithm . This assumption can lead to the model underfitting the data, making it hard for it to have high predictive accuracy and for you to generalize your knowledge from the training set to the test set.
Variance is also an error because of too much complexity in the learning algorithm. This can be the reason for the algorithm being highly sensitive to high degrees of variation in training data, which can lead your model to overfit the data. Carrying too much noise from the training data for your model to be very useful for your test data.
The bias-variance decomposition essentially decomposes the learning error from any algorithm by adding the bias, the variance and a bit of irreducible error due to noise in the underlying dataset. Essentially, if you make the model more complex and add more variables, you’ll lose bias but gain some variance — in order to get the optimally reduced amount of error, you’ll have to trade off bias and variance. You don’t want either high bias or high variance in your model.
38.How can we relate standard deviation and variance?
Ans:
Standard deviation refers to the spread of your data from the mean. Variance is the average degree to which each point differs from the mean i.e. the average of all data points. We can relate Standard deviation and Variance because it is the square root of Variance.
39.A data set is given to you and it has missing values which spread along 1standard deviation from the mean. How much of the data would remain untouched?
Ans:
It is given that the data is spread across mean that is the data is spread across an average. So, we can presume that it is a normal distribution. In a normal distribution, about 68% of data lies in 1 standard deviation from averages like mean, mode or median. That means about 32% of the data remains uninfluenced by missing values.
40.Is a high variance in data good or bad?
Ans:
Higher variance directly means that the data spread is big and the feature has a variety of data. Usually, high variance in a feature is seen as not so good quality.
41.If your dataset is suffering from high variance, how would you handle it?
Ans:
For datasets with high variance, we could use the bagging algorithm to handle it. Bagging algorithm splits the data into subgroups with sampling replicated from random data. After the data is split, random data is used to create rules using a training algorithm. Then we use a polling technique to combine all the predicted outcomes of the model.
42.A data set is given to you about utilities fraud detection. You have built a classifier model and achieved a performance score of 98.5%. Is this a good model? If yes, justify. If not, what can you do about it?
Ans:
Data set about utilities fraud detection is not balanced enough i.e. imbalanced. In such a data set, accuracy score cannot be the measure of performance as it may only predict the majority class label correctly but in this case our point of interest is to predict the minority label. But often minorities are treated as noise and ignored. So, there is a high probability of misclassification of the minority label as compared to the majority label. For evaluating the model performance in case of imbalanced data sets, we should use Sensitivity (True Positive rate) or Specificity (True Negative rate) to determine class label wise performance of the classification model. If the minority class label’s performance is not so good, we could do the following:
We can use under sampling or over sampling to balance the data.
We can change the prediction threshold value.
We can assign weights to labels such that the minority class labels get larger weights.
We could detect anomalies.
43.Explain the handling of missing or corrupted values in the given dataset.
Ans:
An easy way to handle missing values or corrupted values is to drop the corresponding rows or columns. If there are too many rows or columns to drop then we consider replacing the missing or corrupted values with some new value.
Identifying missing values and dropping the rows or columns can be done by using IsNull() and dropna( ) functions in Pandas. Also, the Fillna() function in Pandas replaces the incorrect values with the placeholder value.
44.What is a Time series?
Ans:
A Time series is a sequence of numerical data points in successive order. It tracks the movement of the chosen data points, over a specified period of time and records the data points at regular intervals. Time series doesn’t require any minimum or maximum time input. Analysts often use Time series to examine data according to their specific requirement.
45.What is a Box-Cox transformation?
Ans:
Box-Cox transformation is a power transform which transforms non-normal dependent variables into normal variables as normality is the most common assumption made while using many statistical techniques. It has a lambda parameter which when set to 0 implies that this transform is equivalent to log-transform. It is used for variance stabilization and also to normalize the distribution.
46.What is the difference between stochastic gradient descent (SGD) and gradient descent (GD)?
Ans:
Gradient Descent and Stochastic Gradient Descent are the algorithms that find the set of parameters that will minimize a loss function.
The difference is that in Gradient Descend, all training samples are evaluated for each set of parameters. While in Stochastic Gradient Descent only one training sample is evaluated for the set of parameters identified.
47.What is the exploding gradient problem while using back propagation technique?
Ans:
When large error gradients accumulate and result in large changes in the neural network weights during training, it is called the exploding gradient problem. The values of weights can become so large as to overflow and result in NaN values. This makes the model unstable and the learning of the model to stall just like the vanishing gradient problem.
48.Can you mention some advantages and disadvantages of decision trees?
Ans:
The advantages of decision trees are that they are easier to interpret, are nonparametric and hence robust to outliers, and have relatively few parameters to tune.
On the other hand, the disadvantage is that they are prone to overfitting.
49.Explain the differences between Random Forest and Gradient Boosting machines.
Ans:
Random forests are a significant number of decision trees pooled using averages or majority rules at the end. Gradient boosting machines also combine decision trees but at the beginning of the process unlike Random forests. Random forest creates each tree independent of the others while gradient boosting develops one tree at a time. Gradient boosting yields better outcomes than random forests if parameters are carefully tuned but it’s not a good option if the data set contains a lot of outliers/anomalies/noise as it can result in overfitting of the model.Random forests perform well for multiclass object detection. Gradient Boosting performs well when there is data which is not balanced such as in real time risk assessment.
50.What is a confusion matrix and why do you need it?
Ans:
Confusion matrix (also called the error matrix) is a table that is frequently used to illustrate the performance of a classification model i.e. classifier on a set of test data for which the true values are well-known.
It allows us to visualize the performance of an algorithm/model. It allows us to easily identify the confusion between different classes. It is used as a performance measure of a model/algorithm.
A confusion matrix is known as a summary of predictions on a classification model. The number of right and wrong predictions were summarized with count values and broken down by each class label. It gives us information about the errors made through the classifier and also the types of errors made by a classifier.

Best Hands-on Practical Machine Learning Course to Build Your Skills
Weekday / Weekend BatchesSee Batch Details51.What’s a Fourier transform?
Ans:
Fourier Transform is a mathematical technique that transforms any function of time to a function of frequency. The Fourier transform is closely related to the Fourier series. It takes any time-based pattern for input and calculates the overall cycle offset, rotation speed and strength for all possible cycles. Fourier transform is best applied to waveforms since it has functions of time and space. Once a Fourier transform applied on a waveform, it gets decomposed into a sinusoid.
52.What do you mean by Associative Rule Mining (ARM)?
Ans:
Associative Rule Mining is one of the techniques to discover patterns in data like features (dimensions) which occur together and features (dimensions) which are correlated. It is mostly used in Market-based Analysis to find how frequently an itemset occurs in a transaction. Association rules have to satisfy minimum support and minimum confidence at the very same time. Association rule generation generally comprised of two different steps:
“A min support threshold is given to obtain all frequent item-sets in a database.”
“A min confidence constraint is given to these frequent item-sets in order to form the association rules.”
Support is a measure of how often the “item set” appears in the data set and Confidence is a measure of how often a particular rule has been found to be true.
53.What is Marginalisation? Explain the process.
Ans:
Marginalisation is summing the probability of a random variable X given joint probability distribution of X with other variables. It is an application of the law of total probability.
- P(X=x) = ∑YP(X=x,Y)
Given the joint probability P(X=x,Y), we can use marginalization to find P(X=x). So, it is to find distribution of one random variable by exhausting cases on other random variables.
54.Explain the phrase “Curse of Dimensionality”.
Ans:
The Curse of Dimensionality refers to the situation when your data has too many features.
The phrase is used to express the difficulty of using brute force or grid search to optimize a function with too many inputs.
It can also refer to several other issues like:
If we have more features than observations, we have a risk of overfitting the model.
When we have too many features, observations become harder to cluster. Too many dimensions cause every observation in the dataset to appear equidistant from all others and no meaningful clusters can be formed.
Dimensionality reduction techniques like PCA come to the rescue in such cases.
55.What is the Principle Component Analysis?
Ans:
The idea here is to reduce the dimensionality of the data set by reducing the number of variables that are correlated with each other. Although the variation needs to be retained to the maximum extent.
The variables are transformed into a new set of variables that are known as Principal Components’. These PCs are the eigenvectors of a covariance matrix and therefore are orthogonal.
56.Why is rotation of components so important in Principle Component Analysis (PCA)?
Ans:
Rotation in PCA is very important as it maximizes the separation within the variance obtained by all the components because of which interpretation of components would become easier. If the components are not rotated, then we need extended components to describe variance of the components.
57.What are outliers? Mention three methods to deal with outliers.
Ans:
A data point that is considerably distant from the other similar data points is known as an outlier. They may occur due to experimental errors or variability in measurement. They are problematic and can mislead a training process, which eventually results in longer training time, inaccurate models, and poor results.
The three methods to deal with outliers are:
Univariate method – looks for data points having extreme values on a single variable
Multivariate method – looks for unusual combinations on all the variables
Minkowski error – reduces the contribution of potential outliers in the training process
58.What is the difference between regularization and normalisation?
Ans:
Normalisation adjusts the data; regularisation adjusts the prediction function. If your data is on very different scales (especially low to high), you would want to normalise the data. Alter each column to have compatible basic statistics. This can be helpful to make sure there is no loss of accuracy. One of the goals of model training is to identify the signal and ignore the noise if the model is given free rein to minimize error, there is a possibility of suffering from overfitting. Regularization imposes some control on this by providing simpler fitting functions over complex ones.
59.Explain the difference between Normalization and Standardization.
Ans:
Normalization and Standardization are the two very popular methods used for feature scaling. Normalization refers to re-scaling the values to fit into a range of [0,1]. Standardization refers to re-scaling data to have a mean of 0 and a standard deviation of 1 (Unit variance). Normalization is useful when all parameters need to have the identical positive scale however the outliers from the data set are lost. Hence, standardization is recommended for most applications.
60.List the most popular distribution curves .
Ans:
The most popular distribution curves are as follows- Bernoulli Distribution, Uniform Distribution, Binomial Distribution, Normal Distribution, Poisson Distribution, and Exponential Distribution.
61.What is meant by Bernoulli Distribution
Ans:
Bernoulli Distribution can be used to check if a team will win a championship or not, a newborn child is either male or female, you either pass an exam or not, etc.
62.What is meant by Uniform Distribution
Ans:
Uniform Distribution is a probability distribution that has a constant probability. Rolling a single dice is one example because it has a fixed number of outcomes.
63.What is meant by Binomial Distribution
Ans:
Binomial Distribution is a probability with only two possible outcomes, the prefix ‘bi’ means two or twice. An example of this would be a coin toss. The outcome will either be heads or tails.
64.What is meant by Normal Distribution
Ans:
Normal Distribution describes how the values of a variable are distributed. It is typically a symmetric distribution where most of the observations cluster around the central peak. The values further away from the mean taper off equally in both directions. An example would be the height of students in a classroom.
65.What is meant by Poisson Distribution
Ans:
Poisson Distribution helps predict the probability of certain events happening when you know how often that event has occurred. It can be used by businessmen to make forecasts about the number of customers on certain days and allows them to adjust supply according to the demand.
66.What is meant by Exponential Distribution
Ans:
Exponential Distribution is concerned with the amount of time until a specific event occurs. For example, how long a car battery would last, in months.
67.How do we check the normality of a data set or a feature?
Ans:
Visually, we can check it using plots. There is a list of Normality checks, they are as follow:
- Shapiro-Wilk W Test
- Anderson-Darling Test
- Martinez-Iglewicz Test
- Kolmogorov-Smirnov Test
- D’Agostino Skewness Test
68.What is Linear Regression?
Ans:
Linear Function can be defined as a Mathematical function on a 2D plane as, Y =Mx +C, where Y is a dependent variable and X is Independent Variable, C is Intercept and M is slope and same can be expressed as Y is a Function of X or Y = F(x).
At any given value of X, one can compute the value of Y, using the equation of Line. This relation between Y and X, with a degree of the polynomial as 1 is called Linear Regression.
In Predictive Modeling, LR is represented as Y = Bo + B1x1 + B2x2
The value of B1 and B2 determines the strength of the correlation between features and the dependent variable.
Example: Stock Value in $ = Intercept + (+/-B1)*(Opening value of Stock) + (+/-B2)*(Previous Day Highest value of Stock)
69.Differentiate between regression and classification.
Ans:
Regression and classification are categorized under the same umbrella of supervised machine learning. The main difference between them is that the output variable in the regression is numerical (or continuous) while that for classification is categorical (or discrete).
Example: To predict the definite Temperature of a place is a Regression problem whereas predicting whether the day will be Sunny cloudy or there will be rain is a case of classification.
70.What is target imbalance? How do we fix it? A scenario where you have performed target imbalance on data. Which metrics and algorithms do you find suitable to input this data onto?
Ans:
If you have categorical variables as the target when you cluster them together or perform a frequency count on them if there are certain categories which are more in number as compared to others by a very significant number. This is known as the target imbalance.
Example: Target column – 0,0,0,1,0,2,0,0,1,1 [0s: 60%, 1: 30%, 2:10%] 0 are in majority. To fix this, we can perform up-sampling or down-sampling. Before fixing this problem let’s assume that the performance metrics used was confusion metrics. After fixing this problem we can shift the metric system to AUC: ROC. Since we added/deleted data [up sampling or downsampling], we can go ahead with a stricter algorithm like SVM, Gradient boosting or ADA boosting.
71.List all assumptions for data to be met before starting with linear regression.
Ans:
Before starting linear regression, the assumptions to be met are as follow:
- Linear relationship
- Multivariate normality
- No or little multicollinearity
- No auto-correlation
- Homoscedasticity
72.When does the linear regression line stop rotating or finds an optimal spot where it is fitted on data?
Ans:
A place where the highest RSquared value is found, is the place where the line comes to rest. RSquared represents the amount of variance captured by the virtual linear regression line with respect to the total variance captured by the dataset.
73.Why is logistic regression a type of classification technique and not a regression? Name the function it is derived from?
Ans:
Since the target column is categorical, it uses linear regression to create an odd function that is wrapped with a log function to use regression as a classifier. Hence, it is a type of classification technique and not a regression. It is derived from cost function.
74.What could be the issue when the beta value for a certain variable varies way too much in each subset when regression is run on different subsets of the given dataset?
Ans:
Variations in the beta values in every subset implies that the dataset is heterogeneous. To overcome this problem, we can use a different model for each of the clustered subsets of the dataset or use a non-parametric model such as decision trees.
75.What does the term Variance Inflation Factor mean?
Ans:
Variation Inflation Factor (VIF) is the ratio of variance of the model to variance of the model with only one independent variable. VIF gives the estimate of volume of multicollinearity in a set of many regression variables.
VIF = Variance of model Variance of model with one independent variable
76.Which machine learning algorithm is known as the lazy learner and why is it called so?
Ans:
KNN is a Machine Learning algorithm known as a lazy learner. K-NN is a lazy learner because it doesn’t learn any machine learnt values or variables from the training data but dynamically calculates distance every time it wants to classify, hence memorises the training dataset instead.
77.Is it possible to use KNN for image processing?
Ans:
Yes, it is possible to use KNN for image processing. It can be done by converting the 3-dimensional image into a single-dimensional vector and using the same as input to KNN.
78.Differentiate between K-Means and KNN algorithms?
Ans:
KNN is Supervised Learning where-as K-Means is Unsupervised Learning. With KNN, we predict the label of the unidentified element based on its nearest neighbour and further extend this approach for solving classification/regression-based problems.
K-Means is Unsupervised Learning, where we don’t have any Labels present, in other words, no Target Variables and thus we try to cluster the data based upon their coordinates and try to establish the nature of the cluster based on the elements filtered for that cluster.
79.How does the SVM algorithm deal with self-learning?
Ans:
SVM has a learning rate and expansion rate which takes care of this. The learning rate compensates or penalises the hyperplanes for making all the wrong moves and expansion rate deals with finding the maximum separation area between classes.
80.What are Kernels in SVM? List popular kernels used in SVM along with a scenario of their applications.
Ans:
The function of the kernel is to take data as input and transform it into the required form. A few popular Kernels used in SVM are as follows: RBF, Linear, Sigmoid, Polynomial, Hyperbolic, Laplace, etc.
81.What is Kernel Trick in an SVM Algorithm?
Ans:
Kernel Trick is a mathematical function which when applied on data points, can find the region of classification between two different classes. Based on the choice of function, be it linear or radial, which purely depends upon the distribution of data, one can build a classifier.
82.What are ensemble models? Explain how ensemble techniques yield better learning as compared to traditional classification ML algorithms?
Ans:
Ensemble is a group of models that are used together for prediction both in classification and regression class. Ensemble learning helps improve ML results because it combines several models. By doing so, it allows a better predictive performance compared to a single model.
They are superior to individual models as they reduce variance, average out biases, and have lesser chances of overfitting.
83.What are overfitting and underfitting? Why does the decision tree algorithm suffer often with overfitting problems?
Ans:
Overfitting is a statistical model or machine learning algorithm which captures the noise of the data. Underfitting is a model or machine learning algorithm which does not fit the data well enough and occurs if the model or algorithm shows low variance but high bias.
In decision trees, overfitting occurs when the tree is designed to perfectly fit all samples in the training data set. This results in branches with strict rules or sparse data and affects the accuracy when predicting samples that aren’t part of the training set.
84.What is OOB error and how does it occur?
Ans:
For each bootstrap sample, there is one-third of data that was not used in the creation of the tree, i.e., it was out of the sample. This data is referred to as out of bag data. In order to get an unbiased measure of the accuracy of the model over test data, out of bag error is used. The out of bag data is passed for each tree is passed through that tree and the outputs are aggregated to give out of bag error. This percentage error is quite effective in estimating the error in the testing set and does not require further cross-validation.
85.Why is boosting a more stable algorithm as compared to other ensemble algorithms?
Ans:
Boosting focuses on errors found in previous iterations until they become obsolete. Whereas in bagging there is no corrective loop. This is why boosting is a more stable algorithm compared to other ensemble algorithms.
86.What are the three stages to build hypotheses or models in machine learning?
Ans:
- Model building
- Model testing
- Applying the model
87.You are given a train data set having 1000 columns and 1 million rows. The data set is based on a classification problem. Your manager has asked you to reduce the dimension of this data so that model computation time can be reduced. Your machine has memory constraints. What would you do? (You are free to make practical assumptions.)
Ans:
Processing a high dimensional data on a limited memory machine is a strenuous task, your interviewer would be fully aware of that. Following are the methods you can use to tackle such situation:
- 1.Since we have lower RAM, we should close all other applications in our machine, including the web browser, so that most of the memory can be put to use.
- 2.We can randomly sample the data set. This means, we can create a smaller data set, let’s say, having 1000 variables and 300000 rows and do the computations.
- 3.To reduce dimensionality, we can separate the numerical and categorical variables and remove the correlated variables. For numerical variables, we’ll use correlation. For categorical variables, we’ll use a chi-square test.
- 4.Also, we can use PCA and pick the components which can explain the maximum variance in the data set.
- 5.Using online learning algorithms like Vowpal Wabbit (available in Python) is a possible option.
- 6.Building a linear model using Stochastic Gradient Descent is also helpful.
- 7.We can also apply our business understanding to estimate which all predictors can impact the response variable. But, this is an intuitive approach, failing to identify useful predictors might result in significant loss of information.
Note: For point 4 & 5, make sure you read about online learning algorithms & Stochastic Gradient Descent. These are advanced methods.
88.Is rotation necessary in PCA? If yes, Why? What will happen if you don’t rotate the components?
Ans:
Yes, rotation (orthogonal) is necessary because it maximizes the difference between variance captured by the component. This makes the components easier to interpret. Not to forget, that’s the motive of doing PCA where we aim to select fewer components (than features) which can explain the maximum variance in the data set. By doing rotation, the relative location of the components doesn’t change, it only changes the actual coordinates of the points.
If we don’t rotate the components, the effect of PCA will diminish and we’ll have to select more number of components to explain variance in the data set.
89.You are given a data set. The data set has missing values which spread along 1 standard deviation from the median. What percentage of data would remain unaffected? Why?
Ans:
This question has enough hints for you to start thinking! Since, the data is spread across the median, let’s assume it’s a normal distribution. We know, in a normal distribution, ~68% of the data lies in 1 standard deviation from mean (or mode, median), which leaves ~32% of the data unaffected. Therefore, ~32% of the data would remain unaffected by missing values.
90.You are given a data set on cancer detection. You’ve built a classification model and achieved an accuracy of 96%. Why shouldn’t you be happy with your model performance? What can you do about it?
Ans:
If you have worked on enough data sets, you should deduce that cancer detection results in imbalanced data. In an imbalanced data set, accuracy should not be used as a measure of performance because 96% (as given) might only be predicting majority class correctly, but our class of interest is minority class (4%) which is the people who actually got diagnosed with cancer. Hence, in order to evaluate model performance, we should use Sensitivity (True Positive Rate), Specificity (True Negative Rate), F measure to determine class wise performance of the classifier. If the minority class performance is found to to be poor, we can undertake the following steps:
- 1.We can use undersampling, oversampling or SMOTE to make the data balanced.
- 2.We can alter the prediction threshold value by doing probability calibration and finding an optimal threshold using the AUC-ROC curve.
- 3.We can assign weight to classes such that the minority classes gets larger weight.
- 4.We can also use anomaly detection.
91.Why is naive Bayes so ‘naive’ ?
Ans:
naive Bayes is so ‘naive’ because it assumes that all of the features in a data set are equally important and independent. As we know, these assumptions are rarely true in real world scenarios.
92.Explain prior probability, likelihood and marginal likelihood in context of naiveBayes algorithm?
Ans:
Prior probability is nothing but, the proportion of dependent (binary) variable in the data set. It is the closest guess you can make about a class, without any further information. For example: In a data set, the dependent variable is binary (1 and 0). The proportion of 1 (spam) is 70% and 0 (not spam) is 30%. Hence, we can estimate that there are 70% chances that any new email would be classified as spam.
Likelihood is the probability of classifying a given observation as 1 in presence of some other variable. For example: The probability that the word ‘FREE’ is used in a previous spam message is likely. Marginal likelihood is, the probability that the word ‘FREE’ is used in any message.
93.You are working on a time series data set. Your manager has asked you to build a high accuracy model. You start with the decision tree algorithm, since you know it works fairly well on all kinds of data. Later, you tried a time series regression model and got higher accuracy than the decision tree model. Can this happen? Why?
Ans:
Time series data is known to possess linearity. On the other hand, a decision tree algorithm is known to work best to detect non – linear interactions. The reason why the decision tree failed to provide robust predictions was because it couldn’t map the linear relationship as good as a regression model did. Therefore, we learned that a linear regression model can provide robust prediction given the data set satisfies its linearity assumptions.
94.You are assigned a new project which involves helping a food delivery company save more money. The problem is, the company’s delivery team isn’t able to deliver food on time. As a result, their customers get unhappy. And, to keep them happy, they end up delivering food for free. Which machine learning algorithm can save them?
Ans:
You might have started hopping through the list of ML algorithms in your mind. But, wait! Such questions are asked to test your machine learning fundamentals.
This is not a machine learning problem. This is a route optimization problem. A machine learning problem consist of three things:
- 1.There exists a pattern.
- 2.You cannot solve it mathematically (even by writing exponential equations).
- 3.You have data on it.
Always look for these three factors to decide if machine learning is a tool to solve a particular problem.
95.You came to know that your model is suffering from low bias and high variance. Which algorithm should you use to tackle it? Why?
Ans:
Low bias occurs when the model’s predicted values are near to actual values. In other words, the model becomes flexible enough to mimic the training data distribution. While it sounds like a great achievement, but not to forget, a flexible model has no generalization capabilities. It means, when this model is tested on an unseen data, it gives disappointing results.
In such situations, we can use a bagging algorithm (like random forest) to tackle high variance problems. Bagging algorithms divides a data set into subsets made with repeated randomized sampling. Then, these samples are used to generate a set of models using a single learning algorithm. Later, the model predictions are combined using voting (classification) or averaging (regression).
Also, to combat high variance, we can:
- 1.Use regularization technique, where higher model coefficients get penalized, hence lowering model complexity.
- 2.Use top n features from variable importance charts. Maybe, with all the variables in the data set, the algorithm is having difficulty in finding the meaningful signal.
96.You are given a data set. The data set contains many variables, some of which are highly correlated and you know about it. Your manager has asked you to run PCA. Would you remove correlated variables first? Why?
Ans:
Chances are, you might be tempted to say No, but that would be incorrect. Discarding correlated variables have a substantial effect on PCA because, in presence of correlated variables, the variance explained by a particular component gets inflated.
For example: You have 3 variables in a data set, of which 2 are correlated. If you run PCA on this data set, the first principal component would exhibit twice the variance than it would exhibit with uncorrelated variables. Also, adding correlated variables lets PCA put more importance on those variables, which is misleading.
97.After spending several hours, you are now anxious to build a high accuracy model. As a result, you build 5 GBM models, thinking a boosting algorithm would do the magic. Unfortunately, neither of the models could perform better than benchmark score. Finally, you decided to combine those models. Though, ensembled models are known to return high accuracy, but you are unfortunate. Where did you miss?
Ans:
As we know, ensemble learners are based on the idea of combining weak learners to create strong learners. But, these learners provide superior result when the combined models are uncorrelated. Since, we have used 5 GBM models and got no accuracy improvement, suggests that the models are correlated. The problem with correlated models is, all the models provide the same information.
For example: If model 1 has classified User1122 as 1, there are high chances model 2 and model 3 would have done the same, even if its actual value is 0. Therefore, ensemble learners are built on the premise of combining weak uncorrelated models to obtain better predictions.
98.How is True Positive Rate and Recall related? Write the equation.
Ans:
True Positive Rate = Recall. Yes, they are equal having the formula (TP/TP + FN).
99.You have built a multiple regression model. Your model R² isn’t as good as you wanted. For improvement, if you remove the intercept term, your model R² becomes 0.8 from 0.3. Is it possible? How?
Ans:
Yes, it is possible. We need to understand the significance of the intercept term in a regression model. The intercept term shows model prediction without any independent variable i.e. mean prediction. The formula of R² = 1 – ∑(y – y´)²/∑(y – y mean)² where y´ is predicted value.
When intercept term is present, R² value evaluates your model wrt. to the mean model. In absence of intercept term (y mean), the model can make no such evaluation, with large denominator, ∑(y – y´)²/∑(y)² equation’s value becomes smaller than actual, resulting in higher R².
100.After analyzing the model, your manager has informed you that your regression model is suffering from multicollinearity. How would you check if he’s true? Without losing any information, can you still build a better model?
Ans:
To check multicollinearity, we can create a correlation matrix to identify & remove variables having correlation above 75% (deciding a threshold is subjective). In addition, we can use calculating VIF (variance inflation factor) to check the presence of multicollinearity. VIF value <= 4 suggests no multicollinearity whereas a value of >= 10 implies serious multicollinearity. Also, we can use tolerance as an indicator of multicollinearity.
But, removing correlated variables might lead to loss of information. In order to retain those variables, we can use penalized regression models like ridge or lasso regression. Also, we can add some random noise in correlated variables so that the variables become different from each other. But, adding noise might affect the prediction accuracy, hence this approach should be carefully used.
101.When is Ridge regression favorable over Lasso regression?
Ans:
You can quote ISLER’s authors Hastie, Tibshirani who asserted that, in presence of few variables with medium / large sized effect, use lasso regression. In presence of many variables with small / medium sized effect, use ridge regression.
Conceptually, we can say, lasso regression (L1) does both variable selection and parameter shrinkage, whereas Ridge regression only does parameter shrinkage and end up including all the coefficients in the model. In presence of correlated variables, ridge regression might be the preferred choice. Also, ridge regression works best in situations where the least square estimates have higher variance. Therefore, it depends on our model objective.
102.Rise in global average temperature led to a decrease in the number of pirates around the world. Does that mean that the decrease in the number of pirates caused climate change?
Ans:
After reading this question, you should have understood that this is a classic case of “causation and correlation”. No, we can’t conclude that the decrease in the number of pirates caused climate change because there might be other factors (lurking or confounding variables) influencing this phenomenon.
Therefore, there might be a correlation between global average temperature and number of pirates, but based on this information we can’t say that pirates died because of the rise in global average temperature.
103.While working on a data set, how do you select important variables? Explain your methods.
Ans:
Following are the methods of variable selection you can use:
- 1.Remove the correlated variables prior to selecting important variables
- 2.Use linear regression and select variables based on p values
- 3.Use Forward Selection, Backward Selection, Stepwise Selection
- 4.Use Random Forest, Xgboost and plot variable importance chart
- 5.Use Lasso Regression
- 6.Measure information gain for the available set of features and select top n features accordingly.
104.Is it possible to capture the correlation between continuous and categorical variables? If yes, how?
Ans:
Yes, we can use ANCOVA (analysis of covariance) technique to capture association between continuous and categorical variables.
105.Both being tree based algorithms, how is random forest different from Gradient boosting algorithm (GBM)?
Ans:
The fundamental difference is, random forest uses bagging technique to make predictions. GBM uses boosting techniques to make predictions.
In bagging technique, a data set is divided into n samples using randomized sampling. Then, using a single learning algorithm a model is built on all samples. Later, the resultant predictions are combined using voting or averaging. Bagging is done in parallel. In boosting, after the first round of predictions, the algorithm weighs misclassified predictions higher, such that they can be corrected in the succeeding rond. This sequential process of giving higher weights to misclassified predictions continue until a stopping criterion is reached.
Random forest improves model accuracy by reducing variance (mainly). The trees grown are uncorrelated to maximize the decrease in variance. On the other hand, GBM improves accuracy by reducing both bias and variance in a model.