

Covariance Vs Correlation | Know the complete difference
Last updated on 28th Jan 2023, Artciles, Blog
- In this article you will get
- What is Covariance?
- Application Of Covariance
- What is Correlation?
- Methods of calculating correlation
- Applications of Correlation
- Correlation Vs Covariance
- Similarities: Covariance vs Correlation
What is Covariance?
A change in one variable reflects a change in the other, which is referred to statistically as covariance. Covariance describes a systematic link between two random variables.A negative number for the covariance value indicates a negative association, whereas a positive value indicates a positive link. The covariance value can vary from – to +.
The connection is more dependent the higher this value is. A positive figure for positive covariance indicates a direct link.An inverse link between the two variables is shown by a negative value, which signifies negative covariance. Covariance is excellent at identifying the sort of connection, but it’s horrible at determining its size.
Let Σ(X) and Σ(Y) be the expected values of the variables, the covariance formula can be represented as:
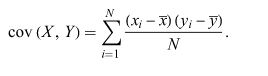
Where,
- xi = data value of x
- yi = data value of y
- x̄ = mean of x
- ȳ = mean of y
- N = number of data values
Application of Covariance
Cholesky decomposition is used to simulate multiple-correlated variable systems. Because a covariance matrix is positive semi-definite, it aids in determining the Cholesky decomposition. The lower matrix’s product with its transpose breaks down the matrix.
Principal component analysis is used to shrink the dimensionality of huge data sets. An eigen decomposition is used to do principal component analysis on the covariance matrix.
What is Correlation?
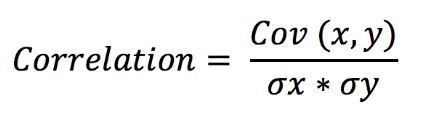
In statistics, correlation is a metric that assesses how closely two or more random variables follow one another. The variables are said to be correlated when, during the study of two variables, an analogous movement of one variable reciprocates the movement of the other variable in some manner. The correlation equation is:
Variables move in the same direction, then it is a positive correlation. Variables are considered to be negatively linked when they move in the opposite way.
There are three forms of correlation:
Simple Correlation:In a simple correlation, the degree of a relationship between two variables is expressed by a single number.
Partial Correlation:This statistical technique reveals the correlation between two variables when the effects of one variable are removed.
Multiple correlation:A statistical method for predicting the value of one variable by using two or more variables.
Methods of calculating correlation
The correlation coefficient may be calculated using a variety of techniques.
Coefficient of correlation:
The most popular technique for calculating the correlation between two variables is this one. It is calculated by multiplying the product of the standard deviations of the two variables by the covariance of the two variables.
Rank correlation coefficient :
When determining the importance of a relationship between two variables, a rank correlation coefficient is used to determine how similar two variables are to one another. It gauges how much one variable’s growth causes the other to decrease.
Coefficient of concurrent deviations:
When there is less requirement for precision and you want to investigate the association in a fairly casual way, you should utilise the coefficient of concurrent deviations.
Applications of Correlation
For three major purposes, a correlation matrix is computed:
When working with enormous volumes of data, finding patterns is the main objective. As a consequence, a correlation matrix is used to analyse the data for patterns and assess how strongly connected the variables are.
To be used for other analyses. Correlation matrices are frequently employed as inputs for exploratory component analysis, confirmatory factor analysis, structural equation models, and linear regression when missing values are excluded pairwise.
As a diagnostic tool for examining other analyses. For instance, a lot of correlations in the case of linear regression point to the unreliability of the linear regression estimates.
Correlation Vs Covariance
Now you will see the differences between Covariance and Correlation.
| Properties | Covariance | Correlation |
|---|---|---|
| Definition | Covariance is a measure of how reliant two random variables are on one another. Greater reliance is indicated by a higher number. | A statistical metric called correlation shows how closely two variables are connected to one another. |
| Values | The value of covariance lies in the range of -∞ and +∞. | Correlation is limited to values between the range -1 and +1. |
| Change in scale | Affects covariance. | Does not affect the correlation. |
| Unit-free measure | No. | Yes. |
Similarities: Covariance vs Correlation
Both correlation and covariance only track the linear connections between two variables. Accordingly, the covariance is likewise 0 when the correlation coefficient is zero. Additionally, the locational shift has no impact on the correlation or covariance metrics.
Covariance and correlation are both useful tools for determining the relationship between two variables, but because correlation is unaffected by scale changes, it is chosen over covariance.