
- Financial Performance – A Complete Tutorial
- How Six Sigma Principles Can Progress Your Productivity – Tutorial
- Google Analytics Pro Tutorial | Fast Track your Career
- Activity-Based Costing Tutorial | Know about Definition, Process, & Example
- Create a workbook in Excel Tutorial | Learn in 1 Day
- Excel ROUNDUP Formula Tutorial | Learn with Functions & Examples
- Business Analytics with Excel Tutorial | Learn In 1 Day
- SAP Tutorial – Free Guide Tutorial & REAL-TIME Examples
- IBM SPSS Statistics Tutorial: Getting Started with SPSS
- SAP Security Tutorial | Basics & Definition for Beginners
- SAP Simple Finance Tutorial | Ultimate Guide to Learn [Updated]
- SAP FIORI Tutorial | Learn in 1 Day FREE
- Introduction to Business Analytics with R Tutorial | Ultimate Guide to Learn
- Tableau Desktop Tutorial | Step by Step resource guide to learn Tableau
- Implementing SAP BW on SAP HANA | A Complete Guide
- SAP HANA Administration | Free Guide Tutorial & REAL-TIME Examples
- Tableau API Tutorial | Get Started with Tools, REST Basics
- SAP FICO ( Financial Accounting and Controlling ) Tutorial | Complete Guide
- Alteryx Tutorial | Step by Step Guide for Beginners
- Getting started with Amazon Athena Tutorial – Serverless Interactive | The Ultimate Guide
- Introduction to Looker Tutorial – A Complete Guide for Beginners
- Sitecore Tutorials | For Beginners Learn in 1 Day FREE |Ultimate Guide to Learn [UPDATED]
- Adobe Analytics Tutorial – The Ultimate Student Guide
- Splunk For Beginners – Learn Everything About Splunk with Free Online Tutorial
- An Overview of SAP HANA Tutorial: Learn in 1 Day FREE
- Statistical Package for the Social Sciences – SPSS Tutorial: The Ultimate Guide
- Splunk For Beginners – Learn Everything About Splunk with Free Online Tutorial
- Pentaho Tutorial – Best Resources To Learn in 1 Day | CHECK OUT
- Statistical Package for the Social Sciences – SPSS Tutorial: The Ultimate Guide
- An Overview of SAP HANA Tutorial: Learn in 1 Day FREE
- Spotfire Tutorial for Beginners | Quickstart – MUST- READ
- JasperReports Tutorial: Ultimate Guide to Learn [BEST & NEW]
- Charts and Tables – Qlikview Tutorial – Complete Guide
- TIBCO Business Works | Tutorial for Beginners – Learn From Home
- Cognos TM1 Tutorial : Learn Cognos from Experts
- Kibana
- Power BI Desktop Tutorial
- Tableau Tutorial
- SSAS Tutorial
- Creating Tableau Dashboards
- MDX Tutorial
- Tableau Cheat Sheet
- Analytics Tutorial
- Lean Maturity Matrix Tutorial
- MS Excel Tutorial
- Business Analysis Certification Levels & Their Requirements Tutorial
- Solution Assessment and Validation Tutorial
- Lean Six Sigma Tutorial
- Enterprise Analysis Tutorial
- Create Charts and Objects in Excel 2013 Tutorial
- Msbi Tutorial
- MicroStrategy Tutorial
- Advanced SAS Tutorial
- OBIEE Tutorial
- Tableau Server Tutorial
- OBIA Tutorial
- Business Analyst Tutorial
- Cognos Tutorial
- Qlik Sense Tutorial
- SAP-Bussiness Objects Tutorial
- SAS Tutorial
- PowerApps Tutorial

Creating Tableau Dashboards
Last updated on 10th Oct 2020, Blog, Business Analytics, Tutorials
Tableau is the traditional BI tool that makes rapid results in useful information. It provides an easy way to use applications for fast analytics and visualization. There are so many choices to present our work outside. For data visualizations, we pick up the different charts to convey the results. Tableau workbook contains sheets and dashboards. Sheets are for creating individual visualizations. the dashboard is for combining multiple sheets. On the other hand, Story points are a collection of worksheets and dashboards that work together to link data. Tableau has some added features like Tableau desktop, Actions, Aggregate dimensions.
A tableau is a software tool that was first introduced back in 2003 in Seattle, Washington, United States. If we want to use any Business Intelligence tool visually analyzing the data, the first software which comes to our mind is Tableau. Tableau helps the user to create and distribute an interactive dashboard. It is interesting to know that this interactive creatable dashboard is shareable too. Tableau can be connected to files, relational and Big Data sources to acquire and process data.
This tableau software easily allows data blending along with real-time collaboration, which additionally provides it the feature of uniqueness. It is generally used by academic researchers, businesses, and many government organizations for visual data analysis.
Subscribe For Free Demo
Error: Contact form not found.
Tableau Dashboard
In general, the dashboard is a high-level business data view where the reports are originated. Dashboarding in tableau gives high performance and allows non- technical users to access and use the data with creative and real-time visualization. The dashboard is a collection of worksheets allows analyzing multiple views at once. The dashboard consists of size, sheets, objects, tiled, dashboard (where we can see the device preview).
Any dashboard that is built in Tableau public or desktop can be published for public consumption on the web. And when you distribute the worksheets on the cloud privately Tableau Server is required with proper licenses.
Types of Dashboard are
- 1. Explanatory Dashboard –They are static.
- 2. Exploratory Dashboard –They are interactive.
- 3. Explanatory/ Exploratory Dashboard – Includes both annotations and interactive controls.
- 4. Story Telling dashboards – Convey series of events.
What is the Tableau Dashboard?
Dashboard actions (provide flexible interactivity) are the key features. They allow the worksheet to work outside the domain of the view. There are 3 types of actions: Filter actions, Highlight actions, URL actions.
Layout (automatically resizes the objects) and size portion provide various ways of interacting and customizing the dashboard.
Web pages can be embedded by the dragging web page tool from the left side. The hyperlink is available on the dashboard.
Steps for creating a dashboard are:
- Select a metric
- Visual Presentation
- Design
- Refine
- Publish
There is a number of methodologies in tableau dashboard are:
Geography – centered dashboards, time- centered, guided analytics, ad-hoc- investigation.
Understanding Tableau Dashboard?
So we now well know what a dashboard is. A tableau dashboard gives us the gist of various worksheets it contains ( and typically mapped for dashboard ) all consolidated at a single place. A dashboard a perfect page where you can get a complete view of different worksheets at a single glance in spite of hoping each and different worksheets one by one.
What one can do with Tableau Dashboard?
The following are the various things for which users can use Tableau and indeed Tableau dashboard. Let us read each one by one.
Speed of Analysis of Data – As it is quite easy to build a Tableau dashboard, and does not require any high level of expertise one can use it analyzing of data. Not only it will help for analyzing data but it also provides it in a rapid manner.
Self-Reliant – As Tableau dashboard is self-reliant and does not require complex setup, hence dashboard could be easily customized so that it contains all the features needed to complete analysis of data
Visual Discovery – Using Tableau dashboard, the user can analyze the data and explore it. Users can add several visual tools like charts, graphs, trends, etc for better visualization of data. All features are available by simply dragging and dropping and hardly requires very little handling
Blending Diverse Data Sets – Tableau Dashboard allows us to blend different raw data sources which may be semi-structured or different relational data without any expensive upfront integration costs. A user need not to know the inner detailing of data communication.
Centralized Data – Since tableau follows a centralized data concept hence we can customize tableau dashboard to view all data in a centralized form
Purpose of Creating a Dashboard in Tableau Desktop
Users like to see some of the views on a single page to save time. While creating a new dashboard, data pane is replaced with a list of worksheets. Having a dashboard supports bi-directional communication between dashboards and source sheets.
Objects can be added by simply dragging them to the dashboard, by default they are added as ‘Tiled’. Tiled objects are the best in adding worksheets to the dashboard. The dashboard can be sized based on the following options: Automatic, Exactly, Range, Pre-sets.
The Layout tab allows setting the dimensions and location of individual components. The sizes are in the pixel. The major component of the dashboard view:
- 1. The list of worksheets
- 2. Dashboard objects to add
- 3. Tiled versus Floating Objects
- 4. Dashboard Layout outline, size control
- 5. The dashboard Itself
Advantages and Disadvantages of Tableau Dashboard
Below are the pros and cons of Tableau dashboard which are as follows:
Advantages
- 1. Centralized Data visualization
- 2. Ease of Implementation
- 3. Quickly create an interactive visualization
- 4. Can show a large amount of data
- 5. Mobile support
- 6. Responsive dashboard
- 7. Descriptive Texts
- 8. KPI’s (Key Performance Indicator) and metrics
- 9. Multiple annotations
- 10. Filters
- 11. Sweet Action
- 12. Multimedia
It is possible to enable a live website in a dashboard by dragging the web Page Dashboard object onto the canvas.
We can add Dynamic Google Maps satellite images to the dashboard by choosing the dashboard file menu, click Actions Then add action button and choose URL. And adding youtube videos to the dashboard (need a spreadsheet to add all the videos). We can add filters to the sheets available in the dashboard to be more interactive by selecting the drop-down options ->all data sources. Applying single filters to all sheets, Dashboard-> actions.
Disadvantages
- No custom visual imports
- Limited column table
- Static and single value parameters
- Limited data preprocessing
- Scaling issue
- Is Expensive
Limitations of the Tableau dashboard
Screen resolution on tableau dashboards gets disturbed if the developer’s resolution is different from end-users’ strengthen dashboards are not responsive. When comparing two bars, the number on the axis can be used to give large differences. If we want to refresh the data we need to re-run the flow.
Interactive Dashboards with Tableau Public
Tableau Public pulls various visualizations together into a single interactive dashboard.
Step 1: Connect to data sources.
Step 2: Move pills to rows and columns to develop new charts.
Step 3: Create a sheet that can act as a filter.
Step 4: Create an interactive dashboard.
Why should we use Tableau Dashboard?
There are many reasons for using a Tableau dashboard. Let us look.
For Centralized data – We can use Tableau dashboard for the better data view. In the tableau dashboard, all data are centralized and are in sync. We can view all data at a single point
Better visual data – All data could be visualized in a better way. It provides several tools which could be used for better understanding of data
For a better representation of data – We can inject several charts and graphs which will enhance the data representation feature of a dashboard. These injected tools help us for better visualization of data.
Why do we need a Tableau Dashboard?
Tableau dashboard could be used in various ways. Tableau is a business analytical tool hence it could be used for business analytics of data, for research purposes of data, for data processing. If our requirement is to visualize our data and represent it in a better way so as to help in better understanding then tableau and indeed tableau dashboard is a great tool. Tableau dashboard is a multi-purpose tool with several uses. It is a great tool if we discuss business analytics of data.
The Difference in Tableau Dashboard And Power BI
There are a few specific differences in Tableau and Power BI which we will discuss below:
Power BI dashboard is a single sheet named as a canvas. They can be used in decision – making by business analytics to gain profits. They are not available for desktop.
With Tableau dashboard, the end goal of the analysis is a good understanding of the data. They get deeper into the outlier without breaking the flow path of analysis. Exploring the data is easy here when compared to power BI.
The current limitations of the Power BI dashboard are themes are not supported using the REST API, in mobile devices. They aren’t built for a slice and dice for data visualizations. Tableau dashboard is very responsive and has great reporting features we can customize it in mobile phones and laptops.
It never has interoperability issues when compared with Power
The cost of Tableau is low when comparing with Power BI as they need additional licenses and the need for IT support. For real-time dashboard building capability and data sharing power, BI cost is low, whereas tableau is priced more for similar features.
How this technology will help in career growth?
The tableau tool has developed a lot since its introduction. Now it contains more and more new features like search by Zip codes, compiling of new dashboards on the web platform itself and can represent varieties of data.
Tableau has improved its tool a lot by adding new features as well as improving included features too. Hence there is lots of demand for this tool and more people are required to use tableau
Download Tableau Desktop
The Free Personal Edition of Tableau Desktop can be downloaded from Tableau Desktop. You need to register with your details to be able to download.
After downloading, the installation is a very straightforward process in which you need to accept the license agreement and provide the target folder for installation. The following steps and screenshots describe the entire setup process.
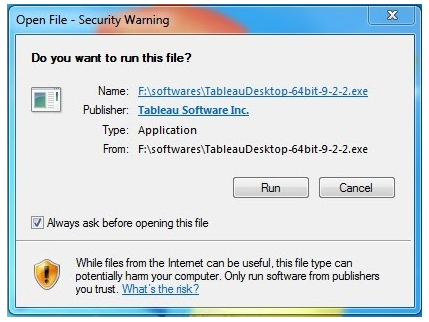
Start the Installation Wizard
Double-click the TableauDesktop-64bit-9-2-2.exe. It will present a screen to allow the installation program to run. Click “Run”.
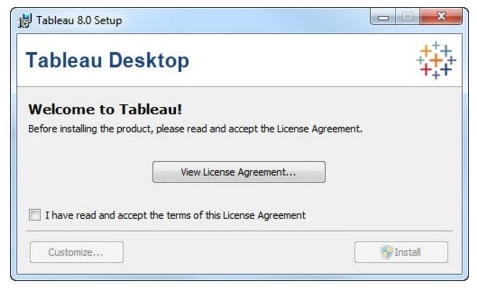
Accept the License Agreement
Read the license agreement and if you agree, choose the “I have read and accept the terms of this license agreement” option. Then, click “Install”.
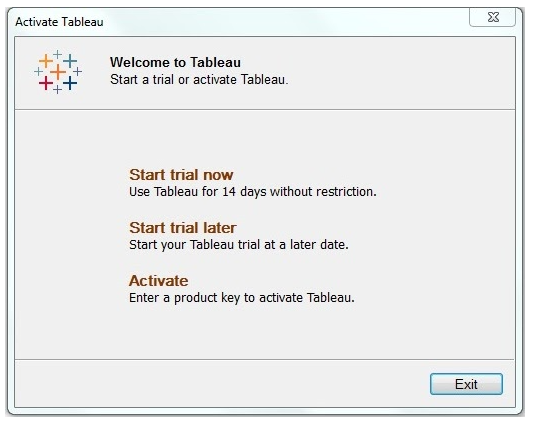
Start Trial
On completion of the installation, the screen prompts you with the option to Start the trial now or later. You may choose to start it now. Also, if you have purchased Tableau then you may enter the License key.
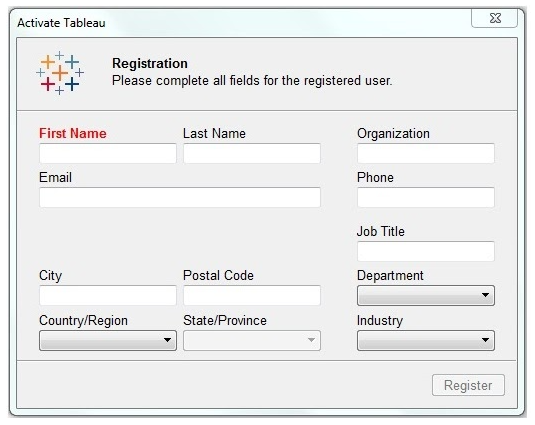
Provide Your Details
Provide your name and organization details. Then, click “Next”.
Registration Complete
The registration completion screen appears. Click “Continue”.
Verify the Installation
You can verify the installation by going to the Windows start menu. Click the Tableau icon. The following screen appears.
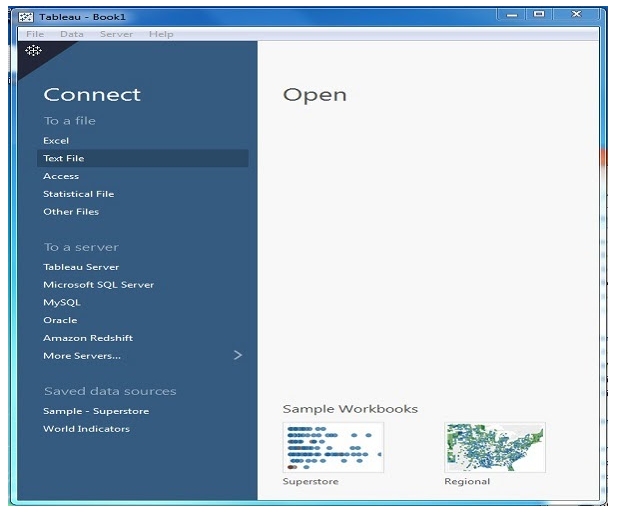
You are now ready to learn Tableau.
Step by Step Create Tableau Dashboard
The following are the step by step explanation to create the best and interactive Tableau Dashboard. Here we will create a dashboard in Tableau Desktop.
Step 1: Click On New Dashboard Button to Create New & empty Tableau Dashboard
- Click on the new dashboard button highlighted in red at the bottom of the bar to open a new dashboard or
- Click on Dashboard on the menu bar and select a new dashboard
- You can change the name of this dashboard as per your choice
Step 2: Select First Sheet that will be a part of your first Tableau Dashboard
- 1. Now drag the sheet you want to include in your dashboard and drop it into dashboard workspace.
- 2. If you are considering a sales data drag and drop the sales map sheet tab.
- 3. You can select your own data for creating a dashboard
Step 3: Drag second Sheet that you want to use in Tableau Dashboard Workspace
- Now select the second sheet you wish to include in your data.
- Suppose now you can add the sales vs profit datasheet
- The order of the sheets is not important
- You can add the sheets in any order you want
Step 4: Now release the mouse button to drop the required chart at the desired location
- 1. Now its time to drop the chart
- 2. When you release the click button of your mouse the chart is dropped in your desired location
Step 5: You can now customize the Tableau Dashboard Sizes by making a selection from size
- You can customize your dashboard as per your wish
- You can resize the chart size
- You can add more sheets in your dashboard
- You can add filters as per your choice
- You can make the sheets fit properly in the dashboard by clicking on the fit option from the toolbar
Step 6: Now you will get interactive Tableau Dashboard
- 1. After all the customization is done your dashboard is finally ready
- 2. You can create many such impeccable and interactive dashboards as per your choice
Step 7: You can show the Dashboard by pressing F7
- Once your dashboard is ready, you can view it in presentation mode
- To enable presentation mode, click on the top button or press F7
Step 8: Present Dashboard on Sheet
- 1. This opens your created dashboard in the presentation mode
- 2. Till now you were working to create your dashboard in edit mode
Step 9: Share Tableau Dashboard with your team members
- Now its time to share your dashboards with other team members
- You can even publish your dashboard on the server, where it can be accessed by everyone
Creating a Dashboard
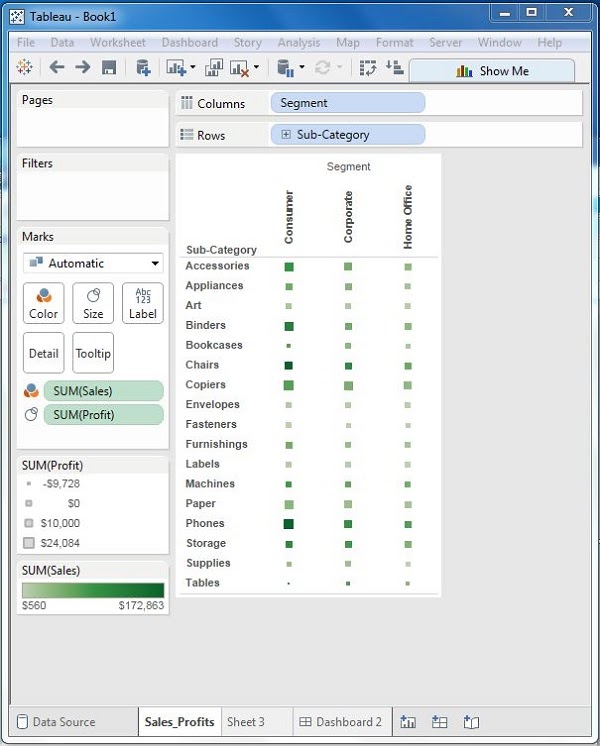
Using the Sample-superstore, plan to create a dashboard showing the sales and profits for different segments and Sub-Category of products across all the states. To achieve this objective, following are the steps.
Step 1 − Create a blank worksheet by using the add worksheet icon located at the bottom of the workbook. Drag the dimension Segment to the columns shelf and the dimension Sub-Category to the Rows Shelf. Drag and drop the measure Sales to the Color shelf and the measure Profit to the Size shelf. This worksheet is referred as the Master worksheet. Right-click and rename this worksheet as Sales_Profits. The following chart appears.
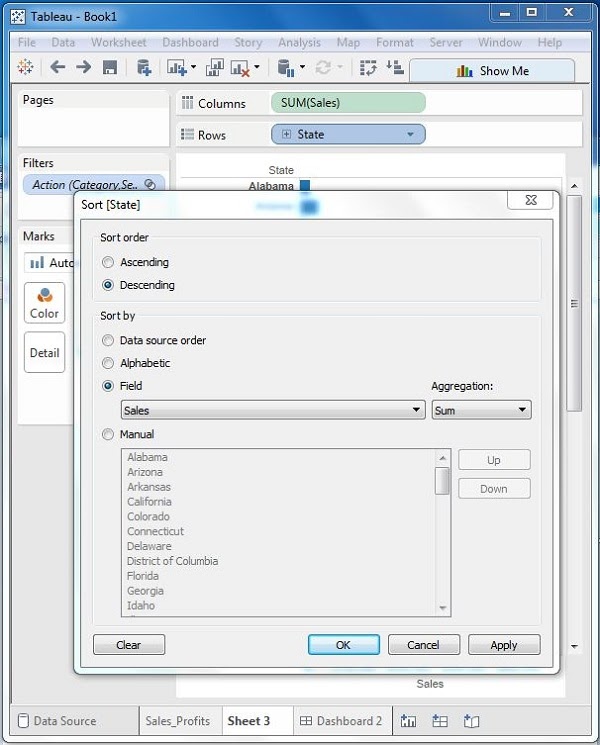
Step 2 − Create another sheet to hold the details of the Sales across the States. For this, drag the dimension State to the Rows shelf and the measure Sales to the Columns shelf as shown in the following screenshot. Next, apply a filter to the State field to arrange the Sales in a descending order. Right-click and rename this worksheet as Sales_state.
Step 3 − Next, create a blank dashboard by clicking the Create New Dashboard link at the bottom of the workbook. Right-click and rename the dashboard as Profit_Dashboard.
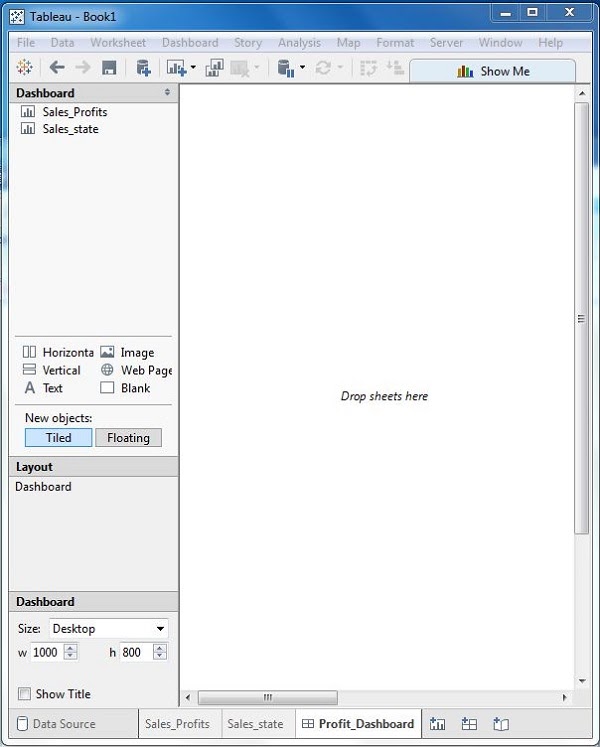
Step 4 − Drag the two worksheets to the dashboard. Near the top border line of Sales Profit worksheet, you can see three small icons. Click the middle one, which shows the prompt Use as Filter on hovering the mouse over it.
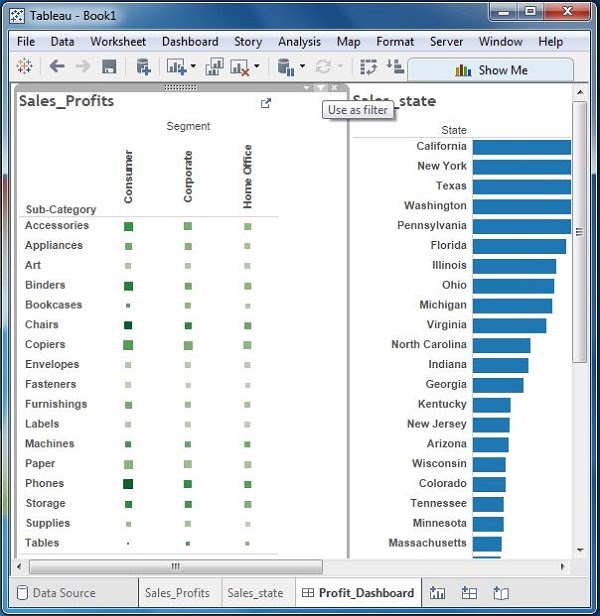
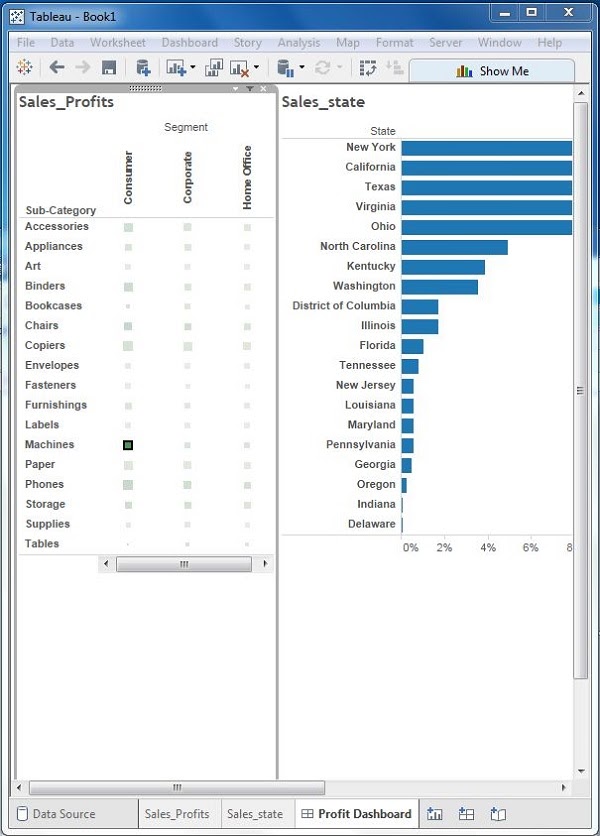
Step 5 − Now in the dashboard, click the box representing Sub-Category named Machines and segment named Consumer.
You can notice that only the states where the sales happened for this amount of profit are filtered out in the right pane named Sales_state. This illustrates how the sheets are linked in a dashboard.
Conclusion
In the most competitive world today, analytics is being most talked about and to represent any analytics and the insights of the organization data it has to be well represented in the dashboard and thus tableau being one of the significant reporting tools. We have seen how to combine multiple sheets onto dashboards in the tableau and how to configure them. We have used functions like Dashboard Actions to annotate. They have mobile-ready dashboards. And these advanced features in dashboards can make a big difference. They can make fun to communicate the data, they can engage and delight the user. Using layout containers tableau can group objects horizontally or vertically. No programming is required to share a dashboard. Tableau has three different types of navigations they are select, hover, menu.