
- Financial Performance – A Complete Tutorial
- How Six Sigma Principles Can Progress Your Productivity – Tutorial
- Google Analytics Pro Tutorial | Fast Track your Career
- Activity-Based Costing Tutorial | Know about Definition, Process, & Example
- Create a workbook in Excel Tutorial | Learn in 1 Day
- Excel ROUNDUP Formula Tutorial | Learn with Functions & Examples
- Business Analytics with Excel Tutorial | Learn In 1 Day
- SAP Tutorial – Free Guide Tutorial & REAL-TIME Examples
- IBM SPSS Statistics Tutorial: Getting Started with SPSS
- SAP Security Tutorial | Basics & Definition for Beginners
- SAP Simple Finance Tutorial | Ultimate Guide to Learn [Updated]
- SAP FIORI Tutorial | Learn in 1 Day FREE
- Introduction to Business Analytics with R Tutorial | Ultimate Guide to Learn
- Tableau Desktop Tutorial | Step by Step resource guide to learn Tableau
- Implementing SAP BW on SAP HANA | A Complete Guide
- SAP HANA Administration | Free Guide Tutorial & REAL-TIME Examples
- Tableau API Tutorial | Get Started with Tools, REST Basics
- SAP FICO ( Financial Accounting and Controlling ) Tutorial | Complete Guide
- Alteryx Tutorial | Step by Step Guide for Beginners
- Getting started with Amazon Athena Tutorial – Serverless Interactive | The Ultimate Guide
- Introduction to Looker Tutorial – A Complete Guide for Beginners
- Sitecore Tutorials | For Beginners Learn in 1 Day FREE |Ultimate Guide to Learn [UPDATED]
- Adobe Analytics Tutorial – The Ultimate Student Guide
- Splunk For Beginners – Learn Everything About Splunk with Free Online Tutorial
- An Overview of SAP HANA Tutorial: Learn in 1 Day FREE
- Statistical Package for the Social Sciences – SPSS Tutorial: The Ultimate Guide
- Splunk For Beginners – Learn Everything About Splunk with Free Online Tutorial
- Pentaho Tutorial – Best Resources To Learn in 1 Day | CHECK OUT
- Statistical Package for the Social Sciences – SPSS Tutorial: The Ultimate Guide
- An Overview of SAP HANA Tutorial: Learn in 1 Day FREE
- Spotfire Tutorial for Beginners | Quickstart – MUST- READ
- JasperReports Tutorial: Ultimate Guide to Learn [BEST & NEW]
- Charts and Tables – Qlikview Tutorial – Complete Guide
- TIBCO Business Works | Tutorial for Beginners – Learn From Home
- Cognos TM1 Tutorial : Learn Cognos from Experts
- Kibana
- Power BI Desktop Tutorial
- Tableau Tutorial
- SSAS Tutorial
- Creating Tableau Dashboards
- MDX Tutorial
- Tableau Cheat Sheet
- Analytics Tutorial
- Lean Maturity Matrix Tutorial
- MS Excel Tutorial
- Business Analysis Certification Levels & Their Requirements Tutorial
- Solution Assessment and Validation Tutorial
- Lean Six Sigma Tutorial
- Enterprise Analysis Tutorial
- Create Charts and Objects in Excel 2013 Tutorial
- Msbi Tutorial
- MicroStrategy Tutorial
- Advanced SAS Tutorial
- OBIEE Tutorial
- Tableau Server Tutorial
- OBIA Tutorial
- Business Analyst Tutorial
- Cognos Tutorial
- Qlik Sense Tutorial
- SAP-Bussiness Objects Tutorial
- SAS Tutorial
- PowerApps Tutorial

Tableau Tutorial
Last updated on 12th Oct 2020, Blog, Business Analytics, Tutorials
Tableau is a Business Intelligence tool for visually analyzing the data. Users can create and distribute an interactive and shareable dashboard, which depict the trends, variations, and density of the data in the form of graphs and charts. Tableau can connect to files, relational and Big Data sources to acquire and process data. The software allows data blending and real-time collaboration, which makes it very unique. It is used by businesses, academic researchers, and many government organizations for visual data analysis. It is also positioned as a leader Business Intelligence and Analytics Platform in Gartner Magic Quadrant.
Audience :
This tutorial is designed for all those readers who want to create, read, write, and modify Business Intelligence Reports using Tableau. In addition, it will also be quite useful for those readers who would like to become a Data Analyst or a Data Scientist.
Prerequisites :
Before proceeding with this tutorial, you should have a basic understanding of Computer Programming terminologies and Data analysis. You should also have some knowledge on various types of graphs and charts. Familiarity with SQL will be an added advantage.
Overview :
As a leading data visualization tool, Tableau has many desirable and unique features. Its powerful data discovery and exploration application allows you to answer important questions in seconds. You can use Tableau’s drag and drop interface to visualize any data, explore different views, and even combine multiple databases easily. It does not require any complex scripting. Anyone who understands the business problems can address it with a visualization of the relevant data. After analysis, sharing with others is as easy as publishing to Tableau Server.
What is Tableau?
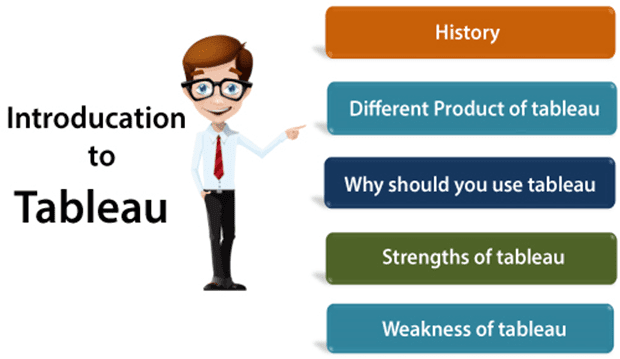
Tableau is the fastly growing and powerful data visualization tool. Tableau is a business intelligence tool which helps us to analyze the raw data in the form of the visual manner; it may be a graph, report, etc.
Example: If you have any data like Big Data, Hadoop, SQL, or any cloud data and if you want to analyze that given data in the form of pictorial representation of data, you can use Tableau.
Data analysis is very fast with Tableau, and the visualizations created are in the form of worksheets and dashboards. Any professional can understand the data created using Tableau.
Tableau software doesn’t require any technical or any programming skills to operate. Tableau is easy and fast for creating visual dashboards.
Subscribe For Free Demo
Error: Contact form not found.
Why use Tableau?
Here are some reasons to use Tableau:
- Ultimate skill for Data Science
- User-Friendly
- Apply to any Business
- Fast and Easy
- You don’t need to do any Coding
- Community is Huge
- Hold the power of data
- It makes it easier to understand and explain the Data Reports
Features of Tableau
Data Blending: Data blending is the most important feature in Tableau. It is used when we combine related data from multiple data sources, which you want to analyze together in a single view, and represent in the form of a graph.
Example : Assume, we have Sales data in relational database and Sales Target data in an Excel sheet. Now, we have to compare actual sales with target sales, and blend the data based on common dimensions to get access. The two sources which are involved in data blending referred to as primary data and secondary data sources. A left join will be created between the primary data source and the secondary data source with all the data rows from primary and matching data rows from secondary data source to blend the data.
1.Real-time analysis: Real-Time Analysis makes users able to quickly understand and analyze dynamic data, when the Velocity is high, and real-time analysis of data is complicated. Tableau can help extract valuable information from fast moving data with interactive analytics.
2.The Collaboration of data: Data analysis is not isolating task. That’s why Tableau is built for collaboration. Team members can share data, make follow up queries, and forward easy-to-digest visualizations to others who could gain value from the data. Making sure everyone understands the data and can make informed decisions is critical to success.
Tableau Features :
Tableau provides solutions for all kinds of industries, departments, and data environments. Following are some unique features which enable Tableau to handle diverse scenarios.
- Speed of Analysis − As it does not require high level of programming expertise, any user with access to data can start using it to derive value from the data.
- Self-Reliant − Tableau does not need a complex software setup. The desktop version which is used by most users is easily installed and contains all the features needed to start and complete data analysis.
- Visual Discovery − The user explores and analyzes the data by using visual tools like colors, trend lines, charts, and graphs. There is very little script to be written as nearly everything is done by drag and drop.
- Blend Diverse Data Sets − Tableau allows you to blend different relational, semistructured and raw data sources in real time, without expensive up-front integration costs. The users don’t need to know the details of how data is stored.
- Architecture Agnostic − Tableau works in all kinds of devices where data flows. Hence, the user need not worry about specific hardware or software requirements to use Tableau.
- Real-Time Collaboration − Tableau can filter, sort, and discuss data on the fly and embed a live dashboard in portals like SharePoint site or Salesforce. You can save your view of data and allow colleagues to subscribe to your interactive dashboards so they see the very latest data just by refreshing their web browser.
- Centralized Data − Tableau server provides a centralized location to manage all of the organization’s published data sources. You can delete, change permissions, add tags, and manage schedules in one convenient location. It’s easy to schedule extract refreshes and manage them in the data server. Administrators can centrally define a schedule for extracts on the server for both incremental and full refreshes.
Advantages of Tableau
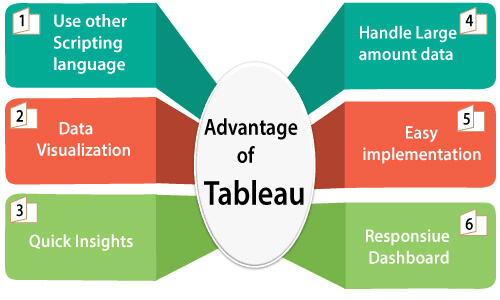
1.Data Visualization:- Tableau is a data visualization tool, and provides complex computation, data blending, and dashboarding for creating beautiful data visualizations.
2.Quickly Create Interactive Visualization:- Users can create a very interactive visual by using drag n drop functionalities of Tableau.
3.Comfortable in Implementation:- Many types of visualization options are available in Tableau, which enhances the user experience. Tableau is very easy to learn in comparison to Python. Who don’t have any idea about coding, they also can quickly learn Tableau.
4.Tableau can Handle Large Amounts of Data:- Tableau can easily handle millions of rows of data. A large amount of data can create different types of visualization without disturbing the performance of the dashboards. As well as, there is an option in Tableau where the user can make ‘live’ to connect different data sources like SQL, etc.
5.Use of other Scripting Language in Tableau:- To avoid the performance issues and to do complex table calculations in Tableau, users can include Python or R. Using Python Script, user can remove the load of the software by performing data cleansing tasks with packages. However, Python is not a native scripting language accepted by Tableau. So you can import some of the packages or visuals.
6.Mobile Support and Responsive Dashboard:- Tableau Dashboard has an excellent reporting feature that allows you to customize dashboard specifically for devices like a mobile or laptops. Tableau automatically understands which device is viewing the report by the user and make adjustments to ensure that accurate report is delivered to the right device.

Get Experts Curated Tableau Certification Training From Real-Time Experts
- Instructor-led Sessions
- Real-life Case Studies
- Assignments
Disadvantages of Tableau
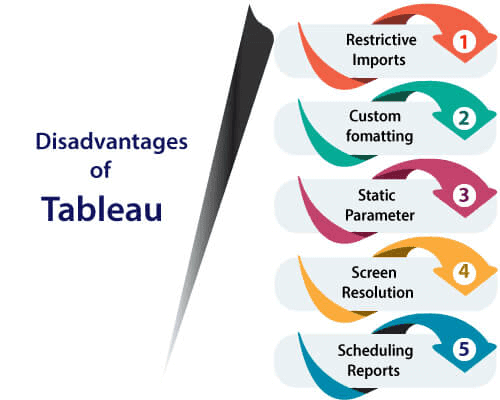
1.Scheduling of Reports:- Tableau does not provide the automatic schedule of reports. That’s why there is always some manual effort required when the user needs to update the data in the back end.
2.No Custom Visual Imports:- Other tools like Power BI, a developer can create custom visual that can be easily imported in Tableau, so any new visuals can recreate before imported, but Tableau is not a complete open tool.
3.Custom Formatting in Tableau:- Tableau’s conditional formatting, and limited 16 column table that is very inconvenient for users. Also, to implement the same format in multiple fields, there is no way for the user that they can do it for all fields directly. Users have to do that manually for each, so it is a very time-consuming.
4.Static and Single Value Parameter:- Tableau parameters are static, and it always select a single value as a parameter. Whenever the data gets changed, these parameters also have to be updated manually every time. There is no other option for users that can automate the updating of parameters.
5.Screen Resolution on Tableau Dashboards:- The layout of the dashboards is distributed if the Tableau developer screen resolution is different from users screen resolution.
Example:- If the dashboard is created on the screen resolution of 1920 X 1080 and it viewed on 2560 X 1440, then the layout of the dashboard will be destroyed a little bit, their dashboard is not responsive. So, you will need to create a dashboard for desktop and mobile differently.
File Types :
The result of data analysis in Tableau can be saved in various formats, to be saved and distributed. The various formats are referred as different file types and they are identified by different extensions. Their formats depend on how they are produced and for what purposes they are used. They are all stored as XML files, which can be opened and edited.
Following table lists the description of each file type and their usage.
| File Type | File Extension | Purpose |
|---|---|---|
| Tableau Workbook | .twb | It contains information on each sheet and dashboard that is present in a workbook. It has the details of the fields, which are used in each view and the formula applied to the aggregation of the measures. It also has the formatting and styles applied. It contains the data source connection information and any metadata information created for that connection. |
| Tableau Packaged Workbook | .twbx | This file format contains the details of a workbook as well as the local data that is used in the analysis. Its purpose is to share with other Tableau desktop or Tableau reader users, assuming it does not need data from the server. |
| Tableau Data Source | .tds | The details of the connection used to create the tableau report are stored in this file. In the connection details, it stores the source type (excel/relational/sap, etc.) as well as the data types of the columns. |
| Tableau Packaged Data source | .tdsx | This file is similar to the .tds file with the addition of data along with the connection details. |
| Tableau Data Extract | .tde | This file contains the data used in a .twb file in a highly compressed columnar data format. This helps in storage optimization. It also saves the aggregated calculations that are applied in the analysis. This file should be refreshed to get the updated data from the source. |
| Tableau Bookmark | .tbm | These files contain a single worksheet that is shared easily to be pasted into other workbooks. |
| Tableau Preferences | .tps | This file stores the color preference used across all the workbooks. It is mainly used for consistent look and feel across the users. |
Design Flow :
As Tableau helps in analyzing lots of data over diverse time periods, dimensions, and measures, it needs a very meticulous planning to create a good dashboard or story. Hence, it is important to know the approach to design a good dashboard. Like any other field of human endeavor, there are many best practices to be followed to create good worksheets and dashboards.
Though the final outcome expected from a Tableau project is ideally a dashboard with story, there are many intermediate steps which needs to be completed to reach this goal. Following is a flow diagram of design steps that should be ideally followed to create effective dashboards.
Connect to Data Source :
Tableau connects to all popular data sources. It has inbuilt connectors which take care of establishing the connection, once the connection parameters are supplied. Be it simple text files, relational sources, SQL sources or cloud data bases, Tableau connects to nearly every data source.
Build Data Views :
After connecting to a data source, you get all the column and data available in the Tableau environment. You classify them as dimensions and measures, and create any hierarchy required. Using these you build views, which are traditionally known as Reports. Tableau provides easy drag and drop feature to build views.
Enhance the Views :
The views created above needs to be enhanced further by the use of filters, aggregations, labeling of axes, formatting of colors and borders, etc.
Create Worksheets :
Create different worksheets to create different views on the same or different data.Create and Organize Dashboards
Dashboards contain multiple worksheets which are linked. Hence, the action in any of the worksheet can change the result in the dashboard accordingly.

Enroll in Tableau Certification Course to Build Your Skills & Career
Weekday / Weekend BatchesSee Batch DetailsCreate a Story :
A story is a sheet that contains a sequence of worksheets or dashboards that work together to convey information. You can create stories to show how facts are connected, provide context, demonstrate how decisions relate to outcomes, or simply make a compelling case.
Functions :
Any data analysis involves a lot of calculations. In Tableau, the calculation editor is used to apply calculations to the fields being analyzed. Tableau has a number of inbuilt functions which help in creating expressions for complex calculations.
Following are the description of different categories of functions.
- Number Functions
- String Functions
- Date Functions
- Logical Functions
- Aggregate Functions
Number Functions :
These are the functions used for numeric calculations. They only take numbers as inputs. Following are some examples of important number functions.
| Function | Description | Example |
|---|---|---|
| CEILING (number) | Rounds a number to the nearest integer of equal or greater value. | CEILING(2.145) = 3 |
| POWER (number, power) | Raises the number to the specified power. | POWER(5,3) = 125 |
| ROUND (number, [decimals]) | Rounds the numbers to a specified number of digits. | ROUND(3.14152,2) = 3.14 |
String Functions :
String Functions are used for string manipulation. Following are some important string functions with examples
| Function | Description | Example |
|---|---|---|
| LEN (string) | Returns the length of the string. | LEN(“Tableau”) = 7 |
| LTRIM (string) | Returns the string with any leading spaces removed. | LTRIM(” Tableau “) = “Tableau” |
| REPLACE (string, substring, replacement) | Searches the string for substring and replaces it with a replacement. If the substring is not found, the string is not changed. | REPLACE(“GreenBlueGreen”, “Blue”, “Red”) = “GreenRedGreen” |
| UPPER (string) | Returns string, with all characters uppercase. | UPPER(“Tableau”) = “TABLEAU” |
Date Functions :
Tableau has a variety of date functions to carry out calculations involving dates. All the date functions use the date_part which is a string indicating the part of the date such as – month, day, or year. Following table lists some examples of important date functions.
| Function | Description | Example |
|---|---|---|
| DATEADD (date_part, increment, date) | Returns an increment added to the date. The type of increment is specified in date_part. | DATEADD (‘month’, 3, #2004-04-15#) = 2004-0715 12:00:00 AM |
| DATENAME (date_part, date, [start_of_week]) | Returns date_part of date as a string. The start_of_week parameter is optional. | DATENAME(‘month’, #200404-15#) = “April” |
| DAY (date) | Returns the day of the given date as an integer. | DAY(#2004-04-12#) = 12 |
| NOW( ) | Returns the current date and time. | NOW( ) = 2004-04-15 1:08:21 PM |
Logical Functions :
These functions evaluate some single value or the result of an expression and produce a boolean output.
| Function | Description | Example |
|---|---|---|
| IFNULL (expression1, expression2) | The IFNULL function returns the first expression if the result is not null, and returns the second expression if it is null. | IFNULL([Sales], 0) = [Sales] |
| ISDATE (string) | The ISDATE function returns TRUE if the string argument can be converted to a date, and FALSE if it cannot. | ISDATE(“11/05/98”) = TRUEISDATE(“14/05/98”) = FALSE |
| MIN(expression) | The MIN function returns the minimum of an expression across all records or the minimum of two expressions for each record. |
Aggregate Functions :
| Function | Description |
|---|---|
| AVG(expression) | Returns the average of all the values in the expression. AVG can be used with numeric fields only. Null values are ignored. |
| COUNT (expression) | Returns the number of items in a group. Null values are not counted. |
| MEDIAN (expression) | Returns the median of an expression across all records. Median can only be used with numeric fields. Null values are ignored. |
| STDEV (expression) | Returns the statistical standard deviation of all values in the given expression based on a sample of the population. |
Tableau Architecture
Tableau Server is designed to connect many data tiers. It can connect clients from Mobile, Web, and Desktop. Tableau Desktop is a powerful data visualization tool. It is very secure and highly available.
It can run on both the physical machines and virtual machines. It is a multi-process, multi-user, and multi-threaded system.
Providing such powerful features requires unique architecture.
The different layers used in Tableau server are given in the following architecture diagram:-
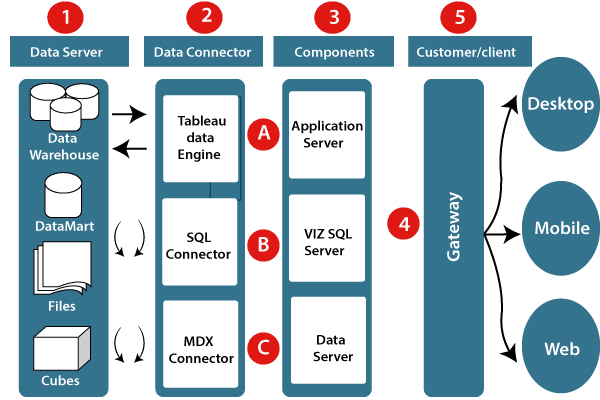
Let’s study about the different component of the Tableau architecture:
1. Data server:- The primary component of Tableau Architecture is the Data sources which can connect to it.
Tableau can connect with multiple data sources. It can blend the data from various data sources. It can connect to an excel file, database, and a web application at the same time. It can also make the relationship between different types of data sources.
2. Data connector:- The Data Connectors provide an interface to connect external data sources with the Tableau Data Server.
Tableau has in-built SQL/ODBC connector. This ODBC Connector can be connected with any databases without using their native connector. Tableau desktop has an option to select both extract and live data. On the uses basis, one can be easily switched between live and extracted data.
- Real-time data or live connection: Tableau can be connected with real data by linking to the external database directly. It uses the infrastructure existing database by sending dynamic multidimensional expressions (MDX) and SQL statements. This feature can be used as a linking between the live data and Tableau rather than importing the data. It makes optimized and a fast database system. Mostly in other enterprises, the size of the database is large, and it is updated periodically. In these cases, Tableau works as a front-end visualization tool by connecting with the live data.
- Extracted or in-memory data: Tableau is an option to extract the data from external data sources. We make a local copy in the form of Tableau extract file. It can remove millions of records in the Tableau data engine with a single click. Tableau’s data engine uses storage such as ROM, RAM, and cache memory to process and store data. Using filters, Tableau can extract a few records from a large dataset. This improves performance, especially when we are working on massive datasets. Extracted data allows the users to visualize the data offline, without connecting to the data source.
3. Components of Tableau server: Different types of component of the Tableau server are:
- Application server
- VizQL server
- Data server
A. Application server: The application server is used to provide the authorizations and authentications. It handles the permission and administration for mobile and web interfaces. It gives a guarantee of security by recording each session id on Tableau Server. The administrator is configuring the default timeout of the session in the server.
B. VizQL server: VizQL server is used to convert the queries from the data source into visualizations. Once the client request is forwarded to the VizQL process, it sends the query directly to the data source retrieves information in the form of images. This visualization or image is presented for the users. Tableau server creates a cache of visualization to reduce the load time. The cache can be shared between many users who have permission to view the visualization.
C. Data server: Data server is used to store and manage the data from external data sources. It is a central data management system. It provides data security, metadata management, data connection, driver requirements, and data storage. It stores the related details of data set like calculated fields, metadata, groups, sets, and parameters. The data source can extract the data as well as make live connections with external data sources.
4. Gateway: The gateway directed the requests from users to Tableau components. When the client sends a request, it is forwarded to the external load balancer for processing. The gateway works as a distributor of processes to different components. In case of absence of external load balancer, the gateway also works as a load balancer. For single server configuration, one gateway or primary server manages all the processes. For multiple server configurations, one physical system works as a primary server, and others are used as worker servers. Only one machine is used as a primary server in Tableau Server environment.
5. Clients: The visualizations and dashboards in Tableau server can be edited and viewed using different clients. Clients are a web browser, mobile applications, and Tableau Desktop.
- Web Browser: Web browsers like Google Chrome, Safari, and Firefox support the Tableau server. The visualization and contents in the dashboard can be edited by using these web browser.
- Mobile Application: The dashboard from the server can be interactively visualized using mobile application and browser. It is used to edit and view the contents in the workbook.
- Tableau Desktop: Tableau desktop is a business analytics tool. It is used to view, create, and publish the dashboard in Tableau server. Users can access the various data source and build visualization in Tableau desktop.
Download and Installation of Tableau
Tableau is available in two ways:-
- Tableau Public (Free)
- Tableau Desktop (Commercial)
Here is a comparison between the Tableau Public and Tableau Desktop
Tableau Public
- Tableau Public is a free and open-source.
- Tableau public data source can connect to Excel and Text files.
- Tableau public can be installed on Window and Mac operating system.
- Data and Visualizations are not secured in the Tableau public because it is available in public.
- In Tableau public, data cannot be obtained from different data sources as it is limited to connect only Excel and Text files.
- Tableau public uses the details at Personal level.
Tableau Desktop
- Tableau Desktop is a paid source, personal edition- $35 per month and professional edition- $70 per month.
- Tableau desktop data source can connect to any data source file, including databases, web applications, and more.
- Tableau desktop can also install on Window and Mac operating system.
- Data and Visualization are secured in Tableau desktop.
- In Tableau desktop, data can extract from various data sources and stored as Tableau extract file.
- Tableau desktop uses the details at Professional and Enterprise level.
Lets install the Tableau Desktop on Window machine and go through step by step:-
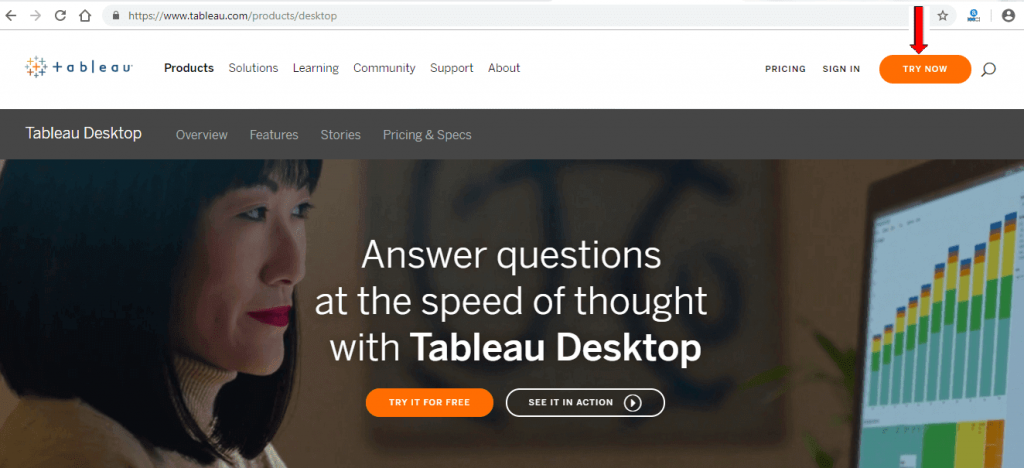
Step1:- Go to https://www.tableau.com/products/desktop on your Web browser.
Step2:- Click on the ‘Try Now’ button.
Step3:- Now, enter your Email id and click on the ‘Download Free Trial’ button.
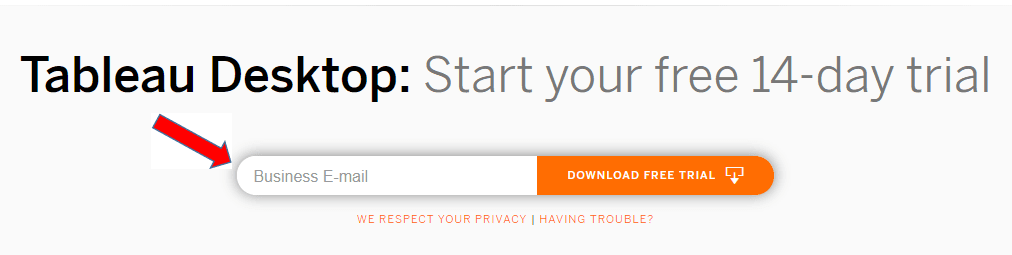
Step4:- This will start downloading the .exe File for window machine by default.
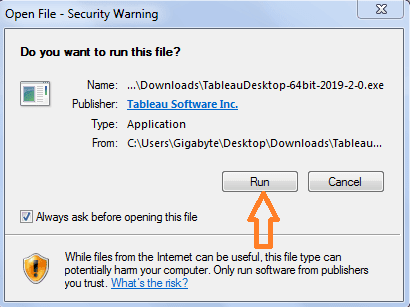
Step5:- Open the download file, and click on the ‘Run’ button.
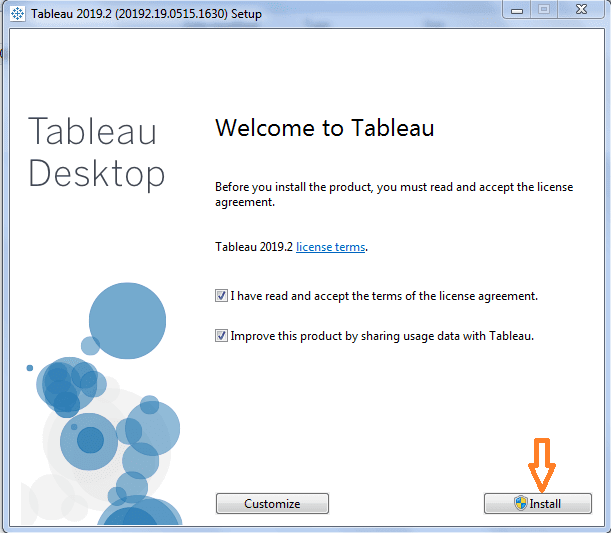
Step6:- Accept the terms and condition and click on ‘Install’ button.
Step7:- A pop message will be shown on the screen to get the approval of the administrator to install the Tableau software. Click on ‘yes’ to approve it than installation will be started.
Step8:- Once the installation is completed, then open the Tableau desktop software.
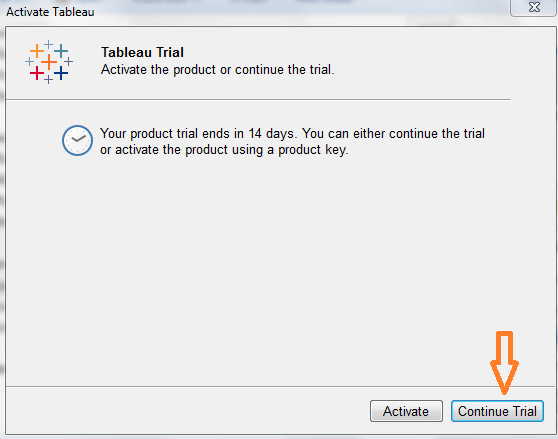
Step9:- In the registration window
- Click on Activate Tableau and fill your complete details.
- Click on start trial now.
Step10:- Wait for complete registration.
Step11:- Start screen of the Tableau Desktop.
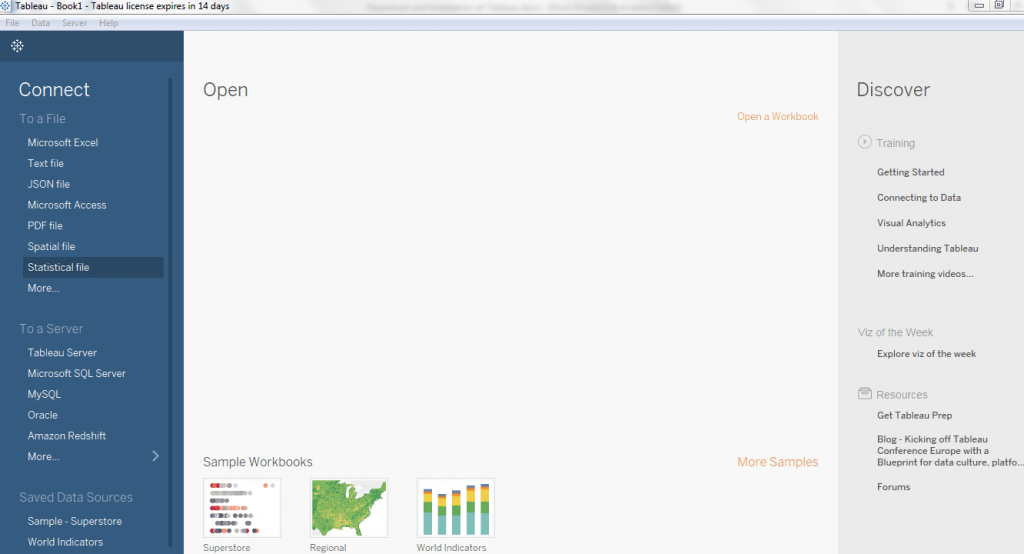
Now, you are all set to use your Tableau desktop on your window machine.