
- Financial Performance – A Complete Tutorial
- How Six Sigma Principles Can Progress Your Productivity – Tutorial
- Google Analytics Pro Tutorial | Fast Track your Career
- Activity-Based Costing Tutorial | Know about Definition, Process, & Example
- Create a workbook in Excel Tutorial | Learn in 1 Day
- Excel ROUNDUP Formula Tutorial | Learn with Functions & Examples
- Business Analytics with Excel Tutorial | Learn In 1 Day
- SAP Tutorial – Free Guide Tutorial & REAL-TIME Examples
- IBM SPSS Statistics Tutorial: Getting Started with SPSS
- SAP Security Tutorial | Basics & Definition for Beginners
- SAP Simple Finance Tutorial | Ultimate Guide to Learn [Updated]
- SAP FIORI Tutorial | Learn in 1 Day FREE
- Introduction to Business Analytics with R Tutorial | Ultimate Guide to Learn
- Tableau Desktop Tutorial | Step by Step resource guide to learn Tableau
- Implementing SAP BW on SAP HANA | A Complete Guide
- SAP HANA Administration | Free Guide Tutorial & REAL-TIME Examples
- Tableau API Tutorial | Get Started with Tools, REST Basics
- SAP FICO ( Financial Accounting and Controlling ) Tutorial | Complete Guide
- Alteryx Tutorial | Step by Step Guide for Beginners
- Getting started with Amazon Athena Tutorial – Serverless Interactive | The Ultimate Guide
- Introduction to Looker Tutorial – A Complete Guide for Beginners
- Sitecore Tutorials | For Beginners Learn in 1 Day FREE |Ultimate Guide to Learn [UPDATED]
- Adobe Analytics Tutorial – The Ultimate Student Guide
- Splunk For Beginners – Learn Everything About Splunk with Free Online Tutorial
- An Overview of SAP HANA Tutorial: Learn in 1 Day FREE
- Statistical Package for the Social Sciences – SPSS Tutorial: The Ultimate Guide
- Splunk For Beginners – Learn Everything About Splunk with Free Online Tutorial
- Pentaho Tutorial – Best Resources To Learn in 1 Day | CHECK OUT
- Statistical Package for the Social Sciences – SPSS Tutorial: The Ultimate Guide
- An Overview of SAP HANA Tutorial: Learn in 1 Day FREE
- Spotfire Tutorial for Beginners | Quickstart – MUST- READ
- JasperReports Tutorial: Ultimate Guide to Learn [BEST & NEW]
- Charts and Tables – Qlikview Tutorial – Complete Guide
- TIBCO Business Works | Tutorial for Beginners – Learn From Home
- Cognos TM1 Tutorial : Learn Cognos from Experts
- Kibana
- Power BI Desktop Tutorial
- Tableau Tutorial
- SSAS Tutorial
- Creating Tableau Dashboards
- MDX Tutorial
- Tableau Cheat Sheet
- Analytics Tutorial
- Lean Maturity Matrix Tutorial
- MS Excel Tutorial
- Business Analysis Certification Levels & Their Requirements Tutorial
- Solution Assessment and Validation Tutorial
- Lean Six Sigma Tutorial
- Enterprise Analysis Tutorial
- Create Charts and Objects in Excel 2013 Tutorial
- Msbi Tutorial
- MicroStrategy Tutorial
- Advanced SAS Tutorial
- OBIEE Tutorial
- Tableau Server Tutorial
- OBIA Tutorial
- Business Analyst Tutorial
- Cognos Tutorial
- Qlik Sense Tutorial
- SAP-Bussiness Objects Tutorial
- SAS Tutorial
- PowerApps Tutorial
Qlik Sense Tutorial
Last updated on 27th Sep 2020, Blog, Business Analytics, Tutorials
WHAT IS QLIK SENSE?
Qlik Sense is a visual analysis platform that unlocks the potential of every user to harness information and uncover insight. Users of all types and skill levels can generate the insight they need to instantly answer questions and solve problems in their lines of business, problems that require much more than just an initial overview of information.
Qlik Sense is different from QlikView by owned by same company Qlik. With Qlik Sense, users of any skill level are empowered to follow their own paths to insight. Through the Associative Experience, you can ask question after question, from any object, in any direction, using simple selections and searches. Qlik Sense provides instant feedback on associated and unrelated data and updated analytics after every step. The result is a vehicle for discovery that delivers the right insight at all stages of the exploratory process.
Qlik Sense is self-service visualization tool, enabling users to rapidly create dashboards and explore complex data without being hindered by technical limitations and predefined paths.
HOW DOES QLIK SENSE WORK?
At the heart of Qlik Sense is a patented in-memory software engine that generates new views of information on the fly. Each time a user clicks, the Qlik Sense engine instantly responds with a newly calculated set of data associations and visualizations, specific to the user’s selections. If you are a non-technical user, this directly benefits you, because you are not required to develop new reports or visualizations.
WHERE CAN I USE QLIK SENSE ?
Suppose you have a web Portal for school. In the Dashboard of portal under parents login, You want to show a chart of their child performance status in past three months. Here you can use Qlik Sense, The only thing you have to do is to create chart on qlik server and make the connection of your web server to Qlik Sense Server. Now using the chart Id in Qlik Sense server, You can directly load the chart where ever you want.
HOW TO ACCESS QLIK SENSE?
If you need to learn Qlik Sense , First thing you have to do is download desktop version of Qlik Sense. When you go for download you have to fill a Registration form and go for email verification. Install the setup of Qlik Sense Desktop. Its really simple just like to install a setup of ordinary application. Congratulations on your setup.
If Qlik Sense Desktop is installed then you are ready to start. Start Qlik Sense Desktop from the shortcut on your desktop, through the Start menu. While opening it will ask you to log in. You can create an user in Qlik single sign on portal and keep it with you because it will be asked every time you enter in to Qlik Sense.
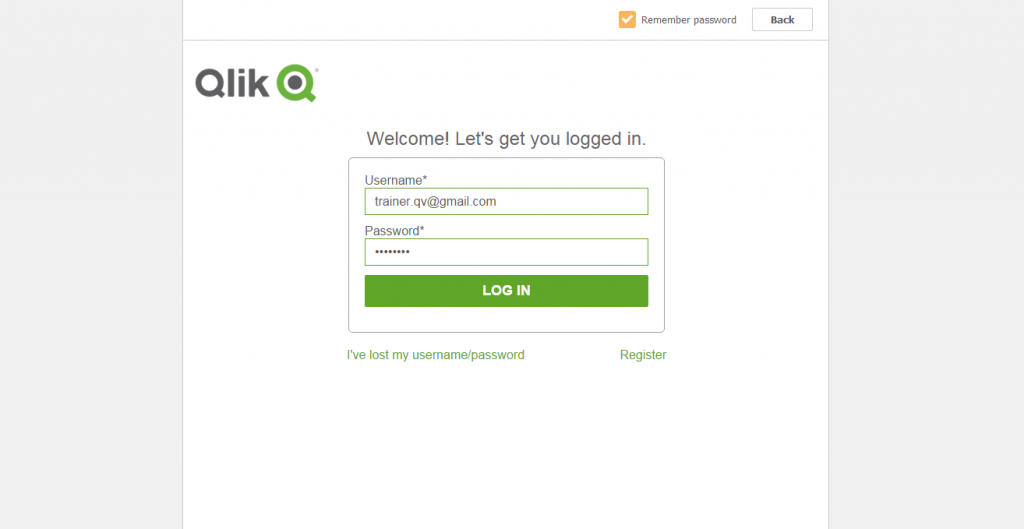
(Qlik Sense Login Page)
When you start Qlik Sense Desktop, you arrive at the hub. You can close the greeting message. The hub is repository where you find all your apps. If you have placed the app in the Apps folder, you should see it in your hub.
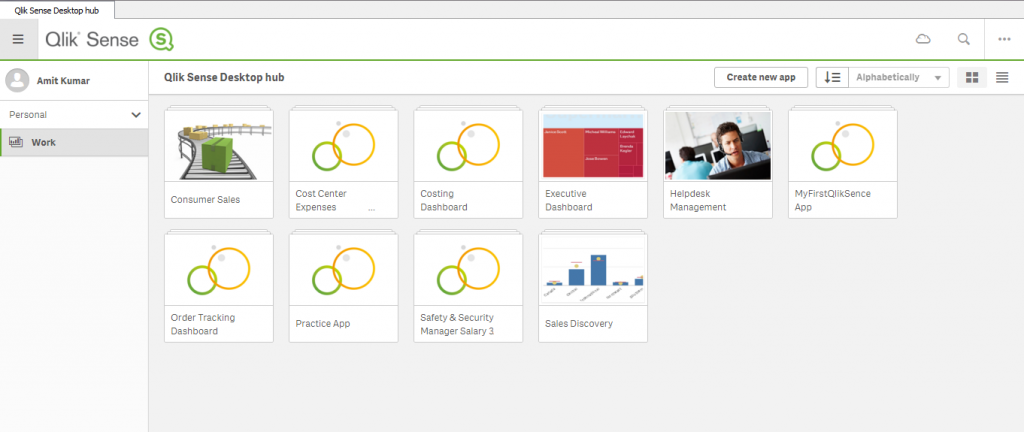
(Qlik Sense Hub)
Subscribe For Free Demo
Error: Contact form not found.
OPENING A QLIK SENSE APP
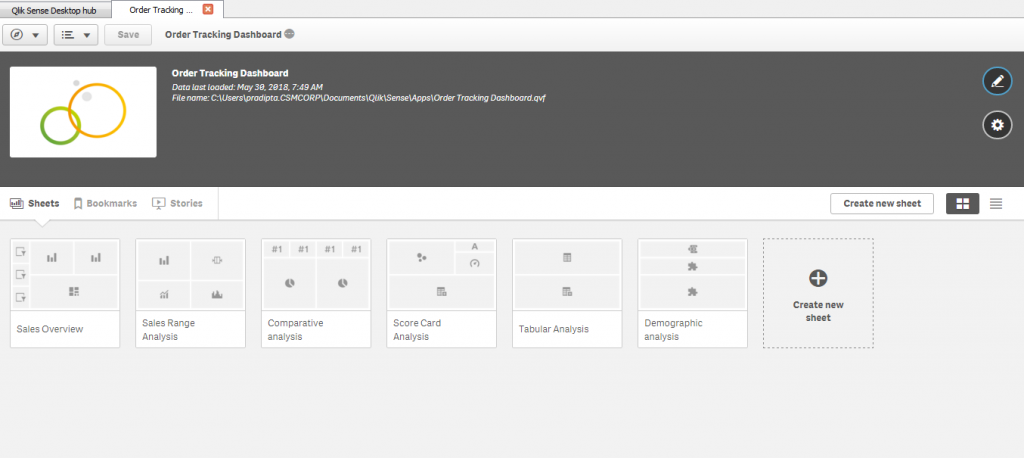
The app overview is opened. You are now inside the app and can see the content of the app. By default, the app overview shows the sheets of the app. In the app there are six sheets. It is in the sheets that you do most of the work, especially if you primarily are a business user and not a developer. Click to open a sheet.
OPENING A SHEET
This is the insight of Qlik sense sheet. Which contain multiple visualization objects and filters in the left side menu.
(Qlik Sense Sheet)
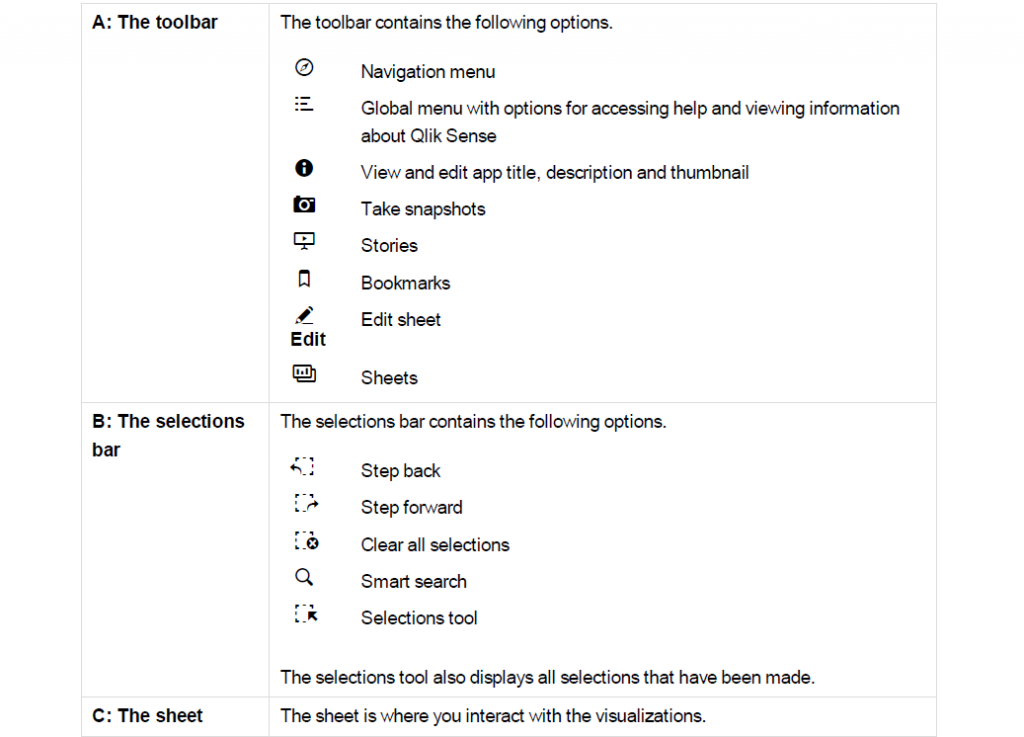
It is in the sheets that you explore, analyze, and discover the data. It is also where you create, design, and structure the visualizations when you build apps. The sheet view has three sections: the toolbar, the Selections tool, and the sheet. When you are editing a sheet there are panels on both sides of the sheet.
VISUALIZATIONS OF QLIK SENSE
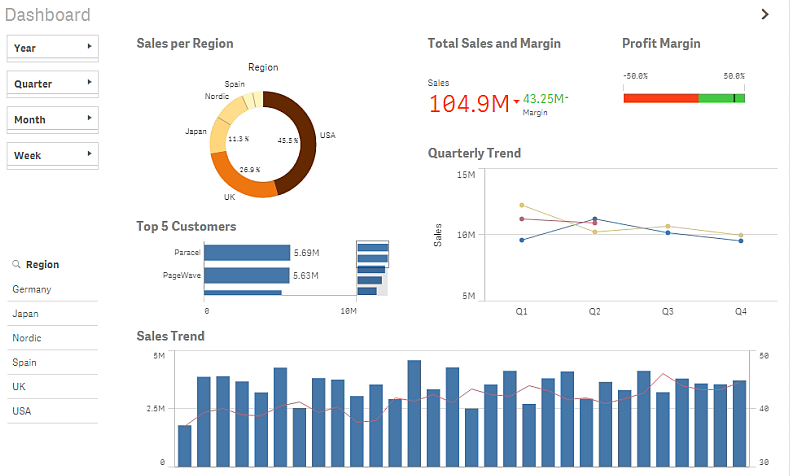
Different visualizations serve different purposes. The point of a visualization in general is to communicate its data in a quick and meaningful way while remaining 100% accurate. Let us have a look at the visualizations in the app.
- Filter panes
In the sheet Dashboard, there are two filter panes to the left: the time filter pane without title and Region. They are both filter panes, although they do not look the same. Region contains only one dimension, and shows the dimension values in a list. The time filter pane contains four dimensions, and because the space is limited, the lists are all compressed to panes. The purpose of the filter panes is to filter out a limited data set, which you can analyze and explore.
- Pie chart
Pie charts show the relationship between values as well as the relation of a single value to the total. Each sector represents a value, and as long as there are a limited number of values (less than 10), you get a good overview of the relative size of the sectors. The values are ordered by size.
- Bar chart
Below the pie chart is a bar chart, Top 5 Customers. Bar charts are useful when you want to compare
multiple values. The bars give information about the relationship between different values. Bars can be
grouped or stacked, and be displayed horizontally or vertically.
- Combo chart
Combo charts are usually used for displaying trends with bars and lines in the same visualization. A combo chart is especially useful when you want to combine values that normally are hard to combine, because they have totally different scales. The solution in the combo chart is to have two axes for the measures. In Sales Trend, the combo chart combines sales figures (millions of dollars, on the left axis) with margin (percent, on the right axis).
- KPI
To the right of the pie chart is a KPI visualization, Total Sales and Margin. It can be very useful to track performance. In a KPI visualization, you can show one or two measure values with text labels. You can add conditional colors and symbols to the values.
- Gauge
To the right of the KPI visualization is a gauge, Profit Margin. A gauge is used to display a single key measure value. In this case it is the profit margin. The colors reinforce the interpretation of the value.
- Line chart
The final visualization is a line chart, Quarterly Trend. Line charts are often used to show trends, and here there are two dimensions, year and quarter that displays the trends for each quarter of the years 2012-2014.
- Map
The fourth sheet, Customer Location, contains three filter panes and one new visualization: a map. In Qlik Sense you can create two types of maps, point maps and area maps. The map we are using in this tutorial is a point map. A point map is created using point coordinates (latitude and longitude) to mark places of interest, for example cities. Maps can, for example, be used for plotting sales data per region or per location. The map in this tutorial is used to show customer locations. You can filter by Region, City, or Customer. You can also make selections directly in the map by either clicking on a point or by using the lasso tool to select an area. If you hold down Shift before you make a selection you can select several areas to analyze.
QLIK SENSE INTERFACES:
Apart from visualization, Qlik sense has various interfaces as shown below, which we need to understand:
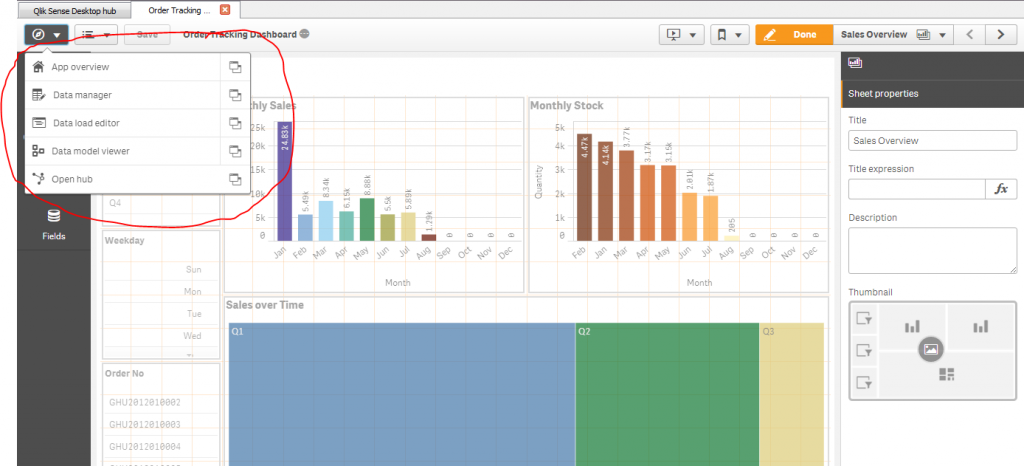
- App Overview: It is the page where we can see all the sheets in the dashboard
- Data Manager: If you want to see the data inside the tables or data model you can access data manager
- Data Load editor: Here we write data base codes and loading statements
- Data Model Viewer: Here we can see the table schema and relationships in a visual console
- Open Hub: Through this we can open Qilk Sense hub through which we can access to web based dashboard development platform.
QlikView and QlikSense Comparison Table
Below is the comparison table between QlikView and QlikSense.
| Basis Of Comparisons | QlikView | QlikSense |
|---|---|---|
| Product Feature | Dynamic BI ecosystem and interact with dynamic apps, dashboards and analytics | Smart search feature like Google and functions in an associative manner |
| Connectors | Default and custom connectors | Fast and reliable connections to multiple data source. |
| Visualisations | Data Visualisations | Drag and Drop Visualisation |
| Product Info | Business Intelligence data discovery product that is used to create guided analytics applications as well as dashboards designed for business challenges. | A smart and user-friendly analytics tools that can generate personalized reports and very detailed dashboards in an instant. |
| Definition | QlikView is for Guided Analytics | QlikSense is for Self-Service Data Discovery |
| Focus | It is designed for Advanced Analytics | It focuses on business Use Cases |
| Filter | Deriving part of filters and allocating a separate sheet with filters is required | Filter is not required |
| Suitability | Suitable for guided analytics | It is best to fit for self-service visualizations |
| Platform | Provides an in-the-box application development platform | Self-service data discovery tool |
| Choice Based | Less choice to make things good and work well | More advanced to display things in an orderly fashion |
| Advanced Features | Advanced Reporting Templates and Custom Reports | Powerful Open and Standard APIs with Multi-source data integration including big data |
| Devices Supported | Windows, MAC, iPhone, iPad, Web Based | Windows, MAC, iPhone, iPad, Web Based, Android |
| Language Supported | English | English, China, Germany, Japan |
| Data Loading | Data Loading is slower comparing QlikSense | Data Loading is faster in QlikSense |
| Storey Telling | QlikView Lacks the feature of Storey Telling | QlikSense has a feature of Story Telling |
Qlik Sense consists of three editions as follows:
- 1.Qlik Sense Enterprise
- 2.Qlik Sense Business
- 3.Qlik Sense Team
Qlik Sense if available free for personal and internal business. You can download it from its official website and start using it. Qlik Sense can be learnt very easily. It is an interactive application. Qlik Sense desktop hub gives you the glimpse of all the applications you prepared and each application can consist of number of sheets. It is very easy to navigate. Data can be loaded and charts can be prepared by simple drag and drop. You can connect to standard APIs for further customization. It can be connected to Qlik View and can combine with its scripts.
QLIK SENSE PROCESS FLOW
In this section, we see the Qlik Sense Process Flow step by step,
Step 1: The data is entered in the Qlik Sense Environment via Qlik Sense Proxy. Proxy acts as a gateway between users and the client. In other words, this Proxy connects the front end and back end.
Step 2: The data that comes from the user is stored in Qlik Sense Repository and the Qlik Sense Scheduler manages the loading and reloading of this data in QIX Engine.
Step 3: Once the data is loaded into back end, all the major functionalities like data indexing, calculations, searching, self-service interactions is done in Qlik Sense Engine. Its main functionality includes processing the data and returns the appropriate results.
Step 4: Once all the functionality is done on the data the proxy returns the data to the end user with the help of Qlik Sense Application. Qlik Sense Application serves as the front end. We get the final file with .QVF extension. This file also contains all the data loaded in Qlik Sense back end in a compressed format.
QLIK SENSE TRAINING AND CERTIFICATION
- 35+ Video Tutorials
- 8 Case Studies
- 2 eBooks
- 3 Presentation Decks
- 1 Webinar
- 24*7 Dedicated Support
Step 5: Qlik Sense Application is the final layer that is used to create visualizations.
IMPORTANCE OF QLIK SENSE
There are number of advantages offered by Qlik Sense and hence it is Important Qlik Sense can be further classified into Qlik Sense Desktop, Qlik Sense Cloud, and Qlik Sense Enterprise. The following is the importance:
- Users are able to visualize the analytical areas of interest
- Reports can be easily created by drag and drop method
- It provides Qlik View load scripts migration
- Debugging is made easier with the help of extensions
- Token licensing model provides flexibility in license management
- Accessible through almost all devices
- You can create new extensions manually and can make more beautiful visualizing dashboards
- It is easy to access and analyze by all employees with the tools they are already familiar
- Data from any source can be aggregated in Qlik Sense and therefore can be analyzed easily
- The business becomes successful with the help of Qlik Sense as it offers best and easy analysis
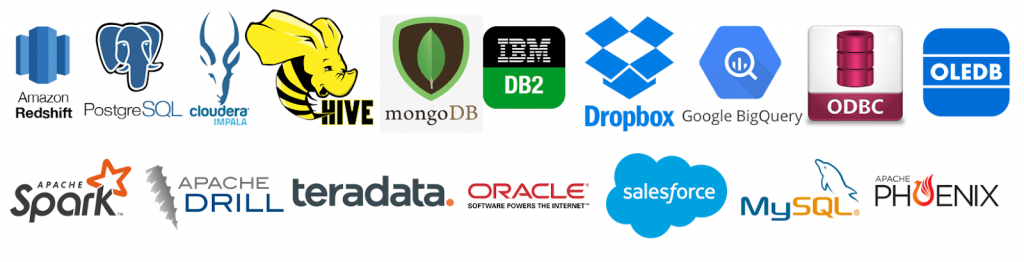
DIFFERENT TYPES OF CONNECTION OFFERED BY QLIK SENSE
Qlik Sense offers almost all types of connections to data sources known. The few are stated below:
COMPANIES USING QLIK SENSE
In total 3461 number of Companies are using Qlik Sense around the globe currently. Some of the known names are as follows:


COMPARING ANALYTIC TOOLS
The following is the comparison between four different analytical tools –
Qlik Sense/View Vs Sisense Vs Power BI Vs Tableau.
| Specifications | QlikSense | Sisense | MicrosoftPowerBI | TableauDesktop |
|---|---|---|---|---|
| TrialFreeVersion | ✓ | ✓ | ✓ | ✓ |
| MobileVersion | ✓ | ✓ | ✓ | ✓ |
| Analytics(Point-in-time) | ✓ | X | ✓ | ✓ |
| Analytics(Real-time) | X | ✓ | ✓ | ✓ |
| Analytics (Predictive) | ✓ | X | ✓ | ✓ |
| Prep toolsforData | ✓ | ✓ | ✓ | ✓ |
| Tools for Data (Join, integrate, blend) | ✓ | ✓ | ✓ | ✓ |
| Natural language query | X | ✓ | ✓ | X |
| Social media analytics | ✓ | ✓ | ✓ | ✓ |
| Visualization feature | ✓ | ✓ | ✓ | ✓ |
| Sharing/Collaboration Tool | ✓ | ✓ | ✓ | ✓ |
Conclusion:
We discussed about the following:
- Data Analytics and its importance
- Qlik Sense and its Importance
- How Qlik Sense Works, discussed about its architectural component’s functionalities
- Different type of connectors offered by Qlik Sense
- The names of all the companies that are currently using Qlik Sense