
- Financial Performance – A Complete Tutorial
- How Six Sigma Principles Can Progress Your Productivity – Tutorial
- Google Analytics Pro Tutorial | Fast Track your Career
- Activity-Based Costing Tutorial | Know about Definition, Process, & Example
- Create a workbook in Excel Tutorial | Learn in 1 Day
- Excel ROUNDUP Formula Tutorial | Learn with Functions & Examples
- Business Analytics with Excel Tutorial | Learn In 1 Day
- SAP Tutorial – Free Guide Tutorial & REAL-TIME Examples
- IBM SPSS Statistics Tutorial: Getting Started with SPSS
- SAP Security Tutorial | Basics & Definition for Beginners
- SAP Simple Finance Tutorial | Ultimate Guide to Learn [Updated]
- SAP FIORI Tutorial | Learn in 1 Day FREE
- Introduction to Business Analytics with R Tutorial | Ultimate Guide to Learn
- Tableau Desktop Tutorial | Step by Step resource guide to learn Tableau
- Implementing SAP BW on SAP HANA | A Complete Guide
- SAP HANA Administration | Free Guide Tutorial & REAL-TIME Examples
- Tableau API Tutorial | Get Started with Tools, REST Basics
- SAP FICO ( Financial Accounting and Controlling ) Tutorial | Complete Guide
- Alteryx Tutorial | Step by Step Guide for Beginners
- Getting started with Amazon Athena Tutorial – Serverless Interactive | The Ultimate Guide
- Introduction to Looker Tutorial – A Complete Guide for Beginners
- Sitecore Tutorials | For Beginners Learn in 1 Day FREE |Ultimate Guide to Learn [UPDATED]
- Adobe Analytics Tutorial – The Ultimate Student Guide
- Splunk For Beginners – Learn Everything About Splunk with Free Online Tutorial
- An Overview of SAP HANA Tutorial: Learn in 1 Day FREE
- Statistical Package for the Social Sciences – SPSS Tutorial: The Ultimate Guide
- Splunk For Beginners – Learn Everything About Splunk with Free Online Tutorial
- Pentaho Tutorial – Best Resources To Learn in 1 Day | CHECK OUT
- Statistical Package for the Social Sciences – SPSS Tutorial: The Ultimate Guide
- An Overview of SAP HANA Tutorial: Learn in 1 Day FREE
- Spotfire Tutorial for Beginners | Quickstart – MUST- READ
- JasperReports Tutorial: Ultimate Guide to Learn [BEST & NEW]
- Charts and Tables – Qlikview Tutorial – Complete Guide
- TIBCO Business Works | Tutorial for Beginners – Learn From Home
- Cognos TM1 Tutorial : Learn Cognos from Experts
- Kibana
- Power BI Desktop Tutorial
- Tableau Tutorial
- SSAS Tutorial
- Creating Tableau Dashboards
- MDX Tutorial
- Tableau Cheat Sheet
- Analytics Tutorial
- Lean Maturity Matrix Tutorial
- MS Excel Tutorial
- Business Analysis Certification Levels & Their Requirements Tutorial
- Solution Assessment and Validation Tutorial
- Lean Six Sigma Tutorial
- Enterprise Analysis Tutorial
- Create Charts and Objects in Excel 2013 Tutorial
- Msbi Tutorial
- MicroStrategy Tutorial
- Advanced SAS Tutorial
- OBIEE Tutorial
- Tableau Server Tutorial
- OBIA Tutorial
- Business Analyst Tutorial
- Cognos Tutorial
- Qlik Sense Tutorial
- SAP-Bussiness Objects Tutorial
- SAS Tutorial
- PowerApps Tutorial
Msbi Tutorial
Last updated on 29th Sep 2020, Blog, Business Analytics, Tutorials
Data is essential for analysis that has to be collected from multiple sources over the network to derive useful information from it. The analysis of data to gain meaningful insights is what Business Intelligence is all about. BI experts are transforming business data using computer-based techniques and enabling users to make fact-based decisions.
What are users looking for in data?
- Data is collected from multiple sources and integrated well across the network.
- Summarize the data that puts real value for the organization.
- Try to explore the historical data to know about the actual health of an organization.
- The collected data have certain capabilities, and you need to work on the same.
- All these things can be made true using BI techniques and strategies.
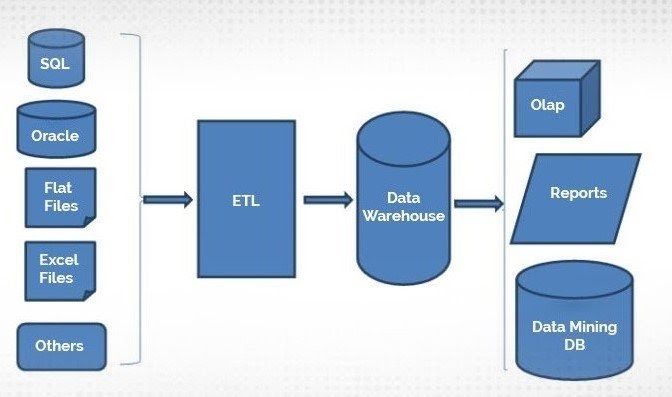
Let us understand the concept with the help of a simple example where data is collected in different formats. If you ask users to read the data in the same format, then it may be difficult for users to understand everything technically. This is the reason data is represented in a user-friendly format using BI techniques that can be understood by anyone and derive meaningful insights from the same. So, BI is nothing but the process of transforming technical data into user-friendly data then converting it to meaningful information later. Here is the simple representation of the process.
A complete kit inside the SQL Server to implement the data warehouse was introduced by Microsoft. So, it is named as Microsoft BI. Here is a pictorial representation for the same how a data warehouse can be used with the BI process.
Subscribe For Free Demo
Error: Contact form not found.
What is MSBI?
MSBI stands for Microsoft Business Intelligence that consists of tools that help in giving optimized solutions for Business Intelligence and Data Mining Queries. MSBI uses SQL Server and Visual Studio platform that empowers users to gain access to the current information for making superior decisions. It allows users to analyze, discover, and visualize data with powerful self-serve BI in excel and enables sharing and collaboration of reports or data with SharePoint.
Features of MSBI
Here are a few highlighted features that you can enjoy when using MSBI:
- It provides a unified view of data to make realistic decisions.
- It reduces and eliminates instinctive decisions.
- It offers quick and timely decisions for businesses and makes it more responsive to dynamic business trends.
- It minimizes the need for manual work that reduces errors in return.
- It gives robust support for data analysis.
- It supports the historical and summarized data.
MSBI Architecture and related Terminologies
The MSBI architecture consists of ETL tools (SSIS, SSRS, and SSAS), Data warehouse, data in different formats, and more. Let us discuss on important terms quickly below:
- Data and Information: Data is the raw material for analysis related to transactions or events. When data is analyzed properly using different BI techniques, it becomes the information.
- Database: A database means the organized collection of data that can be retrieved using different tools or queries.
- Database Management System: Database Management Systems are specially designed software apps to interact with users, other tools, or the database itself as per the business requirements. A general-purpose database management system is designed in such a way that it allows creation, modification, or administration of databases as needed.
- Data Warehouse: It is effective for business analysis and reporting purposes. It is an output of integrated data from multiple sources and acts as a central repository for MSBI. A data warehouse can store both current and historical data that makes business reporting and data analysis much easier than your expectations. It is helpful for top management for making quick decisions by summarizing the information.
Technically, a data warehouse is a tool that divides the analytical workload from the transactional workload and enables organizations to combine data from multiple sources.
- Database Engine: It is a part of the engine that drives and creates the relational databases.
- Datamart: A data mart is a small part of the data warehouse that contains the summarized information.
- ETL: ETL means to extract, transform, and load. It extracts the data from multiple sources in different formats, transforms the data into an easy format, and loads the data to a final target that can be a data warehouse, data mart, etc.
Environment Setup in MSBI
1)Hardware Requirements
- a 2GHZ or faster processor is recommended.
- A minimum of 512 MB RAM or higher.
- 1GB hard disk to install all SQL Server files.
2)Software Requirements
- Any compatible OS can be used.
- As soon you will open the Windows, click on SETUP, the first option on Windows. Click on the New SQL Server stand-alone installation.
- Click on the “Components Required” option.
- Go with Instance Configuration and Server Configuration after this.
- You can use the same ID or password to install each service otherwise change the password. It depends on your convenience level.
3)Installation Steps
- It is necessary to install MSBI SQL Server before you start learning it. It will help you in practicing concepts well. The downlink link for MSBI is – microsoft.com/en-us/evalcenter/evaluate-sql-server-2014
- In the next step, choose the file type. It can be ISO, Azure, or CAB. You have to be extra careful while choosing the file type.
- Select the language that you want to prefer to install the MSBI on your system.
- Extract installation files and check for problems if any.
- Now, select the one option out of three.
- SQL Server Feature Installation
- SQL Server Power for SharePoint
- All Features with Defaults
You are strongly recommended choosing the “All Features with Defaults” option to install all possible MSBI SQL Server features.
- Once all features are installed successfully, Click on the Next option.
- This is the time to configure an instance. Here, you should choose the “Default Instance” option to continue.
- When configuring the database engine, select the Windows authentication mode.
- For analysis service configuration, choose the multidimensional and data mining option.
- Now, you have to install tools – SSIS, SSRS, SSAS.
- In the end, accept all terms and conditions. Install MSBI and you are done!
- Click on the Finish option. Congratulations, MSBI SQL Server successfully installed on your system. Good Luck.
Moving ahead, let us discuss MSBI tools in detail and how they can help you in analyzing business data thoroughly. Also, take a look at the MSBI syllabus and what you should learn to become an MSBI expert.
MSBI Tools
Microsoft provides a complete range of tools to transform your business data into information. These tools can be used from the interface of Visual Studio. These are SSIS, SSRS, and SSAS ETL tools in MSBI.
- SSIS: SQL Server Integration Services.
- SSAS: SQL Server Analytical Services.
- SSRS: SQL Server Reporting Services.

Learn MSBI Training with Industry Oriented Concepts By Expert Trainers
- Instructor-led Sessions
- Real-life Case Studies
- Assignments
1.SSIS (SQL Server Integration Services)
SSIS is an ETL tool from Microsoft. The daily customer data that visited various outlets are integrated and stored in a central database. It is done through the OLTP component of the database. The work integration means merging data from different data stores, refreshing the data in the warehouse, and cleaning the data before it is loaded to the final target.
- SSIS tool promises high-performance integration and excellent workflow solutions, including ETL operations for data warehousing.
- It utilizes a graphical tool or wizard for building or debugging packages.
- It can be used to integrate data from one database to another like SQL Server to Excel or Oracle, etc.
- The tool can be used to perform bulk transactions like adding hundreds of records to the database at once and more.
Highlights of the SSIS MSBI Tool
- SSIS is a component of Microsoft that was introduced in 20015 for the first time, and more advancements were added later as per the users’ feedback.
- The latest version of SSIS is SQL Server 2016 that includes a variety of features as per modern business needs.
- It is an important ETL tool that is used to extract data from multiple sources, transforming data, and loading it to a target database.
- The tool can be used for a variety of data integration tasks, and its main features can be given as studio environments, excellent implementation speed, and robust event handling mechanisms.
- The SSIS architecture includes five major components like control flow, data flow, package explorer, event handler, and parameters, etc.
- A few popular SSIS tasks are Execute SQL Task, Data Flow Task, Analysis Services Processing Task, Execute Package Task, Execute Process Task, File System Task, FTP Tasks, Send Mail Task, Web Service Task, etc.
- It supports wide documentation and used by large industries for robust reporting tasks.
- The major drawback of the tool is that it lacks alternative data integration styles.
2.SSAS (SQL Server Analysis Services)
SSAS is an analytical processing engine in BI that allows the creation of an OLAP database. It performs data analysis using multiple dimensions, creation of cubes from data marts, exploration of data in data warehouses and data modeling, etc. In brief, it is a multidimensional OLAP server that works as an analytics engine and allows you to play with voluminous data with ease.
Features
- It analyses data based on facts aggregations that result in shorter query response time.
- It allows multi-dimensional analysis through cubes that increases the implementation speed.
- It can display and link reports automatically.
- It can generate good data models for robust data reporting and better analysis of data.
- It ensures excellent data integrity through excellent data backups
- The organizational data is kept secure through powerful SSAS solutions.
- It is possible to work with the tool anytime, anywhere with the help of a simple internet connection.\
Data Models in SSAS
There are two popular data models in SSAS. These are the Tabular Data model and the multidimensional data model. Here is a quick comparison of both data models for your reference.
| Parameters | Tabular Data Model | Multidimensional Data Model |
|---|---|---|
| Memory | In-memory storage | File-based Storage |
| Structure | Loose structure | Rigid Structure |
| Best Features | There is no need to move data from the source. | It works just the best when data is stored into a start schema. |
| Type of Models | Relational and DAX models | Dimensional and MDX models |
| Complexity | Simple | Complex |
| Size | Small in Size | Larger in Size |
OLAP vs. OLTP data processing in SSAS
| OLAP (On-line Analytical Processing) | OLTP (On-line Transaction Processing) |
|---|---|
| It stores the current data in a production environment. | It stores the current and historical data from different locations. |
| It performs all DML operations. | It performs only READ operation. |
| It results in high availability. | It allows flexible access to data. |
| It is an example of a normalized database. | It is an example of a denormalized database. |
| It results in a frequent update of data. | It results in data updates periodically. |
Highlights of SSAS MSBI Tool
- It avoids the resource contention that may occur with the source system.
- It is just a perfect tool for numeric analysis.
- The tool works on the discovery of data patterns that are not apparent immediately with the help of data mining features.
- It offers OLAP online analytical processing using multiple data sources.
- It can be used along with different ETL tools like SSIS, SSRS, etc.
- It allows an integrated and unified view of business data reporting, KPIs analysis, and scorecards.
- You can work on a single data model at one time. It cannot be changed over time.
- It is not possible merging both data models, tabular and multidimensional.
- The tabular data model may be risky if project requirements change mid-way through the project.
- Facts aggregation should be defined in the best way.
- Cubes and measures groups should be designed and optimized well as per the business requirements.
- You should know how to use partition methods effectively.
- You should know how to write MDX queries using the best programming practices.
- The query engine cache should be used efficiently.
- Try to avoid the tabular data model until it is not required.
3.SSRS (SQL Server Reporting Services)
SRS is an enterprise reporting platform that supports traditional and interactive reports delivered over the web using custom apps. It can support multiple data sources together, either two-dimensional or multidimensional. As the name suggests, the tool is highly recommended for robust documentation and reporting. It is an efficient report generation platform, and reports generated by the tool can be used anywhere for almost any application. Here are a few highlighted features of the SSRS tool you should know.
Features
- It can retrieve data from multiple sources in different formats.
- It allows web-based access to reports as needed.
- It gives wonderful support for ad-hoc reporting.
- It has a report builder mechanism for customizing reports as per the requirement of end-users.
- The tool has easy subscription options that attract users around the globe.
- It exports features and functionalities in different formats.
- It displays reports in different ways like Tabular, Charts, Gauge, etc.
Why is the SSRS tool appreciated by Companies
Here are a few benefits or advantages of the SSRS tool that makes it a top choice for leading companies worldwide.
- The tool can be used for free, so Companies love to adopt it for basic reporting features.
- The tool gives you enterprise-level features even for the free version.
- It can be integrated with multiple databases like SQL, Oracle, Excel, and more.
- The tool can be utilized to build, distribute, and access reports over the web.
- It can work with different development programs like Visual Studio or ADO.net, etc.
- It helps in scheduling the delivery of reports automatically, and this feature is extremely helpful for people who run their reports regularly.
- The SSRS tool has a huge support community, not from Microsoft only but a plethora of users worldwide.
MSBI – Most Reliable Data Analysis Solution
With Microsoft, the total incurs with features like high availability, manageability, and business intelligence capabilities, and more is $25K only while the same can cost up to $464 with Oracle and IBM as shown in the diagram. When it comes to career opportunities, there is huge career growth in the MSBI space. As we know, the usage of the MSBI tool is on the rise these days that results in a plethora of career opportunities in the SQL Server domain.
Conclusion
I think now it’s clear why Power BI stands out from other BI tools.So wait not, download Power BI Desktop and see how Power BI makes it easy to combine your data, find new insights, and share them with others.
If you wish to learn Power BI and build a career in data visualization or BI, then check out our Power BI Training Certification which comes with instructor-led live training and real-life project experience. This training will help you understand Power BI in-depth and help you achieve mastery over the subject.