
- Financial Performance – A Complete Tutorial
- How Six Sigma Principles Can Progress Your Productivity – Tutorial
- Google Analytics Pro Tutorial | Fast Track your Career
- Activity-Based Costing Tutorial | Know about Definition, Process, & Example
- Create a workbook in Excel Tutorial | Learn in 1 Day
- Excel ROUNDUP Formula Tutorial | Learn with Functions & Examples
- Business Analytics with Excel Tutorial | Learn In 1 Day
- SAP Tutorial – Free Guide Tutorial & REAL-TIME Examples
- IBM SPSS Statistics Tutorial: Getting Started with SPSS
- SAP Security Tutorial | Basics & Definition for Beginners
- SAP Simple Finance Tutorial | Ultimate Guide to Learn [Updated]
- SAP FIORI Tutorial | Learn in 1 Day FREE
- Introduction to Business Analytics with R Tutorial | Ultimate Guide to Learn
- Tableau Desktop Tutorial | Step by Step resource guide to learn Tableau
- Implementing SAP BW on SAP HANA | A Complete Guide
- SAP HANA Administration | Free Guide Tutorial & REAL-TIME Examples
- Tableau API Tutorial | Get Started with Tools, REST Basics
- SAP FICO ( Financial Accounting and Controlling ) Tutorial | Complete Guide
- Alteryx Tutorial | Step by Step Guide for Beginners
- Getting started with Amazon Athena Tutorial – Serverless Interactive | The Ultimate Guide
- Introduction to Looker Tutorial – A Complete Guide for Beginners
- Sitecore Tutorials | For Beginners Learn in 1 Day FREE |Ultimate Guide to Learn [UPDATED]
- Adobe Analytics Tutorial – The Ultimate Student Guide
- Splunk For Beginners – Learn Everything About Splunk with Free Online Tutorial
- An Overview of SAP HANA Tutorial: Learn in 1 Day FREE
- Statistical Package for the Social Sciences – SPSS Tutorial: The Ultimate Guide
- Splunk For Beginners – Learn Everything About Splunk with Free Online Tutorial
- Pentaho Tutorial – Best Resources To Learn in 1 Day | CHECK OUT
- Statistical Package for the Social Sciences – SPSS Tutorial: The Ultimate Guide
- An Overview of SAP HANA Tutorial: Learn in 1 Day FREE
- Spotfire Tutorial for Beginners | Quickstart – MUST- READ
- JasperReports Tutorial: Ultimate Guide to Learn [BEST & NEW]
- Charts and Tables – Qlikview Tutorial – Complete Guide
- TIBCO Business Works | Tutorial for Beginners – Learn From Home
- Cognos TM1 Tutorial : Learn Cognos from Experts
- Kibana
- Power BI Desktop Tutorial
- Tableau Tutorial
- SSAS Tutorial
- Creating Tableau Dashboards
- MDX Tutorial
- Tableau Cheat Sheet
- Analytics Tutorial
- Lean Maturity Matrix Tutorial
- MS Excel Tutorial
- Business Analysis Certification Levels & Their Requirements Tutorial
- Solution Assessment and Validation Tutorial
- Lean Six Sigma Tutorial
- Enterprise Analysis Tutorial
- Create Charts and Objects in Excel 2013 Tutorial
- Msbi Tutorial
- MicroStrategy Tutorial
- Advanced SAS Tutorial
- OBIEE Tutorial
- Tableau Server Tutorial
- OBIA Tutorial
- Business Analyst Tutorial
- Cognos Tutorial
- Qlik Sense Tutorial
- SAP-Bussiness Objects Tutorial
- SAS Tutorial
- PowerApps Tutorial

Kibana
Last updated on 12th Oct 2020, Blog, Business Analytics, Tutorials
Kibana is an open source browser based visualization tool mainly used to analyze large volumes of logs in the form of line graph, bar graph, pie charts, heat maps, region maps, coordinate maps, gauge, goals, timelion etc. The visualization makes it easy to predict or to see the changes in trends of errors or other significant events of the input source.
Kibana works in sync with Elasticsearch and Logstash which together form the so-called ELK stack.
What is ELK Stack?
- ELK stands for Elasticsearch, Logstash, and Kibana. ELK is one of the popular log management platforms used worldwide for log analysis. In the ELK stack, Logstash extracts the logging data or other events from different input sources. It processes the events and later stores them in Elasticsearch.
- Kibana is a visualization tool, which accesses the logs from Elasticsearch and is able to display to the user in the form of line graph, bar graph, pie charts etc.
The basic flow of ELK Stack is shown in the image here

- Logstash is responsible for collecting the data from all the remote sources where the logs are filed and pushes the same to Elasticsearch.
- Elasticsearch acts as a database where the data is collected and Kibana uses the data from Elasticsearch to represent the data to the user in the form of bar graphs, pie charts, heat maps as shown below −
It shows the data on a real time basis, for example, day-wise or hourly to the user. Kibana UI is user friendly and very easy for a beginner to understand.To start working with Kibana we need to install Logstash, Elasticsearch and Kibana.
We would discuss the following installations here
- Elasticsearch Installation
- Logstash Installation
- Kibana Installation
Elasticsearch Installation
A detailed documentation on Elasticsearch exists in our library. You can check here for elasticsearch installation. You will have to follow the steps mentioned in the tutorial to install Elasticsearch.
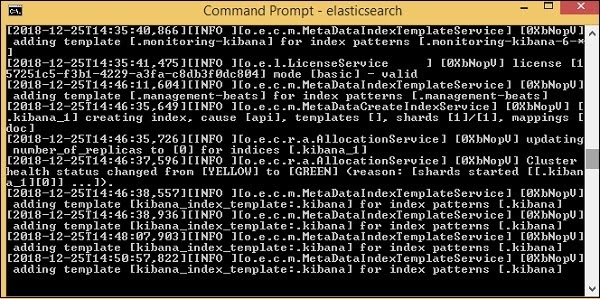
Once done with the installation, start the elasticsearch server as follows −
Step 1
For Windows
- $ cd kibanaproject/elasticsearch-6.5.4/elasticsearch-6.5.4/bin
- $ elasticsearch
Please note for windows users, the JAVA_HOME variable has to be set to the java jdk path.
For Linux
- $ cd kibanaproject/elasticsearch-6.5.4/elasticsearch-6.5.4/bin
- $ elasticsearch

The default port for elasticsearch is 9200. Once done, you can check the elasticsearch at port 9200 on localhost http://localhost:9200/as shown below −

Logstash Installation
For Logstash installation, follow this elasticsearch installation which is already existing in our library.
Kibana Installation
Go to the official Kibana site −https://www.elastic.co/products/kibana
Click the downloads link on the top right corner and it will display screen as follows −
Click the Download button for Kibana. Please note to work with Kibana we need a 64 bit machine and it will not work with 32 bit.
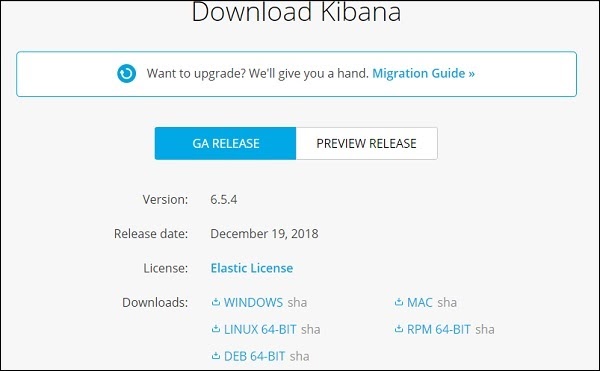
In this tutorial, we are going to use Kibana version 6. The download option is available for Windows, Mac and Linux. You can download as per your choice.
Create a folder and unpack the tar/zip downloads for kibana. We are going to work with sample data uploaded in elasticsearch. Thus, for now let us see how to start elasticsearch and kibana. For this, go to the folder where Kibana is unpacked.
Subscribe For Free Demo
Error: Contact form not found.
For Windows
- $ cd kibanaproject/kibana-6.5.4/kibana-6.5.4/bin
- $ kibana
For Linux
- $ cd kibanaproject/kibana-6.5.4/kibana-6.5.4/bin
- $ kibana
Once Kibana starts, the user can see the following screen −
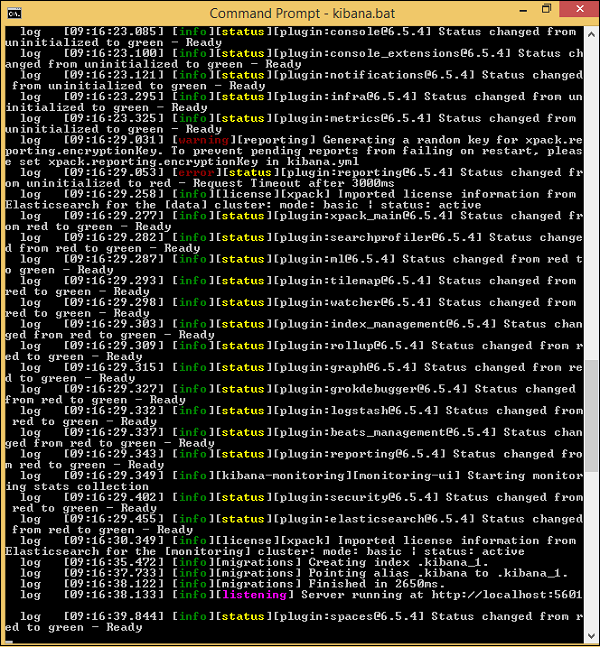
Once you see the ready signal in the console, you can open Kibana in the browser using http://localhost:5601/.The default port on which kibana is available is 5601.
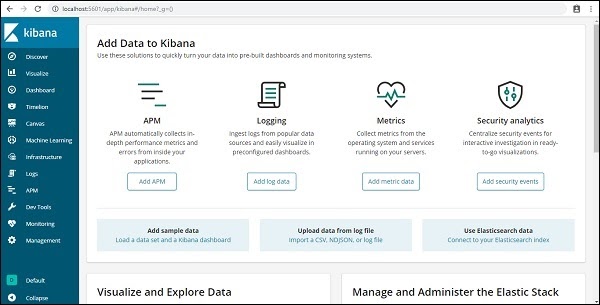
The user interface of Kibana is as shown here −
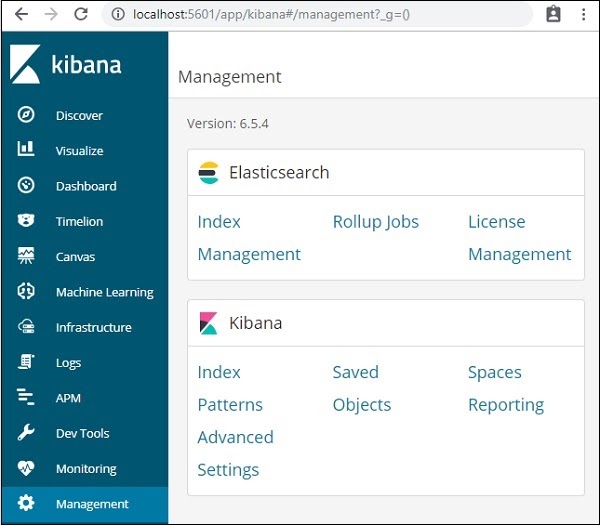
In our next chapter, we will learn how to use the UI of Kibana. To know the Kibana version on Kibana UI, go to Management Tab on the left side and it will display you the Kibana version we are using currently.
Visualize
Visualize is used for creating visualizations for the data obtained from our elasticsearch indices. These visualizations are added to dashboards for analysis purposes.
According to the Elasticsearch queries, Kibana visualisation is done. Kibana supports different types of visualisations; they are as follows:
1. Lens
It is used to create fundamental visualisations by easily dragging and dropping the required data fields.
2. Pie chart
It exhibits each source participation in the total.
3. Goal and Gauge
It shows a number denoting the advancement.
4. Maps
In Kibana, Maps are used to exhibit geographical data.
5. Vega
Vega is used to visualising the data based on the query.
Subscribe to our youtube channel to get new updates..!
6. Data Table
Displays accumulation data in a table format.
Building a Visualisation
Steps to for building a visualisation
- Step1) For building Visualisation in Kibana, we have to select the index pattern that comprises the data for which visualisation is built.
- Step2) For building visualisation from a saved search, we have to select that saved search.
- Step3) To build visualisation from rolled-up data, we will use a time bucket mechanism.
- Step4) To reduce the level of detail, we can use time aggregation for merging multiple time buckets.
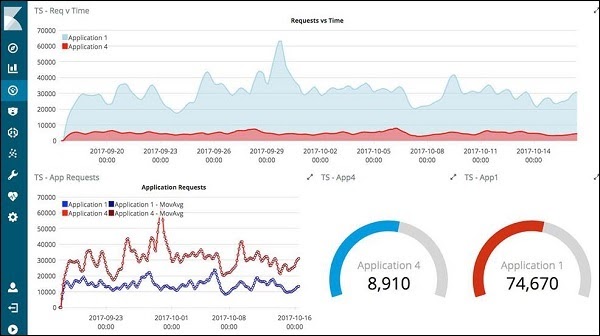
The above image exhibits different types of visualisations. We can select a visualisation based on our requirement.
Inspect Visualisations
In Kibana, we can inspect the visualisations by selecting the Inspect option in the Kibana toolbar.
Downloading Data
For downloading Data, we have to select the Download CSV option. After selecting the Download CSV, we can select the following options:
- Formatted CSV: This option is used to download the data in a table format.
- Raw CSV: This option is used to download the data as given.

Advance your Career with Kibana Training By World Class Faculty
- Instructor-led Sessions
- Real-life Case Studies
- Assignments
Sharing Visualisation
After completing your visualisation, you can share it externally. In the share menu, you can insert the code into a web page. After that, we have to share a direct link into Kibana visualisation. We have to create a PNG and PDF report.
Let us discuss some popular Visualisation formats briefly.
Kibana Lens
Kibana lens is an in-built tool created to provide quick access to details of the data to experts and naive users. To ease the exploration process of elastic search data Lens has a drag-and-drop interface. Lens assists in establishing the charts with clever suggestions.
Kibana Canvas
In Kibana, Canvas acts as a data visualisation application. Through Canvas, real-time data is retrieved from elastic search and blended with images, colours, text, etc. Through Canvas, we can design multi-page and dynamic displays.
Working with Canvas
In canvas first, we should create a work pad. Steps for creating a work pad
- Step1) After opening the Canvas, select Create Workpad
- Step2)To name your workplace, we have to go to the editor tab. Our work pad name is “workpad1”.
After creating the work pad, we have to insert elements into the work pad. For that, we have to follow the below steps:
- Step1) Select Add element and then select the image
- Step2) If we don’t have our image, an elastic logo image will appear.
- Step3) To move the image, we have to select and drag it to your desired position.
The above image shows how a work pad looks.
Kibana Dashboards
A dashboard is defined as a collection of searches, visualisations and charts. The dashboard gives you in-depth knowledge about your data.
Through the Dashboard, we can
- 1. Insert visualisations and maps for data analysis.
- 2. Organize Dashboards to exhibit the required data.
- 3. Personalize time scope to exhibit the required data.
Dashboard Preparing Techniques
When you are ready with Visualisations, you have to think about arranging the Visualisations in a Dashboard. Before preparing the dashboard, you have to think about the main objective for making the dashboard.
After determining the main objective of the dashboard, we have to collect the data from different sources. Fetching data from Multiple sources assists in getting an overview of the data, but it does not help drill down the data.
While Preparing the dashboard, we should make sure that it looks simple. The visualisations which are essential for data analysis should be added to the dashboard.
Create a Dashboard
For creating a dashboard, the data must be indexed into ElasticSearch, to obtain data from visualisations, Elastic Search, maps or saved searches. If these are not present, you are forced to include them, when you create the dashboard, or through a sample data set also we can include them.
For creating a dashboard, we have to open the Dashboard tab; then we have to select the “create new dashboard” option.
After creating the Dashboard, we have to add the elements like saved searches, visualisations, maps into the panels.
Adding Visualisations to a dashboard
After creating a dashboard, we have to arrange the visualisations in the dashboard.
Steps to be followed for creating the dashboard
- Step1) Open the Dashboard
- Step2) In the Overview Page of Dashboard, Select Create New Dashboard
- Step3) Fix a time filter like June 13th 2020 to June 20th 2020
- Step4) In the Menu bar, select Add.
- Step5) Include Map Example, Markdown Example, Bar Example.
The sample dashboard will look like as follows:
The above sample dashboard shows a Pie chart visualisation of five data items.
Kibana Plugins
The interfaces of Kibana Plugins are in a stage of continuous development. Due to this, we cannot give backward compatibility of plugins. Some of the popular Kibana Plugins are as follows:
Apps
- Own-Home: It provides Multi-Tenancy. T
- Indices View: It is used to view the information relevant to the indices.
- AI Analyst: It provides ML Visualisations, NLP Queries.
- Shard Allocation: It is used to visualise the shard allocation of Elasticsearch.
Visualisations
- 1. Bmap: This plugin is used for integrating echarts to map visualisation.
- 2. Vega-based visualisation: It supports external data sources, images, maps, etc.
Others
- 1. Kibana-API: It reveals an API used for functioning of Kibana.
- 2. Prometheus Exporter: Kibana metrics are exported in Prometheus format.
Dev-Tools
In Kibana, we will use Dev-tools to put, search, delete, post the data you want.
Creating Index Throughput” Command
PUT Command is used as follows:
PUT Kibana?Kibana1
- 1. After executing this command, an empty index Kibana is created.
- 2. After completing the creation of the Index, we have to add the data to the index.
- 3. Adding Data to New Index using “PUT” command
The data can be added as follows:
- PUT/ Kibana/Kibana1/1
- {
- “Name”: “Mindmajix”,
- “Username”: “Mind”,
- “Email”: “info@mindmajix.com”
- “CreatedOn”: “2020-05-11”
- }
In the above code:
Kibana is the name of the index
Kibana1 is the index type
“1” is the id of the entered data.
Using the “GET” Command, we can fetch the data from the index
The Syntax of GET Command is as follows:
- GET Kibana/Kibana1/1
When we execute the above command, we can get the data present in the first record.
Deleting the data from the index
In Kibana, for deleting the data from any index, we will use the delete command.
The Syntax of the “DELETE” command is as follows:
- DELETE Kibana/Kibana1/1
When we execute the above command, the data present in the first record is deleted.
Features of Kibana
Kibana offers its users the following features −
1. Visualization: Kibana has a lot of ways to visualize data in an easy way. Some of the ones which are commonly used are vertical bar chart, horizontal bar chart, pie chart, line graph, heat map etc.
2. Dashboard: When we have the visualizations ready, all of them can be placed on one board – the Dashboard. Observing different sections together gives you a clear overall idea about what exactly is happening.
3. Dev Tools: You can work with your indexes using dev tools. Beginners can add dummy indexes from dev tools and also add, update, delete the data and use the indexes to create visualization.
4. Reports: All the data in the form of visualization and dashboard can be converted to reports (CSV format), embedded in the code or in the form of URLs to be shared with others.
5. Filters and Search Query: You can make use of filters and search queries to get the required details for a particular input from a dashboard or visualization tool.
6. Plugins: You can add third party plugins to add some new visualization or also other UI additions in Kibana.
7. Coordinate and Region Maps: A coordinate and region map in Kibana helps to show the visualization on the geographical map giving a realistic view of the data.
8. Timelion: Timelion, also called timeline is yet another visualization tool which is mainly used for time based data analysis. To work with a timeline, we need to use simple expression language which helps us connect to the index and also perform calculations on the data to obtain the results we need. It helps more in comparison of data to the previous cycle in terms of week , month etc.
9. Canvas: Canvas is yet another powerful feature in Kibana. Using canvas visualization, you can represent your data in different colour combinations, shapes, texts, multiple pages basically called as a workpad.
Advantages of Kibana
Kibana offers the following advantages to its users −
- 1. Contains open source browser based visualization tools mainly used to analyse large volumes of logs in the form of line graph, bar graph, pie charts, heat maps etc.
- 2. Simple and easy for beginners to understand.
- 3. Ease of conversion of visualization and dashboard into reports.
- 4. Canvas visualization helps to analyse complex data in an easy way.
- 5. Timelion visualization in Kibana helps to compare data backwards to understand the performance better.
Disadvantages of Kibana
- 1. Adding plugins to Kibana can be very tedious if there is a version mismatch.
- 2. You tend to face issues when you want to upgrade from older version to a new one