
- Financial Performance – A Complete Tutorial
- How Six Sigma Principles Can Progress Your Productivity – Tutorial
- Google Analytics Pro Tutorial | Fast Track your Career
- Activity-Based Costing Tutorial | Know about Definition, Process, & Example
- Create a workbook in Excel Tutorial | Learn in 1 Day
- Excel ROUNDUP Formula Tutorial | Learn with Functions & Examples
- Business Analytics with Excel Tutorial | Learn In 1 Day
- SAP Tutorial – Free Guide Tutorial & REAL-TIME Examples
- IBM SPSS Statistics Tutorial: Getting Started with SPSS
- SAP Security Tutorial | Basics & Definition for Beginners
- SAP Simple Finance Tutorial | Ultimate Guide to Learn [Updated]
- SAP FIORI Tutorial | Learn in 1 Day FREE
- Introduction to Business Analytics with R Tutorial | Ultimate Guide to Learn
- Tableau Desktop Tutorial | Step by Step resource guide to learn Tableau
- Implementing SAP BW on SAP HANA | A Complete Guide
- SAP HANA Administration | Free Guide Tutorial & REAL-TIME Examples
- Tableau API Tutorial | Get Started with Tools, REST Basics
- SAP FICO ( Financial Accounting and Controlling ) Tutorial | Complete Guide
- Alteryx Tutorial | Step by Step Guide for Beginners
- Getting started with Amazon Athena Tutorial – Serverless Interactive | The Ultimate Guide
- Introduction to Looker Tutorial – A Complete Guide for Beginners
- Sitecore Tutorials | For Beginners Learn in 1 Day FREE |Ultimate Guide to Learn [UPDATED]
- Adobe Analytics Tutorial – The Ultimate Student Guide
- Splunk For Beginners – Learn Everything About Splunk with Free Online Tutorial
- An Overview of SAP HANA Tutorial: Learn in 1 Day FREE
- Statistical Package for the Social Sciences – SPSS Tutorial: The Ultimate Guide
- Splunk For Beginners – Learn Everything About Splunk with Free Online Tutorial
- Pentaho Tutorial – Best Resources To Learn in 1 Day | CHECK OUT
- Statistical Package for the Social Sciences – SPSS Tutorial: The Ultimate Guide
- An Overview of SAP HANA Tutorial: Learn in 1 Day FREE
- Spotfire Tutorial for Beginners | Quickstart – MUST- READ
- JasperReports Tutorial: Ultimate Guide to Learn [BEST & NEW]
- Charts and Tables – Qlikview Tutorial – Complete Guide
- TIBCO Business Works | Tutorial for Beginners – Learn From Home
- Cognos TM1 Tutorial : Learn Cognos from Experts
- Kibana
- Power BI Desktop Tutorial
- Tableau Tutorial
- SSAS Tutorial
- Creating Tableau Dashboards
- MDX Tutorial
- Tableau Cheat Sheet
- Analytics Tutorial
- Lean Maturity Matrix Tutorial
- MS Excel Tutorial
- Business Analysis Certification Levels & Their Requirements Tutorial
- Solution Assessment and Validation Tutorial
- Lean Six Sigma Tutorial
- Enterprise Analysis Tutorial
- Create Charts and Objects in Excel 2013 Tutorial
- Msbi Tutorial
- MicroStrategy Tutorial
- Advanced SAS Tutorial
- OBIEE Tutorial
- Tableau Server Tutorial
- OBIA Tutorial
- Business Analyst Tutorial
- Cognos Tutorial
- Qlik Sense Tutorial
- SAP-Bussiness Objects Tutorial
- SAS Tutorial
- PowerApps Tutorial

Tableau API Tutorial | Get Started with Tools, REST Basics
Last updated on 10th Aug 2022, Blog, Business Analytics, Tutorials
Introduction:
Tableau Technology for the most part delivers the API’s for the desired developers at intervals the creation of recent experiences. It put together helps to extend the probabilities of Tableau for the developers to share, support and act during a sensible manner. Tableau is glad to deliver the distinctive platform to supply several choices and adaptableness to the people moreover. it’s completely relating to sanctionative the developers to make a singular trendy experiences for the purchasers with ease and understand the desired information. it’s all relating to sanctionative the automation and simplification to deploy Tableau. Certainly, it’s with unleashing opportunities for the developers to integrate embedded analytics into every corner of the business to boost revenues.Tableau package has inherit existence that helps people to check and understand the desired information. Tableau for the most part helps for anyone to research, visualize and sharing of knowledge that’s completed during a in no time manner. Most of the Organizations are investment throughout this Tableau technology to amass quick results with Tableau and boost revenues to need it into next advanced level.
Requirements for Tableau in Microsoft OS:
- Microsoft Windows 8/8.1.
- Windows 10(x64) a pair of GB memory.
- 1.5 GB minimum free area.
- CPUs ought to support SSE4.2 and POPCNT instruction sets.
How does Tableau actually function?
Tableau’s primary purpose is to create visualisations of data in such a way as to facilitate improved comprehension and analysis of data by its users. Tableau begins with the data by connecting to the data source in one of its many ways and then extracting the data that is of relevance to the user. Both locally stored files and database connections to remote servers are supported types of data sources in Tableau.
A few instances of local data files include the following:
- Access
- Excel
- Statistical File,
- Text File, or
- The remainder of the Database files
When compared to the processing speed of the local servers, the speed of the local connection to the data source is superior.
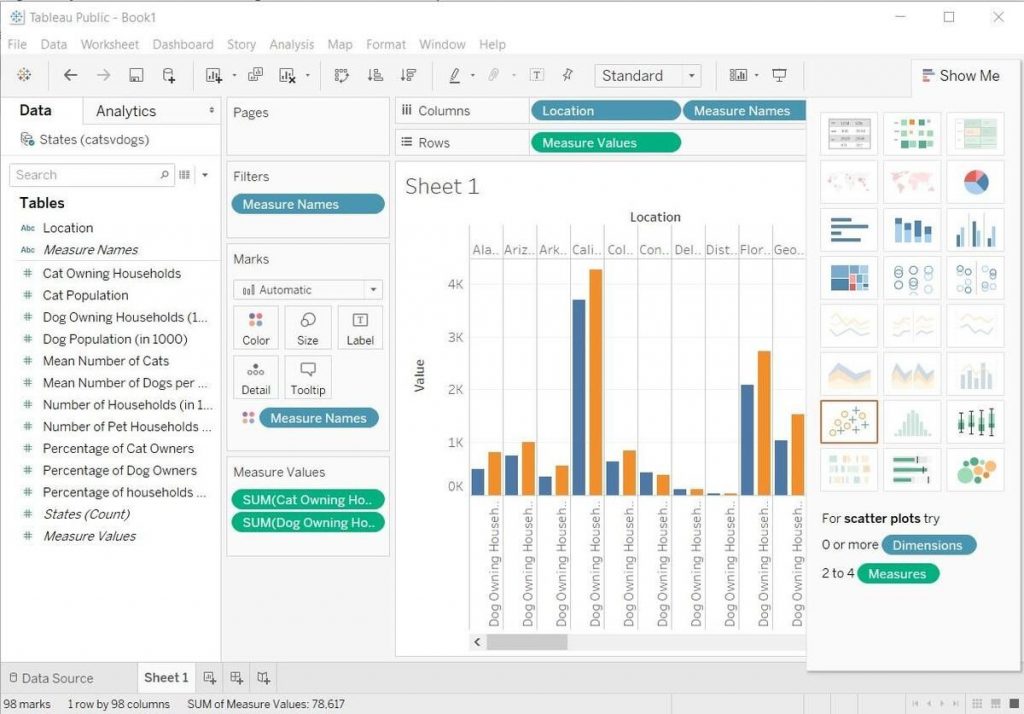
Tableau Server Version:
To possess the programming with REST API, there got to be the foremost recent version of Tableau eight.2 as a results of variety of the methodologies were further at intervals the later versions of the Tableau Server. The positive documentation for the individual API methods indicated with the foremost recent versions of mistreatment methods.API Enabled: Tableau Server is maybe place in with the rest API sanctionative by default. you will to} simply ready instead disable the rest API by mistreatment the commands of the tabadmin set.
This Tableau REST API includes the
- REST API Versions
- Permissions
- Language In and Out
- Mistreatment HTTPS(SSL and TLS)
- Filtering and Sorting
- XML Schema
- Paginating Results
- commercial enterprise Resources
- Handling Errors
- Testing and Troubleshooting
With the help of Tableau Server REST API, one can merely manage and do the desired changes with Tableau Server resources terribly} very programmatic technique.
1.Information representation:
Tableau is also a information representation tool initial and foremost. Therefore, it’s technology is there to support advanced computations, information compounding and dashboarding for the aim of creating gorgeous visualizations that deliver insights that cannot merely be derived from watching a computer program. it’s climbed to the very best of the data representation heap as a results of it’s dedication to this purpose.
2.Quickly manufacture Interactive visualizations:
Using drag-n-drop functionalities of Tableau, the user can manufacture a awfully interactive visual within minutes. The interface can handle endless variations whereas put together limiting you from creating charts that ar against information representation best practices.
3.Simple Implementation:
There are many different types of representation selections procurable in Tableau that enhance the user experience. Also, Tableau is implausibly simple to seek out out compared to Python, Business Objects and Domo, anyone whereas not having info of writing can merely learn Tableau.
4.Used for large amount of data:
Tableau can handle voluminous rows of data with ease. different types of representation is formed with associate large amount of data whereas not impacting the performance of the dashboards. Also, there is associate risk in Tableau where the user can build “live” to connections to all totally different information sources like SQL etc.
5.Scripting language :
To avoid the performance issues and to undertake to to advanced table calculations in Tableau, users can incorporate Python .Mistreatment Python script can take the load off the package by acting information cleansing tasks with packages. However, Python is not a native scripting language acceptive by Tableau. so you will import variety of the visuals or packages. However, you will see but this will be down with Python for Power number eighty three.
6.Mobile Support and Responsive Dashboard:
Tableau Dashboard incorporates a pleasant news feature that permits you to customize dashboard specifically for a certain device sort of a moveable or microcomputer. Tableau automatically understands that device is that the user is viewing the report on and build changes to create positive that the right report is served to the right device.
7.Tableau Company Strategy:
Tableau has done a superb job climb its due to the very best of data representation tools. So, according to Garner Magic Quadrant. Tableau has spent quite six years as a frontrunner. However, with the increasing interest in information science, AI, and machine learning, Tableau is additionally left behind if it doesn’t initiate quickly.
Architecture:
Data Layer:
Tableau’s ability to accommodate your own data architecture, known as the “Data Layer,” is one of its defining features. To use Tableau, your data does not need to be stored in a specific system, whether it be proprietary or not. Almost all businesses operate in a heterogeneous data environment, wherein data warehouses coexist with databases, data cubes, and flat files like Excel. The complete dataset need not be loaded into memory until it is actually needed. Tableau lets you take direct control of your investment by harnessing the full potential of your database in order to quickly and effectively address issues, provided that your existing data platforms are fast and scalable. If this isn’t the case, Tableau offers easy-to-implement solutions for making your data more suitable for use with the software’s lightning-quick in-memory data engine.
Data Connectors:
Several highly efficient data connectors for various types of databases are included. Common open database connection (ODBC) connectors are available for use with platforms that don’t have their own built-in support for connecting to databases. For dealing with data, Tableau provides two options: live connection and in-memory. Users can freely toggle between live and persistent connections in memory.
Live Connections:
With a live connection, Tableau’s data connectors manage your data architecture by sending dynamic SQL or MDX statements directly to the source database, with the exception of when you’re importing data. Live connections to data can let you reap the benefits of investments in fast, analytics-optimized databases like Vertica. As a result, Tableau receives only the summary results of the query while the underlying data remains in the source system. Tableau is the front-end analytics client to some of the largest databases in the world, therefore it can also successfully use an endless amount of data. Each connector in Tableau is optimised to take full advantage of the specific features of each data source.
In Memory:
Tableau offers a lightning-quick in-memory data engine that is analytics-optimized. Tableau allows you to connect to your data and then, with a single click, extract your data to have it in-memory. For quick replies to queries on millions of rows of data on commodity hardware, Tableau’s data engine consumes your entire machine. Since the data engine may make use of both main memory and secondary storage like discs and cache, it is not constrained by the amount of memory available to it.
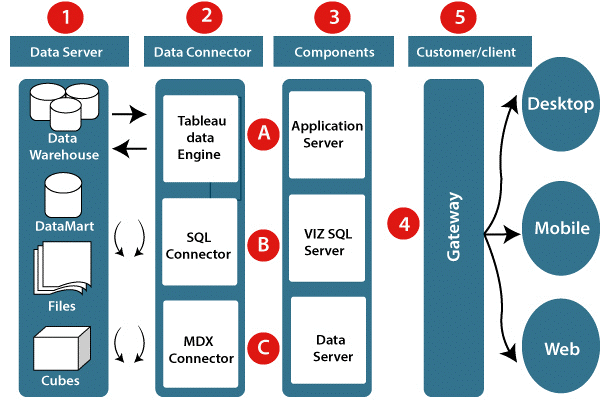
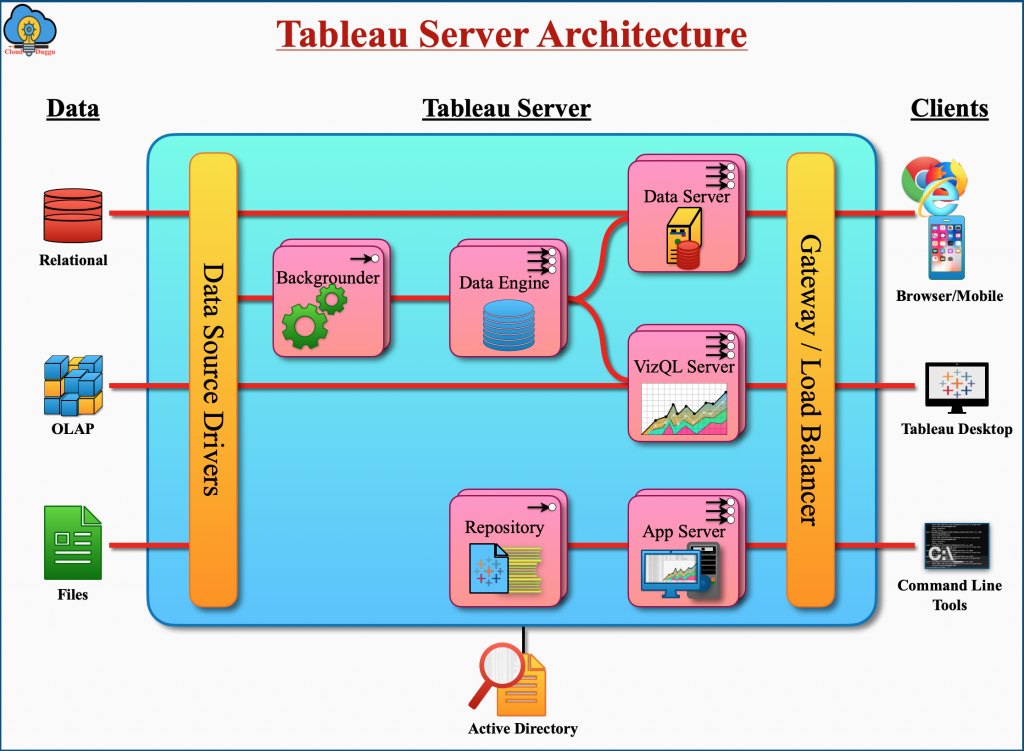
Tableau Server and Components:
Computer that serves applications:
Tableau Server’s web and mobile interfaces are held in it processes (wgserver.exe), which are responsible for browsing and permissions. A user’s session on Tableau Server begins once a view is opened in a client app. After that, the Application Server thread starts up and checks the user’s and the view’s permissions.
VizQL Server is a Visualization Query Language:
When a view becomes available, the client will notify the VizQL service of the change (vizqlserver.exe). The VizQL procedure then issues queries to the data source, receiving a set of results that are displayed as images and shown to the user. Multiple users can share the same cache on a single VizQL Server.
Data Host:
The Tableau Data Server is a centralised repository and management system for Tableau information. Metadata such as Tableau Desktop’s computations, definitions, and groups are also managed using this tool. Support for the reliability of the published data source comes from.
Backgrounder:
The extracts that are scheduled to run in the background are updated and other tasks are managed by the backgrounder.
Switch/Balancing Gate:
As the principal Tableau Server, it relays requests to all the other parts of the system. The gateway server is the first point of contact for incoming client requests, and it is responsible for directing them to the correct backend processes. For any given component, if more than one procedure has been defined, the Gateway will act as a load balancer, dividing up the requests among all of the procedures. If you only have one server, or a Gateway server, all of your processes will be housed there. Distributed systems typically include one machine acting as the main server and other “worker” servers handling various tasks. There is never more than one backup server for Tableau Server.
Clients (Web Browsers and Mobile Apps):
It provides client-facing, interactive dashboards in a web browser or native mobile app utilising zero-footprint HTML and JavaScript (AJAX). There is no need for any add-ons or plugins.
Data Types:
Tableau is capable of automatically expressing fields and assigning data types. Tableau will utilise the data type that is assigned by the data source if and only if it is available. Tableau will assign a data type automatically in the event that the data source does not specify so explicitly. The following varieties of data are supported by Tableau:
- Text values.
- Date values.
- The values for dates and times.
- Numerical values.
- The importance of geography (latitude and longitude used for maps).
- Boolean values (true/ false conditions.
Tableau Products
Understanding Tableau not just as a platform but also as an organisation is necessary to fully grasp its potential. Knowing the Tableau products that make up the platform is necessary in order to get a complete understanding of the platform as a whole. Every one of Tableau’s products is designed to work best in a particular setting, which is unique to that product. The following section will go over these products.
Tableau Desktop:
Tableau Desktop is a user-interactive dashboard environment that gives you access to all of Tableau’s outstanding capabilities so you can put them to use. You are able to connect to any kind of data source, whether it be a live source or a source on the cloud. You have the ability to generate user-friendly charts and reports using advanced analytics capabilities such as regression, correlation, and a wide variety of other drag-and-drop features. In addition to this, you can make the data into interactive maps by focusing on the “where” and “why” parts of it.
Tableau Prep:
Tableau Prep is a unique feature of Tableau that minimises the amount of manual labour required for data preparation prior to conducting data analysis. With the help of Tableau Prep Builder, the steps of cleaning, moulding, and integrating data will be completed more quickly and effectively. You will be able to share the prepared data flow and manage it uniformly across the enterprise with the help of Tableau Prep conductor, which is a component of Tableau Prep.
Tableau Online:
The user is given the ability to attain mobility in data visualisation when using Tableau Online. It offers an analytics platform that is stored in the cloud as its primary function. Anyone can access the dashboards and reports that you have developed and shared. You may also invite other members of your team as well as colleagues to investigate the features that are concealed within your dashboard. You can access data through Tabeau using either a web browser or the mobile app on your device.
Tableau Public:
This is the free version of Tableau that can be accessed through the internet. In this instance, the dashboards and the work can neither be stored locally nor on any other device; rather, everything will be stored on Tableau’s Public Cloud. Because of this, it is now possible for any user to access and download the previously saved work. Because of this, there is no protection or privacy for the data contained within this product. On the other hand, this is the greatest option for users who want to learn about Tableau and become familiar with the ecosystem in which it operates.
Tableau Reader:
Tableau Reader is the software that was developed so that users may examine the workbooks and the files that have been shared. Although the data can be filtered, the amount of alteration that can be done is restricted. Any user can view the dashboards and files that have been shared over the Tableau Server thanks to this feature. However, this does not in any way guarantee any sort of safety.
Following are the most uses and applications of Tableau:
- Business Intelligence
- Data mental image
- Data Collaboration
- Data mixing
- Real-time knowledge analysis
- Query translatioin to mental image
- To import giant size
- To produc no-code knowledge queries
- To manage giant size information
Disadvantages
1.Programing or notification of reports:
Tableau does not supply the feature of automatic refreshing of the reports with the help of programing. there is no risk of programing in Tableau. Therefore, there is forever some manual effort required once users have to be compelled to be compelled to update the data at intervals the back-end.
2.No Custom Visual Imports:
Tableau is not a full open tool. not like different tools like Power number eighty three, developers can manufacture custom visuals which is able to be merely foreign Tableau. So, any new visuals have to be compelled to be compelled to be recreated instead of foreign.
3.Custom data format in Tableau:
Tableau’s conditional data format and restricted sixteen column table displays ar pain points for users. Also, to implement an analogous data format to multiple fields there is no technique a user can do that for all fields directly. Users have to be compelled to be compelled to undertake this manually for each field that’s implausibly long.
4.Static and single value parameters:
Tableau’s parameters ar static and forever single value is elect using a parameter. Whenever the data gets changed, these parameters have to be compelled to be compelled to be updated manually once. there is no technique a user can automatize the modification of parameters.
5.Screen Resolution on Tableau Dashboards:
The layout of the dashboards gets disturbed if the tableau developer’s screen resolution is totally different from finish user’s screen resolution for instance if the dashboards are created in a very screen resolution of 1920X1080 and ar being viewed in 2560X1440 then the layout of the dashboards can get distorted a touch bit. Also, their dashboards aren’t responsive. therefore you’ll have to be compelled to produce a dashboard for mobile and desktop.
6.Restricted knowledge Preprocessing:
Tableau is strictly a mental image tool. Tableau Desktop permits you are doing to terribly basic preprocessing. This includes change of integrity and mixing knowledge. Also, you have got the power to alter knowledge varieties. In a perfect world, most knowledge would be exported in good tables. However, knowledge cleansing may be a necessary step. In most cases, associate analyst has to build an information model with revenant to format the info. this needs a tool like Altyrex, Power BI, Python or perhaps surpass to preprocess knowledge before loading. In 2018, introduced their own knowledge preparation tool known as Tableau school assignment.
7.Scaling and evaluation for Enterprise:
This is the largest issue with Tableau, it’s a awfully pricy product to scale across a giant organization. Compared to cheaper and a lot of well rounded atomic number 83 tools. Tableau one in every of the costlier possibility.