
- Financial Performance – A Complete Tutorial
- How Six Sigma Principles Can Progress Your Productivity – Tutorial
- Google Analytics Pro Tutorial | Fast Track your Career
- Activity-Based Costing Tutorial | Know about Definition, Process, & Example
- Create a workbook in Excel Tutorial | Learn in 1 Day
- Excel ROUNDUP Formula Tutorial | Learn with Functions & Examples
- Business Analytics with Excel Tutorial | Learn In 1 Day
- SAP Tutorial – Free Guide Tutorial & REAL-TIME Examples
- IBM SPSS Statistics Tutorial: Getting Started with SPSS
- SAP Security Tutorial | Basics & Definition for Beginners
- SAP Simple Finance Tutorial | Ultimate Guide to Learn [Updated]
- SAP FIORI Tutorial | Learn in 1 Day FREE
- Introduction to Business Analytics with R Tutorial | Ultimate Guide to Learn
- Tableau Desktop Tutorial | Step by Step resource guide to learn Tableau
- Implementing SAP BW on SAP HANA | A Complete Guide
- SAP HANA Administration | Free Guide Tutorial & REAL-TIME Examples
- Tableau API Tutorial | Get Started with Tools, REST Basics
- SAP FICO ( Financial Accounting and Controlling ) Tutorial | Complete Guide
- Alteryx Tutorial | Step by Step Guide for Beginners
- Getting started with Amazon Athena Tutorial – Serverless Interactive | The Ultimate Guide
- Introduction to Looker Tutorial – A Complete Guide for Beginners
- Sitecore Tutorials | For Beginners Learn in 1 Day FREE |Ultimate Guide to Learn [UPDATED]
- Adobe Analytics Tutorial – The Ultimate Student Guide
- Splunk For Beginners – Learn Everything About Splunk with Free Online Tutorial
- An Overview of SAP HANA Tutorial: Learn in 1 Day FREE
- Statistical Package for the Social Sciences – SPSS Tutorial: The Ultimate Guide
- Splunk For Beginners – Learn Everything About Splunk with Free Online Tutorial
- Pentaho Tutorial – Best Resources To Learn in 1 Day | CHECK OUT
- Statistical Package for the Social Sciences – SPSS Tutorial: The Ultimate Guide
- An Overview of SAP HANA Tutorial: Learn in 1 Day FREE
- Spotfire Tutorial for Beginners | Quickstart – MUST- READ
- JasperReports Tutorial: Ultimate Guide to Learn [BEST & NEW]
- Charts and Tables – Qlikview Tutorial – Complete Guide
- TIBCO Business Works | Tutorial for Beginners – Learn From Home
- Cognos TM1 Tutorial : Learn Cognos from Experts
- Kibana
- Power BI Desktop Tutorial
- Tableau Tutorial
- SSAS Tutorial
- Creating Tableau Dashboards
- MDX Tutorial
- Tableau Cheat Sheet
- Analytics Tutorial
- Lean Maturity Matrix Tutorial
- MS Excel Tutorial
- Business Analysis Certification Levels & Their Requirements Tutorial
- Solution Assessment and Validation Tutorial
- Lean Six Sigma Tutorial
- Enterprise Analysis Tutorial
- Create Charts and Objects in Excel 2013 Tutorial
- Msbi Tutorial
- MicroStrategy Tutorial
- Advanced SAS Tutorial
- OBIEE Tutorial
- Tableau Server Tutorial
- OBIA Tutorial
- Business Analyst Tutorial
- Cognos Tutorial
- Qlik Sense Tutorial
- SAP-Bussiness Objects Tutorial
- SAS Tutorial
- PowerApps Tutorial

Tableau Cheat Sheet
Last updated on 08th Oct 2020, Blog, Business Analytics, Tutorials
Tableau is one of the hottest tools for data visualizations and data interpretation. Having a handy reference, containing all the basics of Tableau Desktop will only make your work easier, faster and spare you some time while working with Tableau.
Keeping that in mind, we at Intellipaat have come up with this tableau desktop Cheat Sheet for you to make your experience with Tableau even better.
This cheat sheet has been designed, assuming that you have a basic idea about what is Tableau and why is it used. This cheat sheet will provide you all the basics of Tableau desktop that you need to know to get started with Tableau
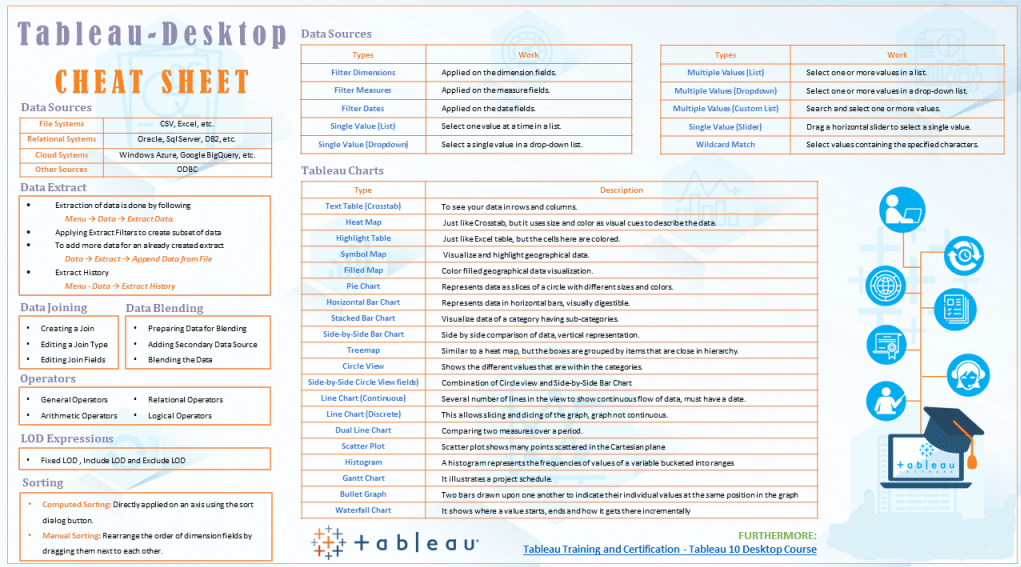
Tableau connects to all popular types of data sources, you can perform management tasks on the data sources:
| File Systems | CSV, Excel, etc. |
| Relational Systems | Oracle, Sql Server, DB2, etc. |
| Cloud Systems | Windows Azure, Google BigQuery, etc. |
| Other Sources | ODBC |
Subscribe For Free Demo
Error: Contact form not found.
Data Extract:
Extracts of tableau data is a compressed snapshot of the data. You can use these extracts to employ a tableau functionality that is not available or supported in the original data.
- Extraction of data is done by following:
Menu → Data → Extract Data.
- Applying Extract Filters to create subsets of data.
Data →Extract Data →Filter →select from the list
- To add more data for an already created extract:
Data → Extract → Append Data from File
- Extract History:
Menu – Data → Extract History
Data Joining:
Sometimes you will need to join data from different sources or tables in order to perform data analysis tasks. Tableau also provides the following data joining functionalities:
- Creating a Join
- Editing a Join Type
- Editing Join Fields

Data Blending:
Tableau also provides data blending functionality. You can use this feature if you find that there is related data in different data sources and you want to analyze all that related data together in a single view
- Preparing Data for Blending
- Adding Secondary Data Source
- Blending the Data
Operators:
Tableau has a few operators as well. Operators are used to perform logical or mathematical manipulations. In tableau, these operators help create calculated fields and formulae.
- General Operators
- Arithmetic Operators
- Relational Operators
- Logical Operators
LOD Expressions:
Tableau introduced level of detail expressions or LOD expressions. LOD gives even more control over data on the data source level
- Fixed LOD
- Include LOD
- Exclude LOD
Sorting:
You can also perform sorting on your data in Tableau using following two ways of sorting:
- Computed Sorting: Directly applied on an axis using the sort dialog button.
- Manual Sorting: Rearrange the order of dimension fields by dragging them next to each other.

Filters:
As discussed above, you can use filters in your extracted data, mainly to restrict the number of records you want to work on. There are multiple filters available in Tableau based on the type of purpose of these filters
| Types | Work |
|---|---|
| Filter DimensionsFilter MeasuresFilter DatesSingle Value (List)Single Value (Dropdown)Multiple Values (List)Multiple Values (Dropdown)Multiple Values (Custom List)Single Value (Slider)Wildcard Match | Applied on the dimension fields.Applied on the measure fields.Applied on the date fields.Select one value at a time in a list.Select a single value in a drop-down list.Select one or more values in a list.Select one or more values in a drop-down list.Search and select one or more values.Drag a horizontal slider to select a single value.Select values containing the specified characters. |
Tableau Charts:
In Tableau, you can create different interactive visuals for data interpretation. Following is the list of Tableau charts along with their description:
| Type | Description |
|---|---|
| Text Table (Crosstab) | To see your data in rows and columns. |
| Heat Map | Just like Crosstab, but it uses size and color as visual cues to describe the data. |
| Highlight Table | Just like Excel tables, but the cells here are colored. |
| Symbol Map | Visualize and highlight geographical data. |
| Filled Map | Color filled geographical data visualization. |
| Pie Chart | Represents data as slices of a circle with different sizes and colors. |
| Horizontal Bar Chart | Represents data in horizontal bars, visually digestible. |
| Stacked Bar Chart | Visualize data of a category having sub-categories. |
| Side-by-Side Bar Chart | Side by side comparison of data, vertical representation. |
| Treemap | Similar to a heat map, but the boxes are grouped by items that are close in hierarchy. |
| Circle View | Shows the different values that are within the categories. |
| Side-by-Side Circle View fields) | Combination of Circle view and Side-by-Side Bar Chart |
| Line Chart (Continuous) | Several numbers of lines in the view to show continuous flow of data, must have a date. |
| Line Chart (Discrete) | This allows slicing and dicing of the graph, graph not continuous. |
| Dual Line Chart | Comparing two measures over a period. |
| Scatter Plot | Scatter plot shows many points scattered in the Cartesian plane |
| Histogram | A histogram represents the frequencies of values of a variable bucketed into ranges |
| Gantt Chart | It illustrates a project schedule. |
| Bullet Graph | Two bars drawn upon one another to indicate their individual values at the same position in the graph |
| Waterfall Chart | It shows where a value starts, ends and how it gets there incrementally |
That would be all for this tableau Desktop cheat sheet. If you are interested in data analysis and business intelligence then learning Tableau is a smart choice for you. Check out the Tableau training and certification provided by Intellipaat where you will get to learn data visualizations and building tableau dashboards and prepare yourself for the industry by going through this top Tableau Interview Questions and Answers! In this Tableau certification training you will also learn Tableau desktop and public integration with R & Big data. You can reach out to us in case you have any queries and we will be there to help you with that, at no extra cost!
Tableau User Handbook
Tableau is one of the hottest tools for data visualizations and data interpretation. Having a handy reference, containing all the basics of Tableau Desktop will only make your work easier, faster and spare you some time while working with Tableau.
Keeping that in mind, we at Intellipaat have come up with this tableau desktop Cheat Sheet for you to make your experience with Tableau even better.
This cheat sheet has been designed, assuming that you have a basic idea about what is Tableau and why is it used. This cheat sheet will provide you all the basics of Tableau desktop that you need to know to get started with Tableau
Data Sources:
Tableau connects to all popular types of data sources, you can perform management tasks on the data sources:
| File Systems | CSV, Excel, etc. |
| Relational Systems | Oracle, Sql Server, DB2, etc. |
| Cloud Systems | Windows Azure, Google BigQuery, etc. |
| Other Sources | ODBC |
Data Extract:
Extracts of tableau data is a compressed snapshot of the data. You can use these extracts to employ a tableau functionality that is not available or supported in the original data.
- Extraction of data is done by following:
Menu → Data → Extract Data.
- Applying Extract Filters to create subsets of data.
Data →Extract Data →Filter →select from the list
- To add more data for an already created extract:
Data → Extract → Append Data from File
- Extract History:
Menu – Data → Extract History
Data Joining:
Sometimes you will need to join data from different sources or tables in order to perform data analysis tasks. Tableau also provides the following data joining functionalities:
- Creating a Join
- Editing a Join Type
- Editing Join Fields

Data Blending:
Tableau also provides data blending functionality. You can use this feature if you find that there is related data in different data sources and you want to analyze all that related data together in a single view
- Preparing Data for Blending
- Adding Secondary Data Source
- Blending the Data
Operators:
Tableau has a few operators as well. Operators are used to perform logical or mathematical manipulations. In tableau, these operators help create calculated fields and formulae.
- General Operators
- Arithmetic Operators
- Relational Operators
- Logical Operators
LOD Expressions:
Tableau introduced level of detail expressions or LOD expressions. LOD gives even more control over data on the data source level
- Fixed LOD
- Include LOD
- Exclude LOD
Sorting:
You can also perform sorting on your data in Tableau using following two ways of sorting:
- Computed Sorting: Directly applied on an axis using the sort dialog button.
- Manual Sorting: Rearrange the order of dimension fields by dragging them next to each other.

Filters:
As discussed above, you can use filters in your extracted data, mainly to restrict the number of records you want to work on. There are multiple filters available in Tableau based on the type of purpose of these filters
| Types | Work |
|---|---|
| Filter DimensionsFilter MeasuresFilter DatesSingle Value (List)Single Value (Dropdown)Multiple Values (List)Multiple Values (Dropdown)Multiple Values (Custom List)Single Value (Slider)Wildcard Match | Applied on the dimension fields.Applied on the measure fields.Applied on the date fields.Select one value at a time in a list.Select a single value in a drop-down list.Select one or more values in a list.Select one or more values in a drop-down list.Search and select one or more values.Drag a horizontal slider to select a single value.Select values containing the specified characters. |
Tableau Charts:
In Tableau, you can create different interactive visuals for data interpretation. Following is the list of Tableau charts along with their description:
| Type | Description |
|---|---|
| Text Table (Crosstab) | To see your data in rows and columns. |
| Heat Map | Just like Crosstab, but it uses size and color as visual cues to describe the data. |
| Highlight Table | Just like Excel tables, but the cells here are colored. |
| Symbol Map | Visualize and highlight geographical data. |
| Filled Map | Color filled geographical data visualization. |
| Pie Chart | Represents data as slices of a circle with different sizes and colors. |
| Horizontal Bar Chart | Represents data in horizontal bars, visually digestible. |
| Stacked Bar Chart | Visualize data of a category having sub-categories. |
| Side-by-Side Bar Chart | Side by side comparison of data, vertical representation. |
| Treemap | Similar to a heat map, but the boxes are grouped by items that are close in hierarchy. |
| Circle View | Shows the different values that are within the categories. |
| Side-by-Side Circle View fields) | Combination of Circle view and Side-by-Side Bar Chart |
| Line Chart (Continuous) | Several numbers of lines in the view to show continuous flow of data, must have a date. |
| Line Chart (Discrete) | This allows slicing and dicing of the graph, graph not continuous. |
| Dual Line Chart | Comparing two measures over a period. |
| Scatter Plot | Scatter plot shows many points scattered in the Cartesian plane |
| Histogram | A histogram represents the frequencies of values of a variable bucketed into ranges |
| Gantt Chart | It illustrates a project schedule. |
| Bullet Graph | Two bars drawn upon one another to indicate their individual values at the same position in the graph |
| Waterfall Chart | It shows where a value starts, ends and how it gets there incrementally |
That would be all for this tableau Desktop cheat sheet. If you are interested in data analysis and business intelligence then learning Tableau is a smart choice for you. Check out the Tableau training and certification provided by Intellipaat where you will get to learn data visualizations and building tableau dashboards and prepare yourself for the industry by going through this top Tableau Interview Questions and Answers! In this Tableau certification training you will also learn Tableau desktop and public integration with R & Big data. You can reach out to us in case you have any queries and we will be there to help you with that, at no extra cost!