
- What is Lean?| Everything You Need to Know
- What is SAP Workflow? : A Complete Guide
- Difference between Tableau and Power BI | Benefits and Special Features
- Data Warehouse in Tableau | Everything You Need to Know
- What is Tableau Server?| Everything You Need to Know | A Definitive Guide
- What is Dax in Power BI? | A Comprehensive Guide
- Upgrade in Tableau Desktop and Web Authoring | A Complete Guide with Best Practices
- What is SAP HANA | SAP HANA Database Connection | All you need to know [ OverView ]
- SAP BPC – What is Business Planning and Consolidation? : All you need to know [ OverView ]
- Root Cause Analysis: Definition, Examples & Methods | All you need to know [ OverView ]
- Seven Basic Quality Improvement Ishikawa Tools | Important asset to control quality in your project [OverView]
- What is Power BI | Its Use Cases and Applications | All you need to know [ OverView ]
- How and why to measure and analyze employee productivity | Everything You Need to Know
- Top 10 Employee Retention Strategies | Everything You Need to Know
- What are LookML Projects and the Developer Mode | How to Create LookML Projects?
- What are Slowly Changing Dimension | SCD Types and Implementations | Step-By-Step Process
- What is Pareto Chart and How to Create Pareto Chart | A Complete Guide For Beginners
- What does an Agile Business Analyst do | Required Skills, Roles and Responsibilities [ Job & Future ]
- What is Lean Management? | Role and Concepts of Lean Management | Expert’s Top Picks
- A Definitive Guide of Working Capital Management with Best Practices & REAL-TIME Examples
- Business Analytics with Excel Fundamentals | A Complete Guide For Beginners
- Business Analyst : Job Description | All you need to know [ Job & Future ]
- How to create a Splunk Dashboard | A Complete Guide For Beginners [ OverView ]
- What is Splunk Logging ? | The Ultimate Guide with Expert’s Top Picks
- Alteryx vs Tableau | Know Their Differences and Which Should You Learn?
- What is Predictive Analytics? : Step-By-Step Process with REAL-TIME Examples
- An Overview of SAS Stored Processes | The Ultimate Guide with Expert’s Top Picks
- How to Create Conditional Formatting in Cognos Report Studio | A Complete Guide
- Difference between OLTP vs OLAP | Know Their Differences and Which Should You Learn?
- ECBA vs CCBA vs CBAP | A Complete Guide For Beginners | Know Their Differences and Which Should You Learn?
- Import Custom Geocode Data in Tableau | Everything You Need to Know [ OverView ]
- Data Warehouse Tools : Features , Concepts and Architecture
- PGDM vs MBA | Know Their Differences and Which Should You Learn?
- Most Popular Data Visualization Tools | A Complete Beginners Guide | REAL-TIME Examples
- Tableau vs Looker : Comparision and Differences | Which Should You Learn?
- Benefits of Employee Satisfaction for the Organization [ Explained ]
- DAX In Power BI – Learn Power BI DAX Basics [ For Freshers and Experience ]
- Power Bi vs Tableau : Comparision and Differences | Which Should You Learn?
- What is Alteryx Tools | Alteryx ETL Tools | Comprehensive Guide
- What is Tableau Prep? : Comprehensive Guide | Free Guide Tutorial & REAL-TIME Examples
- What are Business Intelligence Tools ? : All you need to know [ OverView ]
- Tableau Aggregate Functions | A Complete Guide with REAL-TIME Examples
- Intervalmatch Function in Qlikview | Everything You Need to Know [ OverView ]
- QlikView Circular Reference | Free Guide Tutorial & REAL-TIME Examples
- Data Blending in Tableau | A Complete Guide with Best Practices | Free Guide Tutorial [ OverView ]
- Splunk vs ELK | Differences and Which Should You Learn? [ OverView ]
- QlikSense vs QlikView | Differences and What to learn and Why?
- What Is Measurement System Analysis | Required Skills | Everything You Need to Know
- Splunk Timechart | Free Guide Tutorial & REAL-TIME Examples
- What Is Image Processing ? A Complete Guide with Best Practices
- What is a Business Analysis ? A Complete Guide with Best Practices
- Top Business Analytics Tools | Comprehensive Guide
- Business Analyst Career Path [ Job & Future ]
- Time Series Analysis Tactics | A Complete Guide with Best Practices
- What is Splunk ? Free Guide Tutorial & REAL-TIME Examples
- Which Certification is Right for You: Six Sigma or Lean Six Sigma?
- SAS Vs R
- Top Technology Trends for 2020
- Data Analyst vs. Data Scientist
- What are the Essential Skills That You Need to Master in Data Analyst?
- What is Six Sigma?
- Common Cause Variation Vs Special Cause Variation
- Reasons to Get a Six Sigma Certification
- What Is Strategic Enterprise Management and its Components?
- What Are The Benefits Measurement Constrained Optimization Methods?
- What Is the Benefit of Modern Data Warehousing?
- What Is Corporate Social Responsibility (CSR)?
- What Is The Purpose and Importance Of Financial Analysis?
- What is Insights-as-a-Service (IaaS)?
- Business Analytics With R Programming Languages
- Where Are The 8 Hidden Wastes?
- What Are Market Structures?
- What is Cost of Quality (COQ)?
- What is Build Verification Testing?
- Quality Improvement in Six Sigma
- What is Process Capability Analysis?
- How To Measure The Effectiveness Of Corporate Training
- SAP Financials And SAP Accounting Modules
- Tips to Learn Tableau
- Why Should I Become a CBAP?
- History And Evolution of Six Sigma
- How to use Control Chart Constants?
- Data Analytics Course For Beginners
- How to Build a Successful Data Analyst Career?
- Data Analytics Vs Business Analytics
- What is SAP Certification?
- Books To Read For a Six Sigma Certification
- Six Sigma Green Belt Salary
- What is the ASAP Methodology?
- Complete list of SAP modules

How To Measure The Effectiveness Of Corporate Training
Last updated on 02nd Oct 2020, Artciles, Blog, Business Analytics
Subscribe For Free Demo
Error: Contact form not found.
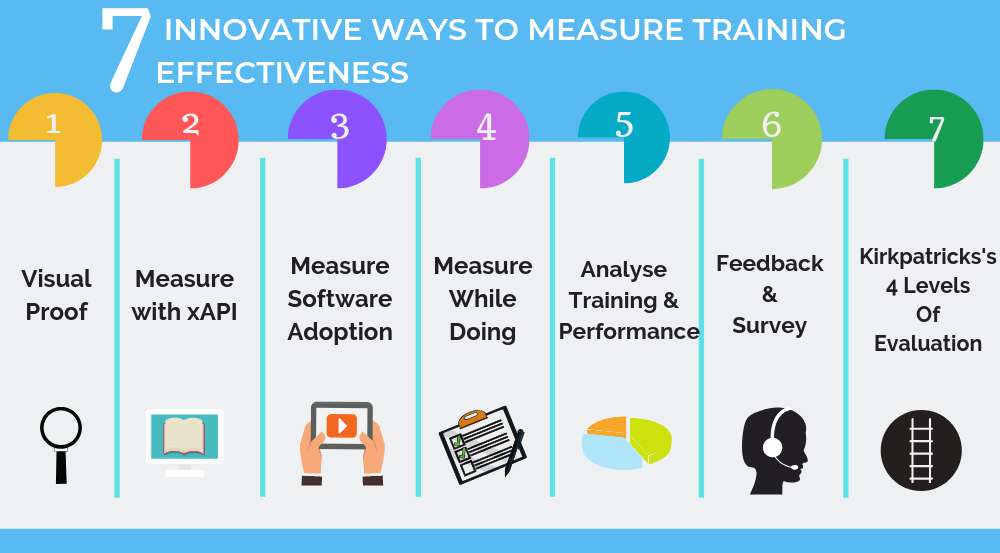
Innovative Ways To Measure Training
Traditional means of measurement just can’t cut the mustard anymore. Analysis methodologies need to play catch up with the proliferation of new and dynamic training technologies including microlearning, mobile, gamified learning and social learning. And each of these need a different evaluation approach; usually a mix of quantitative and qualitative metrics.
What’s more, according to a McKinsey report, the impact of your learning strategy should depend on key performance indicators (KPIs) such as sync of L&D initiatives with business priorities (business excellence) and if learning changes people’s behavior or performance (learning excellence). Another important KPI to track is how efficiently resources/investments are used for the corporate academy, or operational excellence.
So, apart from the basic methods such as attendance tracking, completion rates and skill assessments, it is time to consider new and engaging solutions that shed light on the effectiveness of your training programs.
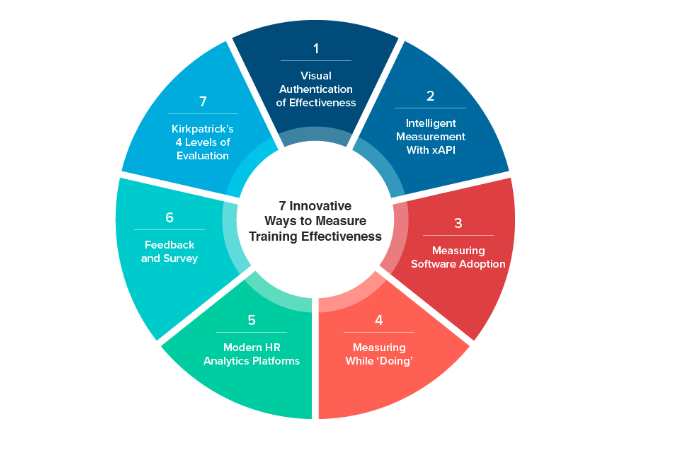
1. Visual Authentication of Effectiveness
Think of measurement as a camera and the photographs of the subject (here: employees) as the training’s test results. A series of photos taken in different light conditions, zoom and angles is what will give you a complete picture of the employee’s (learning) situation. Similarly, you can get visual confirmation about employees completing the learned tasks, in real life. Employees may upload video, audio or images as proof of a task completed, by harnessing the learnings from the workshop. Such visual proof can help you, as a manager, gauge if the training is a success and tailor future sessions accordingly.
Take, for example, the case of the L&D teams voice recording salespersons’ pitches, prior to training, and then comparing it to a clip of them on call with a prospective client after the training. The difference in the quality of the pitch can help L&D managers make improvements in future training modules. This has become so much more detailed and easy with the ML-based automation platforms for sales that can do this analysis based on the keywords/phrases/pitch/call structure.
2. Intelligent Measurement with xAPI
Learning happens anywhere and anytime, nowadays; which is great for learners but poses issues with tracking for the L&D team. It’s the growing popularity of such blended, adaptive, long-term and interactive learning experiences that led to the advent of Experience API (xAPI). xAPI (formerly known as Tin Can) content standards aids in the production of personalized training content modules. Apart from being the latest buzzword in the learning circuit, xAPI can exactly tell you exactly where learning is happening, powered by analytics & reporting features. This communications protocol tracks learning-related activity from different sources, within and without the LMS, and stores it in a Learning Record Store (LRS). This means richer insights are mined that allows L&D teams to understand, in depth, the effectiveness of training imparted.
Digital adoption platform, Whatfix, harnesses xAPI to understand how users engage with your training, and leverage insights to improve the learning experience. It also presents metrics on content usage, user engagement, and the relevance of help-content.
The vast and granular data gathered through xAPIs allow trainers to decide how training content can be edited in real-time ( as employees work), as the system ‘knows’ individual learning preferences and knowledge levels. Consequently, the attention of time of learners can be directed at relevant concepts, as the rest is automatically removed from the course.
3. Measuring Software Adoption
The corporate L&D department covers a range of training needs such as soft-skills, technical, functional training and software training. For software training, measuring product adoption, before and after the training is a very useful way to learn how effective your software training was. This is indeed a completely outcome based way to measure training effectiveness. Most software tools provide information on metrics such as how much time users spent in the system, how many activities were successfully completed etc. These dashboards give a glimpse into how well users are engaging with the software and hence how well they are applying their learnings.
4. Measuring While ‘Doing’
New-age tools, such as microlearning platforms, can empower you to collect details on how employees are engaging with learning content, during their work. Microlearning solutions gather a host of data on how users are engaging with the training content. Since microlearning is much more trackable (not to mention is more engaging for employees), companies are increasingly converting their training programs into these byte-sized learning content, wherever it makes sense to track
This is how WIPRO, a leading global IT, consulting & business process services company, leveraged Whatfix to augment their sales training and hence understand how their sales-reps are leveraging their sales systems (such as CRM, sales portal, knowledge management system). The SaaS based platform tracked how many times salespersons accessed the in-app contextual walkthroughs, in real time, to identify the gaps that training left. Such advanced analytics also played a critical role in delivering an optimized learning experience and improving sales productivity. You can also gather user feedback in real-time, right at the time they accessed training and applied it to work.
5. Modern HR analytics Platforms
An MIT Sloan Management Review article states that 65% of organizations are effective at capturing data, but only 46% are able to effectively secure insights from it.
Enter: Modern HR analytics platforms. These tech solutions allow you to find and measure the link between training and performance. Once user data is collected from various sources and stored in a centralized repository, such tools help generate actionable insights that can improve training effectiveness. For example, Visier People: Learning is a tool that can predict the time required to get your workforce compliant so that you can optimize compliance training capacity and reduce the risk of adversely affecting workforce productivity.
It can also spot trends from a sea of training data to understand the full impact of all your learning activity. Thus, it helps answer questions, such as: How is L&D impacting employee retention or engagement? And what learning efforts are unable to drive strong business results? For a forward-looking corporate learning department that’s serious about helping drive the business forward, this is a gold mine of information.
6. Feedback and Survey
While they may seem like the most basic forms of evaluation, they are also extremely critical to getting the answers that will determine if your training program has been a success or not. The innovation here is to collect feedback in real-time, so that the training is measured immediately and remedies are implemented without any delays. Whatfix does this by intelligently gathering feedback on each walkthrough training to determine where your content creation efforts will give the best results. And the SaaS platform also integrates with survey tools to gather user feedback from specific locations (in-app) to assure higher response rates.
You can also decode the relationship your learners have with the course with Net Promoter Score (NPS) rating [1 to 10]. This benchmark that is commonly used in customer satisfaction analyses is also helpful in evaluating e-learning effectiveness. It is derived from your employees’ answer to the question: “How likely is it that you would recommend [our training session] to a friend or colleague? The score they assign to your training course can also help you identify what environmental factors contributed to an individual learner’s positive and negative reactions.
7. Kirkpatrick’s 4 Levels of Evaluation
No article on ‘how to measure training effectiveness’ is complete without mention of this model that takes into account every style of training. Though it was developed way back in the 1950s, it retains freshness and relevance even today. The fundamentals of the model are as follows:
1.Reaction – Understand learner satisfaction through feedback forms.
2. Learning – Gauge the understanding of a topic and degree of skill development by taking pre and post-test measures and hands-on assignments. This helps understand if the training objectives were met.
3. Behavior – Evaluate if employees are able to apply learning from the training into everyday work. Examples are in-field inspections or evaluations from participants’ managers.
4. Results – Check if the business objectives (such as greater productivity and fewer errors) linked to corporate training are being met. For instance the telecommunications giant, Motorola recognized that they were able to attain a 30% increase in employee productivity for every dollar spent on training. They were able to calculate that this heightened productivity, in turn, helped them cut costs and hike profits by 47%.
Conclusion
Every organization, with their unique needs, will employ different methods that meet their learning and business goals. But no matter what methodology you choose, make sure that you religiously measure the training efforts.