
- What is Dividends ? and How do They Work | Everything You Need to Know | Expert’s Top Picks
- Interest Rate Risk – How to Mitigate the Risk | A Complete Guide For Beginners
- What Is Capital Budgeting and Cash Flow in Finance Management?
- Treynor Measure Vs Sharpe Measure
- Binomial Option Pricing Model
- What is Financial Risk and Its Types?
- The Most In-demand and Highest Paying Jobs in Canada

Treynor Measure Vs Sharpe Measure
Last updated on 06th Oct 2020, Artciles, Blog, Investment Banking
The Sharpe ratio and the Treynor ratio are two ratios used to measure the risk-adjusted rate of return. Both are named for their creators, Nobel Prize winner William Sharpe and American economist Jack Treynor, respectively. While they may help investors understand investments and risk, they offer different approaches to evaluating investment performance. The Sharpe ratio helps investors understand an investment’s return compared to its risk while the Treynor ratio explores the excess return generated for each unit of risk in a portfolio.
How the Sharpe Ratio Works
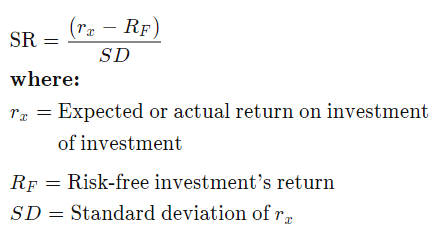
First developed in 1966 and revised in 1994, the Sharpe ratio aims to reveal how well an asset performs compared to a risk-free investment. The common benchmark used to represent that risk-free investment is U.S. Treasury bills or bonds, especially the 90-day Treasury bill. The Sharpe ratio calculates either the expected or actual return on investment for an investment portfolio (or even an individual equity investment), subtracts the risk-free investment’s return, then divides that number by the standard deviation for the investment portfolio. Generally, the greater the value of the Sharpe ratio, the more attractive the risk-adjusted return.
The expected or actual rate of return can be measured in any frequency, as long as the measurement is consistent. Once the expected or actual rate of return is
subtracted from the risk-free investment return, it can then be divided by the standard deviation. The higher the deviation, the better the return.
The primary purpose of the Sharpe ratio is to determine whether you are making a significantly greater return on your investment in exchange for accepting the additional risk inherent in equity investing as compared to investing in risk-free instruments.
How the Treynor Ratio Works
Subscribe For Free Demo
Error: Contact form not found.
Developed around the same time as the Sharpe ratio, the Treynor ratio also seeks to evaluate the risk-adjusted return of an investment portfolio, but it measures the portfolio’s performance against a different benchmark. Rather than measuring a portfolio’s return only against the rate of return for a risk-free investment, the Treynor ratio looks to examine how well a portfolio outperforms the equity market as a whole. It does this by substituting beta for standard deviation in the Sharpe ratio equation, with beta defined as the rate of return due to overall market performance.
For example, if a standard stock market index shows a 10% rate of return—that constitutes beta. An investment portfolio showing a 13% rate of return is then, by the Treynor ratio, only given credit for the extra 3% return that it generated over and above the market’s overall performance. The Treynor ratio can be viewed as determining whether your investment portfolio is significantly outperforming the market’s average gains.
Limitations of Each Ratio
There are certain drawbacks to each of these ratios. Where the Sharpe ratio fails is that it is accentuated by investments that don’t have a normal distribution of returns like hedge funds. Many of them use dynamic trading strategies and options that can skew their returns.
The main disadvantage of the Treynor ratio is that it is backward-looking and that it relies on using a specific benchmark to measure beta. Most investments, though, don’t necessarily perform the same way in the future that they did in the past.
Differences
Both Sharpe ratio and Treynor ratio measure risk adjusted returns. The difference lies in how risk is defined in either case.
- In Sharpe ratio, risk is determined as the degree of volatility in returns – the variability in month-on-month or period-on-period returns – which is expressed through the standard deviation of the stream of returns numbers you are considering.
- In the Treynor ratio, you look at the beta of the portfolio – the degree of “momentum” that has been built into the portfolio by the fund manager in order to derive his excess returns. High momentum – or high beta (where beta is > 1) implies that the portfolio will move faster (up as well as down) than the market.
- While Sharpe ratio measures total risk (as the degree of volatility in returns captures all elements of risk – systematic as well as unsystematic),
- The Treynor ratio captures only the systematic risk in its computation.
- When one has to evaluate the funds which are sector specific, Sharpe ratio would be more meaningful. This is due to the fact that unsystematic risk would be present in sector specific funds. Hence, a truer measure of evaluation would be to judge the returns based on the total risk.
- On the contrary, if we consider diversified equity funds, the element of unsystematic risk would be very negligible as these funds are expected to be well diversified by virtue of their nature. Hence, the Treynor ratio would be more apt here.
It is widely found that both ratios usually give similar rankings. This is based on the fact that most of the portfolios are fully diversified.
To summarize, we can say that when the fund is not fully diversified, Sharpe ratio would be a better measure of performance and when the portfolio is fully diversified, Treynor ratio would better justify the performance of a fund.