
- Agile Sprint Planning | Everything You Need to Know
- What is Project Management Process ? : A Complete Guide
- What is Lean Management? : A Complete Guide
- What is ITIL ? Know about the Framework
- What is Six Sigma?| Know the tools used
- What is Kanban Training?|Know more about it
- Project Management Tools and Techniques : A Complete Guide
- What is Project Management? Everything You need to Know | Salary for the role
- Srum Org Certification? All you need to know about it
- MS Project Certification | All you need to know
- What is Project Manager? Know about the salary
- Six Sigma Certification Cost | Know all details about it
- Difference Between PMO and Project Manager? | Expert’s Top Picks
- What are Project Management Tools | Its Techniques | Everything You Need to Know
- What is Agile |Its Methodology and Types | How to Implement [ OverView ]
- What is a Product Roadmap? | How to Create one | A Complete Guide with Best Practices
- Scrum vs Kanban | Agile at Scale | New Agile BenchMark
- How to Effectively Manage Stakeholders | A Complete Guide For Beginners with Experts Top Picks
- What is Scaled Agile Framework (SAFe) | The Leading Framework For Business Agility | Everything You Need to Know
- How to Become a Project Manager | A Definitive Guide with Best Practices
- Time Management Tools to Help You Succeed as a Professional | Expert’s Top Picks
- Top 10 Tips for Agile Sprint Planning To Implement Efficient Marketing | Step-By-Step Process with REAL-TIME Examples
- What is ICP-ACC (ICAgile Certified Agile Coaching)? | A Definitive Guide with Best Practices [ OverView ]
- How To Run An Effective Agile Retrospective-Agile management | Everything You Need to Know
- What Skills Does One Acquire After The PMP Certification?
- A Definitive Guide: Most Effective and Proven Time Management Techniques [ OverView ]
- What Gaps I Filled After CSM Certification For my Scrum Project? [ OverView ]
- How to Create A Plan And Manage Your Projects Better?: Step-By-Step Process [ OverView ]
- What is User Story Mapping? : A Complete Guide with Best Practices
- What is Design Thinking ? : Benefits and Special Features | A Definitive Guide with Best Practices
- What is the Capability Maturity Model (CMM) [ For Freshers and Experience ]
- What is Sprint Planning ? | A Definitive Guide | Step-By-Step Process with REAL-TIME Examples
- What is Total Productive Maintenance (TPM) and How Does It Help in Equipment Effectiveness [ OverView ]
- What are Agile Metrics ? : A Complete Guide For Beginners [ OverView ]
- What is Agile Marketing and Why Do You Need It | Step-By-Step Process with REAL-TIME Examples
- Why is Retrospection Needed? : A Complete Guide For Beginners [ OverView ]
- Developing Project Schedule : Role of Float, Leads, and Lags [ OverView ]
- Project Life Cycle vs Product Life Cycle | Know Their Differences and Which Should You Learn?
- Projects in Business Environments | A Complete Guide For Beginners [ OverView ]
- What is Business Agility ? and Why is it Important ? Expert’s Top Picks
- The Most Important Benefits of Blended Learning | A Complete Guide For Beginners
- Can Business Analyst be a Project Manager? : Expert’s Top Picks
- Why A PMO Is Second In Line To A Project Manager ? | Expert’s Top Picks
- Devops vs Waterfall | A Definitive Guide and Which Should You Learn?
- Jira vs Trello | Know Their Differences and Which Should You Learn?
- Key Values and Principles Behind the Agile Manifesto | A Definitive Guide
- What are Scrum Ceremonies : The Ultimate Guide with Expert’s Top Picks
- Business Analyst vs Financial Analyst | Know Their Differences and Which Role is Better ?
- Learn Burndown Charts With Jira : Comprehensive Guide [ For Freshers and Experience ]
- What Is Scrum XP? : Step-By-Step Process with REAL-TIME Examples
- Phases of Project Management | Step-By-Step Process | Expert’s Top Picks
- Project Manager Salary in India – How much does a PM earn? [ Job & Future ]
- Why Do Scrum Masters Get Paid so Much? [For Freshers and Experience]
- What Best Describes a Scrum Team? All you need to know [ OverView ]
- JIRA vs TFS | Differences and Which Should You Learn?
- Anti-patterns of a Scrum Master : Step-By-Step Process
- SCM Tools and Frameworks | A Complete Guide with Best Practices
- Stages of Team Development | Everything You Need to Know
- Project Management Consultant : Job Description, Skills Required | Everything You Need to Know
- CSM vs PSM : Difference You Should Know
- Top Characteristics of a Project Manager : Expert’s Top Picks
- Roles And Responsibilities Of A Product Owner : Everything You Need to Know
- Common Project Risks and How to Tackle Them | Expert’s Top Picks
- Benefits of Having Shorter Sprints in Agile – Everything You Need to Know
- Group Discussion Tips | A Complete Guide with Best Practices
- PMP Certification Cost : All you need to know
- DMAIC Process and Methods | All you need to know [ OverView ]
- Agile Scrum Vs Kanban | Know the difference
- Deming vs Juran vs Crosby
- What is Project Scope Management and Why It’s Important?
- The Basic Principles of Project Management
- Top PMP Exam Questions and Answers for 2020
- Risk Management Strategies
- Roles and Responsibilities of A Scrum Master
- ROM Estimate Vs Definitive Estimate
- Guidelines for Creating and Maintaining a WBS Dictionary
- How to Become a Certified ScrumMaster?
- Top Professional Skills for 2020
- Fast Tracking Vs Crashing
- PMP Vs PRINCE2 Vs CAPM
- PMP Earned Value Management (EVM) And Formulas
- What is Certified Scrum Professional (CSM)?
- Top Leadership Theories Every Manager Should Know
- What is Deliverables in Project Management?
- How To Prepare For TOEFL
- History and evolution of the PMP Certification
- What Is Float In Microsoft Project?
- Rules to set you up for success in project
- What is Scrum Project Management?
- What Is Estimating Activity Duration in Project Management?
- What Are The PMP Terminologies Relating To Cost Knowledge Area?
- What is Project Scope Management processes?
- What Are The Types of Organization In PMP?
- Books to Beat the Scrum Master Certification
- Agile Coach Vs Agile Consultant
- What is the cost of quality in project management?
- Signs Your Career May Be Stagnation and Tips to Overcome Downturn
- Certified ScrumMaster (CSM) Certification
- Lean Six Sigma Black Belt Certification
- What is schedule Activity in project management?
- Why Do We Need a Project Charter?
- PMP Certification Exam Preparation Mind Map
- Why Quality Professionals Should Use Infographics In Project Management?
- Role of Earned Value Technique in Project Management
- What is Project Quality Management?
- Tools and Techniques to Estimate Project Cost
- What is a Project Charter And Project Scope in Project Management?
- Why Should You Conduct Project Status Meetings with Your Team?
- The 7 R’s of Change Management
- What Are The Categories and sources of risk in your project?
- What Is a Network Diagram in Project Management?
- What are The Types of Contracts In PMP?
- Residual Risk Vs Secondary Risk
- Impact of the stakeholders on the projects
- Effort Vs Duration Vs Elapsed Time
- Agile vs Scrum
- What Is Six Sigma Quality Assurance?
- How to Close a Project?
- What Qualifications Do You Need to be a Project Manager?
- Project Management Vs General Operations Management
- Enterprise Environmental Factors & Organizational Process Assets
- What is a project manager?
- Important Questions for PMP Certification Exam
- How is the PMP Exam changing, in 2015 & 2020?
- How To Renew Your PMP Certification?
- The Importance of Having Project Acceptance Criteria in Your Projects
- Tips for PMP Exam Preparation
- What is requirement traceability matrix RTM in Project Management?
- Poor Performance Appraisal? Here are the tips to turn any negative feedback into positive.
- How to build a successful Career in Agile and Scrum?
- Importance of Tuckman ladder model in HR management
- How To Apply For The PMP® Exam In Easy Steps
- How to Write a Six Sigma Problem Statement
- What is a lessons learned document in PMI?
- Perform Quality Assurance Vs Perform Quality Control
- How to Improve Quality Management Consistently?
- Interactive Vs Push Vs Pull Communication
- what is risk management?
- Key Appraisal Questions to Prepare For
- What are the MSP Certifications?
- What Is A Six Sigma Control Plan?
- How to Create a Project Plan in Excel?
- Agile Prioritization Techniques
- Tips to Help Millennials Climb the Corporate Ladder
- What is an Issue Log?
- Advantages of PMP over MBA
- Top Successful Project Estimation Techniques
- PMP Examination Preparation – ITTO’s
- Employee Training Rewards That Actually Improve Learning
- Lean principles
- What Does It Take to Become a Successful Agile Coach
- Projects VS Programs
- The Role of Six Sigma in Manufacturing
- The Top Formulas to Memorize Before Your PMP Exam
- Roadmap to CSM (Certified Scrum Master) Certification
- What are Some Qualities of a Good Manager and Good Leader?
- How to Handle Project Monitoring and Controlling Processes?
- Top Free Agile Tools For Any Project Manager
- Risk Assessment in Project Management
- The Concept of Zero Defects in Quality Management
- The Importance of Work Packages in Project Scope Management
- How to Get Project Management Experience for PMP Certification
- Different Ways to Calculate the Estimate at Completion (EAC)
- What Is a ScrumMaster?
- What is Risk Register?
- Agile Certifications
- Top-down Approach Vs Bottom-up Approach
- Leadership Vs Management
- What is Feasibility Study and Its Importance in Project Management?
- What Is a Project Management Plan?
- The Professional Advantages of the CAPM Certification
- PRINCE2 Vs PMP
- Rita Mulcahy’s PMP Prep and PMBOK® Guide
- What is Project Cycle Management?
- What is Project and Process Metrics?
- PMBOK® Sixth Edition is Here! What Project Managers Should Know?
- CAPM Certification
- Top Project Selection Methods for Project Managers
- Free Float Vs Total Float
- What is Critical Chain Project Management?
- How to Build a Career in Project Management?
- Scrum Master or Product Owner: What Suits You Better?
- Project Documentation and its Importance
- What is Performance Reporting in the Project Management?
- Top Highest Paying Tech Jobs in India

What Is a Network Diagram in Project Management?
Last updated on 10th Oct 2020, Artciles, Blog, Project Management
What are Network Diagrams?
Network Diagrams in project management are a visual representation of a project’s schedule. Well known complements to network diagrams include the PERT and Gantt charts. A network diagram in project management is useful for planning and tracking the project from beginning to finish. It represents a project’s critical path as well as the scope for the project. A good network diagram will be a clear and concise graphic representation of a project.
Subscribe For Free Demo
Error: Contact form not found.
How do Network Diagrams work?

There are two types of network diagrams: The Arrow Diagram and the Precedence diagram. The arrow diagram depicts nodes for events and arrows for activities. The precedence diagram depicts activities in the order they occur. If you work in IT you will most likely use the arrow diagram, depicted above. ‘A’ and ‘B’ each represent an event node. These event nodes refer to an instant when an activity is started or completed. An event node occurs only when all activities entering the node have been completed. The arrow represents the activity that takes place during the event. For example, if a task in a project were a “research competition’s ad campaign,” then the event nodes would designate the start and finish of this activity whereas the arrow would designate the activity itself.
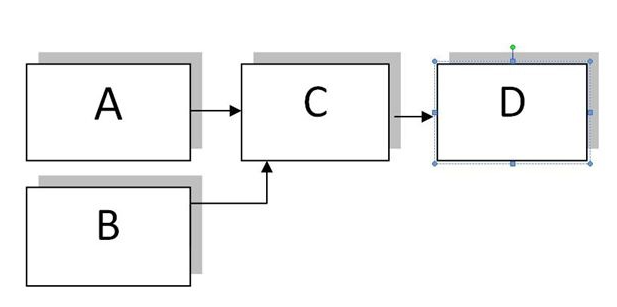
Using the arrow and node method, you can depict project dependencies. In the diagram above, you see that Event C depends upon activities from Events A and B to be completed, and Event D depends upon Event C’s activities to be completed. Dotted lines with arrows represent “dummy arrows.” Rather than depict a dependency between two items, these arrows depict a logical relationship. Dummy arrows have no duration. They do not depict an activity. Instead, they transfer logic from one event node to another. Once the project is mapped out, you can write a key for the visual representation, listing the duration of events and activities. The network diagram will provide you and your project team with a full visual representation of your project.
When are Network Diagrams Used?
Network diagrams are used whenever project management occurs. Because these project management tools are so useful, they can help project management teams to visualize the planning they have put time and effort into. The diagram gives a quick-glance view of the project.It also demonstrates who is responsible for which tasks.
What Is a Network Diagram in Project Management?
Whether you’re a project manager or a project team member, you should familiarize yourself with network diagrams.
A network diagram is a graphical representation of all the tasks, responsibilities and work-flow for a project. It often looks like a chart with a series of boxes and arrows. It is used to map out the schedule and work sequence for the project, as well as track its progress through each stage, up to and including completion. Since it encompasses every single action and outcome associated with the project, a network diagram also illustrates the scope of the project.
A network diagram not only allows a project manager to track each element of a project and quickly share its status with others, but since research shows depicting data in a visual way can improve comprehension and enhance retention, a network diagram can also boost performance and productivity, while reducing stress among your team members.
Two types of network diagrams
There are two main types of network diagrams in project management: the arrow diagramming method (ADM), also known as “arrow network” or “activity on arrow”; and the precedence diagramming method (PDM), also known as “node network” or “activity on node.”
Arrow diagram method (ADM)
The arrow diagramming method uses arrows to represent activities associated with the project.
In ADM:
- The tail of the arrow represents the start of the activity and the head represents the finish.
- The length of the arrow typically denotes the duration of the activity.
- Each arrow connects two boxes, known as “nodes.” The nodes are used to represent the start or end of an activity in a sequence. The starting node of an activity is sometimes called the “i-node,” with the final node of a sequence sometimes called the “j-node.”
- The only relationship between the nodes an activity in an ADM chart can represent is that of “finish to start” or FS.
Occasionally, “dummy activities”—arrows that do not represent a direct relationship—need to be included in ADM network diagrams. In the diagram above, activity C can only occur once activities A and B are complete; in the network diagram, you’ve connected activity A to activity C. Perhaps we’re talking about tiling a floor (activity C): It can only begin once the concrete is poured (activity A) and the permits are obtained (activity B). Since activities A and B are not directly related—A doesn’t lead to B, and B doesn’t lead to A—you’ll need to draw a dummy activity between B and C to show that C is dependent on B being completed.An ADM chart also does not have a way to encapsulate lead and lag times without introducing new nodes and activities, and it’s important to note ADM is not widely used anymore due to its representational limitations.
Precedence diagram method (PDM)
In the precedence diagramming method for creating network diagrams, each box, or node, represents an activity—with the arrows representing relationships between the different activities. The arrows can therefore represent all four possible relationships:
- “finish to start” (FS): This is used when an activity cannot start before another activity finishes.
- “start to start” (SS): This is used to illustrate when two activities are able to start simultaneously.
- “finish to finish” (FF): This is used when to tasks need to finish together
- “start to finish” (SF): This is an uncommon dependency and only used when one activity cannot finish until another activity starts.
Conclusion
In PDM, lead times and lag times can be written alongside the arrows. If a particular activity is going to require 10 days to elapse until the next activity can occur, for example, you can simply write “10 days” over the arrow representing the relationship between the connected nodes.
PDM network diagrams are frequently used in project management today.