- Professional Scrum Master Salary | Everything You Need to Know [ OverView ]
- What is Google Cloud Certification Path (GCP)? | Comprehensive Guide [ Explained ]
- Top Career Opportunities | Read this article to know more
- Top Automation Companies| Expert’s Top Picks
- All about SAP Course Know about the fees
- What is White Collar Job?
- Must-Know [LATEST] NLP Interview Questions and Answers
- Types of Influencers | Use to Improve Your Marketing | All you need to know
- Future Work in 2030 – Exciting Career Options
- Top 10 Online Courses in India [ Job & Future ]
- Future Scope of IoT (Internet of Things) in Modern World
- Characteristics Of Complexity Tables, General System and FPA
- The Most In-demand and Highest Paying Jobs in Australia 2020
- Why is Career Exploration important?
- Tips for Women Returning to Work After a Career Gap
- The Importance of Security Awareness
- Incredible Examples of Successful Rebranding
- Top Skills that Boosts Java Developer Salaries
- Why E-Learning?
- Hash in Python

Characteristics Of Complexity Tables, General System and FPA
Last updated on 10th Oct 2020, Artciles, Blog, Trending
We will begin with a quick recap of the FPA counting process. Next, we will understand what complexity tables are. This will be followed by a discussion on unadjusted function points. Additionally, the fourteen general system characteristics will be dealt with. This module will be concluded by looking into the adjusted function points, and some tips and tricks to be kept in mind while using FPA. Let us recap the FP counting process in the next slide.
Recap of the FP Counting Process
In the previous module, we understood that the data functions are broken into data element types and record element types; and the transaction functions are broken into data element types and file type referenced. These components are individually analyzed and counted to determine the unadjusted function point. Complexity tables are used in IFPUG Function Point Analysis to rate the data functions; based on the respective DET, RET, and FTR counts; to determine the unadjusted function point count. We will look at these complexity tables in the next slide.
Subscribe For Free Demo
Error: Contact form not found.
Function Point Analysis Complexity Tables
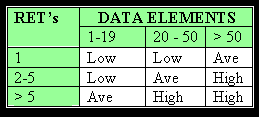
The functional complexity of the data or transaction functions is determined using the respective complexity tables. Table-1 shows the functional complexity table for ILFs and EIFs, Table-2 is the functional complexity table for EIs; and table-3 is the functional complexity table for EQs and EOs. These tables help in determining the complexity of the data or transaction functions, based on the number of DETs and RETs – for data functions – and the number of DETs and FTRs for transaction functions. For example, if an ILF has ten DETs and 3 RETs, then its complexity is ‘Average’. Similarly, an EO with 30 DETs and 5 FTRs would be rated as ‘High’. Once all the data and transaction functions are identified, the DETs, RETs, and FTR are counted; these complexity tables are used to determine the complexity of the data and transaction functions. Note that these complexity tables can’t be changed and remain fixed. The values in the matrix of DET vs. RET or DET vs. FTR can’t be changed. In the next slide, we will see how the complexity of the data and transaction functions are used to determine the unadjusted function point count.
Introduction To Function Point Analysis
Software systems, unless they are thoroughly understood, can be like an ice berg. They are becoming more and more difficult to understand. Improvement of coding tools allows software developers to produce large amounts of software to meet an ever expanding need from users. As systems grow a method to understand and communicate size needs to be used. Function Point Analysis is a structured technique of problem solving. It is a method to break systems into smaller components, so they can be better understood and analyzed.
Function points are a unit measure for software much like an hour is to measuring time, miles are to measuring distance or Celsius is to measuring temperature. Function Points are an ordinal measure much like other measures such as kilometers, Fahrenheit, hours, so on and so forth
Characteristic of Quality Function Point Analysis
Function Point Analysis should be performed by trained and experienced personnel. If Function Point Analysis is conducted by untrained personnel, it is reasonable to assume the analysis will be done incorrectly. The personnel counting function points should utilize the most current version of the Function Point Counting Practices Manual,
Current application documentation should be utilized to complete a function point count. For example, screen formats, report layouts, listing of interfaces with other systems and between systems, logical and/or preliminary physical data models will all assist in Function Points Analysis.
The task of counting function points should be included as part of the overall project plan. That is, counting function points should be scheduled and planned. The first function point count should be developed to provide sizing used for estimating.
The Five Major Components
Since it is common for computer systems to interact with other computer systems, a boundary must be drawn around each system to be measured prior to classifying components. This boundary must be drawn according to the user’s point of view. In short, the boundary indicates the border between the project or application being measured and the external applications or user domain. Once the border has been established, components can be classified, ranked and tallied.
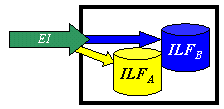
External Inputs (EI) – is an elementary process in which data crosses the boundary from outside to inside. This data may come from a data input screen or another application. The data may be used to maintain one or more internal logical files. The data can be either control information or business information. If the data is control information it does not have to update an internal logical file. The graphic represents a simple EI that updates 2 ILF’s (FTR’s).
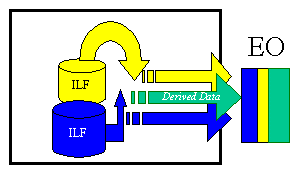
External Outputs (EO) – an elementary process in which derived data passes across the boundary from inside to outside. Additionally, an EO may update an ILF. The data creates reports or output files sent to other applications. These reports and files are created from one or more internal logical files and external interface files. The following graphic represents on EO with 2 FTR’s there is derived information (green) that has been derived from the ILF’s
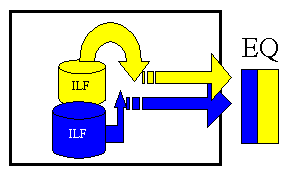
External Inquiry (EQ) – an elementary process with both input and output components that result in data retrieval from one or more internal logical files and external interface files. The input process does not update any Internal Logical Files, and the output side does not contain derived data. The graphic below represents an EQ with two ILF’s and no derived data.
Internal Logical Files (ILF’s) – a user identifiable group of logically related data that resides entirely within the applications boundary and is maintained through external inputs.
External Interface Files (EIF’s) – a user identifiable group of logically related data that is used for reference purposes only. The data resides entirely outside the application and is maintained by another application. The external interface file is an internal logical file for another application.
After the components have been classified as one of the five major components (EI’s, EO’s, EQ’s, ILF’s or EIF’s), a ranking of low, average or high is assigned. For transactions (EI’s, EO’s, EQ’s) the ranking is based upon the number of files updated or referenced (FTR’s) and the number of data element types (DET’s). For both ILF’s and EIF’s files the ranking is based upon record element types (RET’s) and data element types (DET’s). A record element type is a user recognizable subgroup of data elements within an ILF or EIF. A data element type is a unique user recognizable, non recursive, field.
Each of the following tables assists in the ranking process (the numerical rating is in parentheses). For example, an EI that references or updates 2 File Types Referenced (FTR’s) and has 7 data elements would be assigned a ranking of average and associated rating of 4. Where FTR’s are the combined number of Internal Logical Files (ILF’s) referenced or updated and External Interface Files referenced.
EI Table

Shared EO and EQ Table
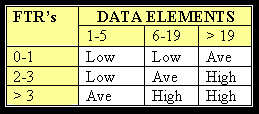
Values for transactions
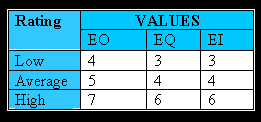
Like all components, EQ’s are rated and scored. Basically, an EQ is rated (Low, Average or High) like an EO, but assigned a value like and EI. The rating is based upon the total number of unique (combined unique input and out sides) data elements (DET’s) and the file types referenced (FTR’s) (combined unique input and output sides). If the same FTR is used on both the input and output side, then it is counted only one time. If the same DET is used on both the input and output side, then it is only counted one time.
For both ILF’s and EIF’s the number of record element types and the number of data element types are used to determine a ranking of low, average or high. A Record Element Type is a user recognizable subgroup of data elements within an ILF or EIF. A Data Element Type (DET) is a unique user recognizable, non recursive field on an ILF or EIF.

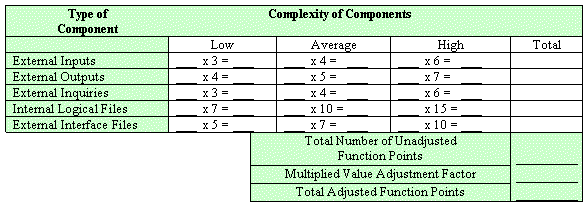
The counts for each level of complexity for each type of component can be entered into a table such as the following one. Each count is multiplied by the numerical rating shown to determine the rated value. The rated values on each row are summed across the table, giving a total value for each type of component. These totals are then summed across the table, giving a total value for each type of component. These totals are then summoned down to arrive at the Total Number of Unadjusted Function Points.
The value adjustment factor (VAF) is based on 14 general system characteristics (GSC’s) that rate the general functionality of the application being counted. Each characteristic has associated descriptions that help determine the degrees of influence of the characteristics. The degrees of influence range on a scale of zero to five, from no influence to strong influence. The IFPUG Counting Practices Manual provides detailed evaluation criteria for each of the GSC’S, the table below is intended to provide an overview of each GSC.
| General System Characteristic | Brief Description |
|---|---|
| Data communications | How many communication facilities are there to aid in the transfer or exchange of information with the application or system? |
| Distributed data processing | How are distributed data and processing functions handled? |
| Performance | Was response time or throughput required by the user? |
| Heavily used configuration | How heavily used is the current hardware platform where the application will be executed? |
| Transaction rate | How frequently are transactions executed daily, weekly, monthly, etc.? |
| On-Line data entry | What percentage of the information is entered On-Line? |
| End-user efficiency | Was the application designed for end-user efficiency? |
| On-Line update | How many ILF’s are updated by On-Line transactions? |
| Complex processing | Does the application have extensive logical or mathematical processing? |
| Reusability | Was the application developed to meet one or many user’s needs? |
| Installation ease | How difficult is conversion and installation? |
| Operational ease | How effective and/or automated are start-up, back-up, and recovery procedures? |
| Multiple sites | Was the application specifically designed, developed, and supported to be installed at multiple sites for multiple organizations? |
| Facilitate change | Was the application specifically designed, developed, and supported to facilitate change? |
Once all the 14 GSC’s have been answered, they should be tabulated using the IFPUG Value Adjustment Equation (VAF) —
14 where: Ci = degree of influence for each General System Characteristic
VAF = 0.65 + [ (Ci) / 100] .i = is from 1 to 14 representing each GSC.
i =1 Ã¥ = is a summation of all 14 GSC’s.
The final Function Point Count is obtained by multiplying the VAF times the Unadjusted Function Point (UAF).
FP = UAF * VAF
