
- What is Lean?| Everything You Need to Know
- What is SAP Workflow? : A Complete Guide
- Difference between Tableau and Power BI | Benefits and Special Features
- Data Warehouse in Tableau | Everything You Need to Know
- What is Tableau Server?| Everything You Need to Know | A Definitive Guide
- What is Dax in Power BI? | A Comprehensive Guide
- Upgrade in Tableau Desktop and Web Authoring | A Complete Guide with Best Practices
- What is SAP HANA | SAP HANA Database Connection | All you need to know [ OverView ]
- SAP BPC – What is Business Planning and Consolidation? : All you need to know [ OverView ]
- Root Cause Analysis: Definition, Examples & Methods | All you need to know [ OverView ]
- Seven Basic Quality Improvement Ishikawa Tools | Important asset to control quality in your project [OverView]
- What is Power BI | Its Use Cases and Applications | All you need to know [ OverView ]
- How and why to measure and analyze employee productivity | Everything You Need to Know
- Top 10 Employee Retention Strategies | Everything You Need to Know
- What are LookML Projects and the Developer Mode | How to Create LookML Projects?
- What are Slowly Changing Dimension | SCD Types and Implementations | Step-By-Step Process
- What is Pareto Chart and How to Create Pareto Chart | A Complete Guide For Beginners
- What does an Agile Business Analyst do | Required Skills, Roles and Responsibilities [ Job & Future ]
- What is Lean Management? | Role and Concepts of Lean Management | Expert’s Top Picks
- A Definitive Guide of Working Capital Management with Best Practices & REAL-TIME Examples
- Business Analytics with Excel Fundamentals | A Complete Guide For Beginners
- Business Analyst : Job Description | All you need to know [ Job & Future ]
- How to create a Splunk Dashboard | A Complete Guide For Beginners [ OverView ]
- What is Splunk Logging ? | The Ultimate Guide with Expert’s Top Picks
- Alteryx vs Tableau | Know Their Differences and Which Should You Learn?
- What is Predictive Analytics? : Step-By-Step Process with REAL-TIME Examples
- An Overview of SAS Stored Processes | The Ultimate Guide with Expert’s Top Picks
- How to Create Conditional Formatting in Cognos Report Studio | A Complete Guide
- Difference between OLTP vs OLAP | Know Their Differences and Which Should You Learn?
- ECBA vs CCBA vs CBAP | A Complete Guide For Beginners | Know Their Differences and Which Should You Learn?
- Import Custom Geocode Data in Tableau | Everything You Need to Know [ OverView ]
- Data Warehouse Tools : Features , Concepts and Architecture
- PGDM vs MBA | Know Their Differences and Which Should You Learn?
- Most Popular Data Visualization Tools | A Complete Beginners Guide | REAL-TIME Examples
- Tableau vs Looker : Comparision and Differences | Which Should You Learn?
- Benefits of Employee Satisfaction for the Organization [ Explained ]
- DAX In Power BI – Learn Power BI DAX Basics [ For Freshers and Experience ]
- Power Bi vs Tableau : Comparision and Differences | Which Should You Learn?
- What is Alteryx Tools | Alteryx ETL Tools | Comprehensive Guide
- What is Tableau Prep? : Comprehensive Guide | Free Guide Tutorial & REAL-TIME Examples
- What are Business Intelligence Tools ? : All you need to know [ OverView ]
- Tableau Aggregate Functions | A Complete Guide with REAL-TIME Examples
- Intervalmatch Function in Qlikview | Everything You Need to Know [ OverView ]
- QlikView Circular Reference | Free Guide Tutorial & REAL-TIME Examples
- Data Blending in Tableau | A Complete Guide with Best Practices | Free Guide Tutorial [ OverView ]
- Splunk vs ELK | Differences and Which Should You Learn? [ OverView ]
- QlikSense vs QlikView | Differences and What to learn and Why?
- What Is Measurement System Analysis | Required Skills | Everything You Need to Know
- Splunk Timechart | Free Guide Tutorial & REAL-TIME Examples
- What Is Image Processing ? A Complete Guide with Best Practices
- What is a Business Analysis ? A Complete Guide with Best Practices
- Top Business Analytics Tools | Comprehensive Guide
- Business Analyst Career Path [ Job & Future ]
- Time Series Analysis Tactics | A Complete Guide with Best Practices
- What is Splunk ? Free Guide Tutorial & REAL-TIME Examples
- Which Certification is Right for You: Six Sigma or Lean Six Sigma?
- SAS Vs R
- Top Technology Trends for 2020
- Data Analyst vs. Data Scientist
- What are the Essential Skills That You Need to Master in Data Analyst?
- What is Six Sigma?
- Common Cause Variation Vs Special Cause Variation
- Reasons to Get a Six Sigma Certification
- What Is Strategic Enterprise Management and its Components?
- What Are The Benefits Measurement Constrained Optimization Methods?
- What Is the Benefit of Modern Data Warehousing?
- What Is Corporate Social Responsibility (CSR)?
- What Is The Purpose and Importance Of Financial Analysis?
- What is Insights-as-a-Service (IaaS)?
- Business Analytics With R Programming Languages
- Where Are The 8 Hidden Wastes?
- What Are Market Structures?
- What is Cost of Quality (COQ)?
- What is Build Verification Testing?
- Quality Improvement in Six Sigma
- What is Process Capability Analysis?
- How To Measure The Effectiveness Of Corporate Training
- SAP Financials And SAP Accounting Modules
- Tips to Learn Tableau
- Why Should I Become a CBAP?
- History And Evolution of Six Sigma
- How to use Control Chart Constants?
- Data Analytics Course For Beginners
- How to Build a Successful Data Analyst Career?
- Data Analytics Vs Business Analytics
- What is SAP Certification?
- Books To Read For a Six Sigma Certification
- Six Sigma Green Belt Salary
- What is the ASAP Methodology?
- Complete list of SAP modules
What is Power BI | Its Use Cases and Applications | All you need to know [ OverView ]
Last updated on 04th Nov 2022, Artciles, Blog, Business Analytics
- In this article you will learn:
- 1.What is Power BI?
- 2.Why Power BI?
- 3.Power BI Architecture.
- 4.Power BI Service.
- 5.Power BI Dashboard.
- 6.Components of Power BI.
- 7.Features of Power BI.
- 8.Conclusion.
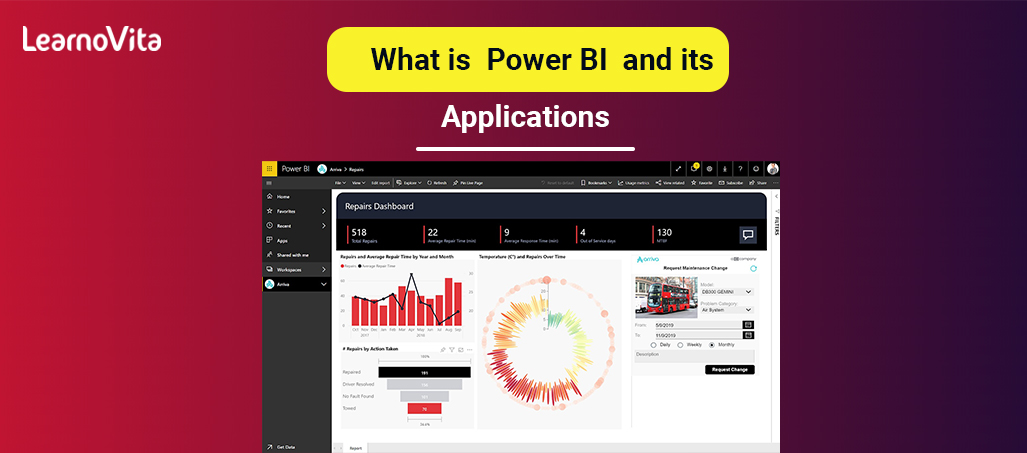
What is a Power BI?
Power BI is the business analytics service are provided by aMicrosoft that lets be visualize a data and share insights. It converts a data from different sources to build an interactive dashboards and also Business Intelligence reports.
Why Power BI?
Following are reasons why Power BI is so famous and needed in a BI domain:
1. Access to Volumes of a Data from the Multiple Sources:
Power BI can access a vast volumes of a data from multiple sources.It allows to view, analyze and visualize vast quantities of a data that cannot be opened in Excel. Some of important data sources available for a Power BI are Excel, CSV, XML, JSON, pdf etc. Power BI uses a powerful compression algorithms to the import and cache a data within the.PBIX file.
2. Interactive UI/UX Features :
Power BI makes a things visually appealing.It has been simple drag and drops functionality with features that allow to copy all formatting across similar visualizations.
3. Exceptional Excel Integration:
Power BI helps to the gather, analyze, publish and share Excel business data. Anyone familiar with the Office 365 can easily connect be Excel queries, data models and reports to a Power BI Dashboards.
4. Accelerate a Big Data Preparation with Azure :
Using Power BI with the Azure allows to analyze and share the massive volumes of data.An azure data lake can reduce a time it takes to get insights and increase the collaboration between the business analysts, data engineers and data scientists.
5. Turn Insights into Action :
Power BI allows to gain insights from a data and turn those insights into the actions to make a data-driven business decisions.
6. Real-time Stream Analytics:
Power BI will enable to perform a real-time stream analytics.It helps to fetch a data from multiple sensors and social media sources to get access to the real-time analytics so are always ready to make a business decisions.
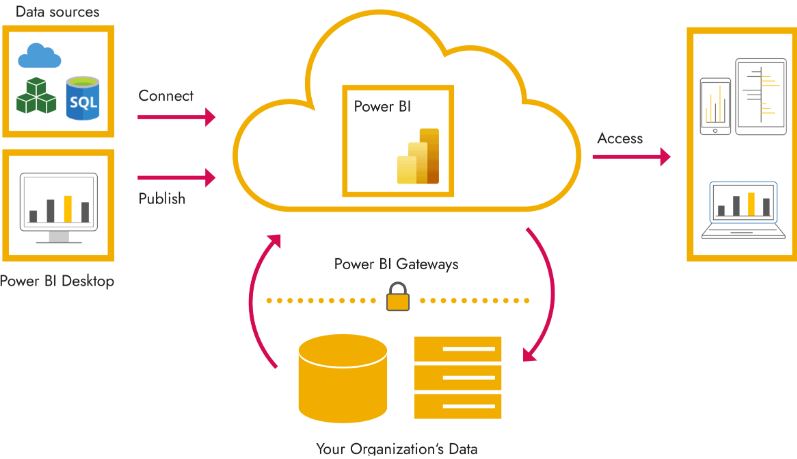
Power BI Architecture:
- Power BI architecture is the service built on top of an Azure.
- There are multiple data sources that are Power BI can connect to. Power BI Desktop allows to create a reports and data visualizations on a dataset.
- Power BI gateway is connected to the on-premise data sources to get continuous data for a reporting and analytics.
- Power BI services are refer to a cloud services that are used to publish a Power BI reports and data visualizations.
- Using a Power BI mobile apps and can stay connected to their data from anywhere. Power BI apps are be available for Windows, iOS and Android platforms.
Power BI Service:
- Power BI service is a Software as a Service (SaaS) part of Power BI. It is also known as a Power BI Online. To access Power BI Service need to log in to the Power BI service.
- Here is how a home page of Power BI Service looks like a once log in.
- Allows to connect to a data, create reports and dashboards and ask the questions about a data.
- Now as have understood what is a Power BI its architecture and services let us now understand about Dashboards in a Power BI.
Power BI Dashboard:
Power BI Dashboard is the single page visualization to tell story. The visualizations on the dashboard are generated from a reports and each report is based on a one dataset. A single page dashboard is also known as a Canvas. Below is the Finance Dashboard published on a Power BI Servic.
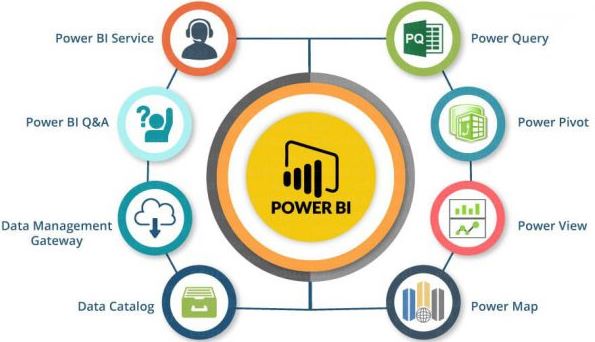
Components of Power BI:
1. Power Query : Power Query is a data transformation and mash up of engine. It enables to discover, connect, combine and refine a data sources to meet analysis need. It can be downloaded as the add-in for Excel or can be used as part of a Power BI Desktop.
2. Power Pivot : Power Pivot is the data modeling technique that lets can create data models, establish relationships and create calculations. It uses a Data Analysis Expression (DAX) language to be model simple and complex data.
3. Power View : Power View is the technology that is available in Excel, Sharepoint, SQL Server, and Power BI. It lets can create an interactive charts, graphs, maps and the other visuals that bring a data to life. It can connect to the data sources and filter data for every data visualization element or an entire report.
4. Power Map : Microsoft’s Power Map for an Excel and Power BI is the 3-D data visualization tool that lets a map of data and plot more than a million rows of a data visually on Bing maps in a 3-D format from an Excel table or Data Model in Excel.A Power Map works with the Bing maps to get the best visualization based on a latitude, longitude or country, state, city and also street address information.
5. Power BI Desktop : Power BI Desktop is the development tool for a Power Query, Power Pivot and Power View. With a Power BI Desktop have everything under a same solution and it is simpler to develop a BI and data analysis experience.
6.Power Q&A: The Q&A feature in a Power BI lets explore a data in own words. It is fastest way to get an answer from a data using natural language. An example could be what was a total sales last year? Once have built a data model and deployed that into Power BI website then can ask questions and get a answers quickly.
Features of Power BI:
- Power BI Desktop .
- Stream Analytics .
- Multiple Data Sources.
- Custom Visualization .
Conclusion:
After reading this article would have understood a need for the Power BI in Business Intelligence what is a Power BI and the various features of Power BI.And also learned about a Power BI Service how to create a Dashboard in the Power BI and how can architecture looks like. Finally explored a different features of Power BI Desktop by creating the different visualizations to analyze a finance sample data.