
- What is Lean?| Everything You Need to Know
- What is SAP Workflow? : A Complete Guide
- Difference between Tableau and Power BI | Benefits and Special Features
- Data Warehouse in Tableau | Everything You Need to Know
- What is Tableau Server?| Everything You Need to Know | A Definitive Guide
- What is Dax in Power BI? | A Comprehensive Guide
- Upgrade in Tableau Desktop and Web Authoring | A Complete Guide with Best Practices
- What is SAP HANA | SAP HANA Database Connection | All you need to know [ OverView ]
- SAP BPC – What is Business Planning and Consolidation? : All you need to know [ OverView ]
- Root Cause Analysis: Definition, Examples & Methods | All you need to know [ OverView ]
- Seven Basic Quality Improvement Ishikawa Tools | Important asset to control quality in your project [OverView]
- What is Power BI | Its Use Cases and Applications | All you need to know [ OverView ]
- How and why to measure and analyze employee productivity | Everything You Need to Know
- Top 10 Employee Retention Strategies | Everything You Need to Know
- What are LookML Projects and the Developer Mode | How to Create LookML Projects?
- What are Slowly Changing Dimension | SCD Types and Implementations | Step-By-Step Process
- What is Pareto Chart and How to Create Pareto Chart | A Complete Guide For Beginners
- What does an Agile Business Analyst do | Required Skills, Roles and Responsibilities [ Job & Future ]
- What is Lean Management? | Role and Concepts of Lean Management | Expert’s Top Picks
- A Definitive Guide of Working Capital Management with Best Practices & REAL-TIME Examples
- Business Analytics with Excel Fundamentals | A Complete Guide For Beginners
- Business Analyst : Job Description | All you need to know [ Job & Future ]
- How to create a Splunk Dashboard | A Complete Guide For Beginners [ OverView ]
- What is Splunk Logging ? | The Ultimate Guide with Expert’s Top Picks
- Alteryx vs Tableau | Know Their Differences and Which Should You Learn?
- What is Predictive Analytics? : Step-By-Step Process with REAL-TIME Examples
- An Overview of SAS Stored Processes | The Ultimate Guide with Expert’s Top Picks
- How to Create Conditional Formatting in Cognos Report Studio | A Complete Guide
- Difference between OLTP vs OLAP | Know Their Differences and Which Should You Learn?
- ECBA vs CCBA vs CBAP | A Complete Guide For Beginners | Know Their Differences and Which Should You Learn?
- Import Custom Geocode Data in Tableau | Everything You Need to Know [ OverView ]
- Data Warehouse Tools : Features , Concepts and Architecture
- PGDM vs MBA | Know Their Differences and Which Should You Learn?
- Most Popular Data Visualization Tools | A Complete Beginners Guide | REAL-TIME Examples
- Tableau vs Looker : Comparision and Differences | Which Should You Learn?
- Benefits of Employee Satisfaction for the Organization [ Explained ]
- DAX In Power BI – Learn Power BI DAX Basics [ For Freshers and Experience ]
- Power Bi vs Tableau : Comparision and Differences | Which Should You Learn?
- What is Alteryx Tools | Alteryx ETL Tools | Comprehensive Guide
- What is Tableau Prep? : Comprehensive Guide | Free Guide Tutorial & REAL-TIME Examples
- What are Business Intelligence Tools ? : All you need to know [ OverView ]
- Tableau Aggregate Functions | A Complete Guide with REAL-TIME Examples
- Intervalmatch Function in Qlikview | Everything You Need to Know [ OverView ]
- QlikView Circular Reference | Free Guide Tutorial & REAL-TIME Examples
- Data Blending in Tableau | A Complete Guide with Best Practices | Free Guide Tutorial [ OverView ]
- Splunk vs ELK | Differences and Which Should You Learn? [ OverView ]
- QlikSense vs QlikView | Differences and What to learn and Why?
- What Is Measurement System Analysis | Required Skills | Everything You Need to Know
- Splunk Timechart | Free Guide Tutorial & REAL-TIME Examples
- What Is Image Processing ? A Complete Guide with Best Practices
- What is a Business Analysis ? A Complete Guide with Best Practices
- Top Business Analytics Tools | Comprehensive Guide
- Business Analyst Career Path [ Job & Future ]
- Time Series Analysis Tactics | A Complete Guide with Best Practices
- What is Splunk ? Free Guide Tutorial & REAL-TIME Examples
- Which Certification is Right for You: Six Sigma or Lean Six Sigma?
- SAS Vs R
- Top Technology Trends for 2020
- Data Analyst vs. Data Scientist
- What are the Essential Skills That You Need to Master in Data Analyst?
- What is Six Sigma?
- Common Cause Variation Vs Special Cause Variation
- Reasons to Get a Six Sigma Certification
- What Is Strategic Enterprise Management and its Components?
- What Are The Benefits Measurement Constrained Optimization Methods?
- What Is the Benefit of Modern Data Warehousing?
- What Is Corporate Social Responsibility (CSR)?
- What Is The Purpose and Importance Of Financial Analysis?
- What is Insights-as-a-Service (IaaS)?
- Business Analytics With R Programming Languages
- Where Are The 8 Hidden Wastes?
- What Are Market Structures?
- What is Cost of Quality (COQ)?
- What is Build Verification Testing?
- Quality Improvement in Six Sigma
- What is Process Capability Analysis?
- How To Measure The Effectiveness Of Corporate Training
- SAP Financials And SAP Accounting Modules
- Tips to Learn Tableau
- Why Should I Become a CBAP?
- History And Evolution of Six Sigma
- How to use Control Chart Constants?
- Data Analytics Course For Beginners
- How to Build a Successful Data Analyst Career?
- Data Analytics Vs Business Analytics
- What is SAP Certification?
- Books To Read For a Six Sigma Certification
- Six Sigma Green Belt Salary
- What is the ASAP Methodology?
- Complete list of SAP modules
What is Splunk Logging ? | The Ultimate Guide with Expert’s Top Picks
Last updated on 03rd Nov 2022, Artciles, Blog, Business Analytics
- In this article you will learn:
- 1.Introduction To a Splunk Logging.
- 2.Splunk `logging` with Java (with an example).
- 3.Steps to integrate Splunk with the Java project.
- 4.Use of a key-value pairs.
- 5.Use of an auth-actions.
- 6.Conclusion.
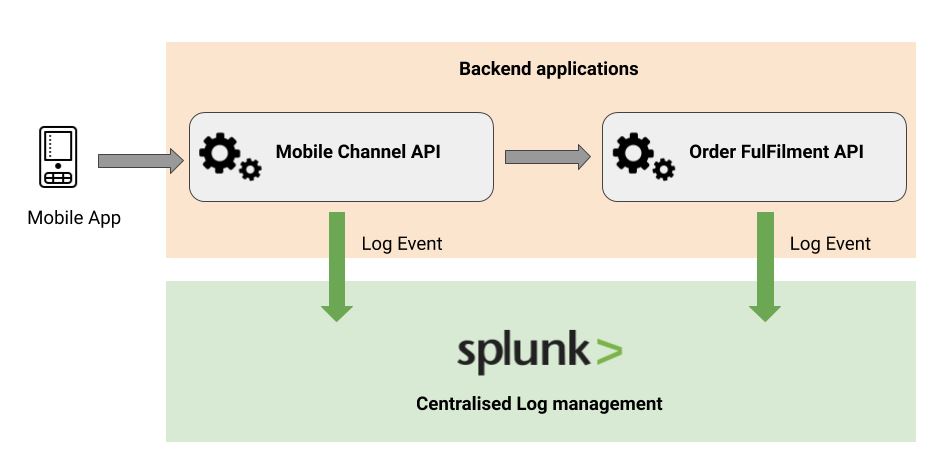
Introduction To a Splunk Logging:
Splunk is the software that enables a one to monitor, search, visualize and also to analyse a machine-generated to big-data using the web style interface.It is an advanced software that indexes and searches a log files stored on a system or like, alongside that, it is the scalable and potent software. Splunk bridges a gaps which a single simple log management software or the security information product or single event management product can manage all themselves.
Splunk `logging` with Java (with an example):
In order to look at a different possibilities of a logging examples, let us a configure Splunk on to a Java project environment and check how can leverage use of a Splunk.In order for to achieve this, there is a set of steps that are need to complete – and assuming that are everything is complete, will continue to look into the Java example and test our application with different combinations of logging with a Splunk.
Steps to integrate Splunk with the Java project:
- Add a Splunk logging to a Java project.
- Choose amongst available options and add a logging library.
- Open the TCP input on a Splunk instance to log on events to.
- Configure a logging system.
- Finally, use a SplunkCimLogEvent class to generate a log entries in presentable manner.
Considering that are able to configure a Splunk logging to the Java projects or any other programming languages that are intend to use Splunk with, will proceed with a logging examples.This topic briefs on the best possible ways as does when create an events for a Splunk Software to index.As per steps mentioned above, article in a time of its writings has chosen a Logback as its logging library and offers the necessary artifacts to get a UP and Running with the working example in Java.Considering that a Splunk Enterprise is running on a localhost and on the default port of 15000, let us now configure the TCPAppender to Logback as it doesn’t ship one on its by own.This configuration that has been provided the above, will ensure that can create with a log back library enabled logging on a Java project with the name my.splunk.logger which logs starting from a INFO messages to highest level of an ERROR messages.Now can create a own logging class by an importing com.splunk.logging.SplunkCimLogEvent and use that class to create the events for logging the necessary information at will.
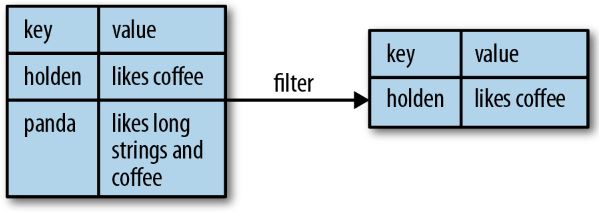
Use of a key-value pairs:
- Log.debug(“orderStatus=error, errorcode=546, userId=%d, orderId=%s”, userId, orderId).
- This is one of best possible ways to add a debug details to the application log via Splunk or any other logging framework.
- For a Splunk’s usage, it is highly recommended that are log information in meaningful key and value pairs as a Splunk can put in its own set of the features like Reporting in use to offers meaningful details on analyzing a same.
- It becomes more simple for any to use a simple search (for example, orderStatus=error) to get a details all at once.
- Alongside that, if want to use a Splunk’s Reporting feature to grab a report based on order status, then it gets more easy (example, success=96%, error=3%, cancelled=1%).
- One of the best possible ways to the add key/value pairs to the logging is as shown below, same example that is considered above has been modified for a better understanding.
- logger.info(new SplunkCimLogEvent(“KeyValuePairEvent”, “keyValuePairEventID”).
- {{
- addField(“orderStatus”,”error”);
- addField(“errorcode”,”546”);
- }});
Use of a stack-traces for your exceptions:
- Cases and scenarios where can expect that there can be an exceptions, can always rely on a stack trace of the exception to debug errored out scenario well.
- There is the way that you can achieve this using a Splunk to add a stack-trace related details along with a key/value pairs as shown in above example.
- But for now, will concentrate on a adding the necessary exception’s stack-trace in the logging source.
Use of an auth-actions:
Cases when need to log and check authentication-related activities, or even trace back all activities done by a specific user on the application – this comes into a perfect usage.Use a setAuthAction() method to specify a action performed on resource.
Conclusion:
In this article, have tried to demystify what a Splunk can do as standalone software and where its usages are can be.Have also tried to understand how to use a Splunk logging feature to analyse a application logs.Hope this article has provided all necessary details for to understand a concept altogether.