- ITIL Tutorial – Incident & amp Problem Management | The BEST Step-By-Step Guide
- ITIL4 Service Value Chain Model Tutorial | Everything You Need to Know
- The ITIL 4 Service Value System | The BEST Step-By-Step Guide
- What are the ITIL 4 Management Practices? | Tutorial for Learning Path
- Guiding Principles of ITIL 4 | Learn Now Tutorial
- Four Dimensions of Service Management in ITIL 4 | A Definitive Guide
- What is the Continual Improvement Model? ITIL Tutorial
- ITIL4 Tutorial | A Complete Guide for Beginners
- Continual Service Improvement (CSI)Tutorial | Learn the Methods and Techniques
- Service Transition Overview – ITIL Tutorial
- ITIL® 4 Foundation Tutorial | The Ultimate Guide
- Design an Effective IT Service with ITIL® v3 Tutorial
- Nagios Tutorial
- ITIL – Service management lifecycle Tutorial
- Service Validation and Testing Tutorial
- Service Operation Processes Tutorial
- ITIL Turtorial
- Services Strategy Tutorial
- ITIL Intermediate SOA – Demand Management Tutorial
- Availability Management Tutorial
- ITIL Key Concepts of the Service Lifecycle Tutorial
- ITIL Change Evaluation Tutorial
- The principles of COBIT® 5 Tutorial
- ITIL Intermediate CSI – Continual Service Improvement Processes Tutorial
- ITIL-Service Level Management Tutorial
- ServiceNow Tutorial
- SCCM Tutorial

Nagios Tutorial
Last updated on 12th Oct 2020, Blog, IT service and Architecture, Tutorials
Nagios is the most popular continuous monitoring tool. It monitors complete IT infrastructure including its systems, applications, services processes etc.
This tutorial gives an overview of Nagios and lets learners start their journey with Nagios.
The tutorial is written with an assumption that the learner is comfortable working with Ubuntu System 16.04/18.04, and basic packages like gcc compiler, build essential, apache, php and root/sudo access.
If you are new to any of these concepts, we suggest you pick up tutorials related to these concepts. You can also consider choosing Linux and Ubuntu tutorials for a better understanding.
DevOps lifecycle is a continuous loop of several stages, continuous monitoring is the last stage of this loop. Continuous monitoring is one of the stages in this lifecycle. In this chapter, let us learn in detail about what continuous monitoring is and how Nagios is helpful for this purpose.
What is Continuous Monitoring
Continuous monitoring starts when the deployment is done on the production servers. From then on, this stage is responsible to monitor everything happening. This stage is very crucial for the business productivity.
There are several benefits of using Continuous monitoring −
- It detects all the server and network problems.
- It finds the root cause of the failure.
- It helps in reducing the maintenance cost.
- It helps in troubleshooting the performance issues.
- It helps in updating infrastructure before it gets outdated.
- It can fix problems automatically when detected.
- It makes sure the servers, services, applications, and network are always up and running.
- It monitors complete infrastructure every second.
What is Nagios
Nagios is an open source continuous monitoring tool which monitors network applications and servers. It can find and repair problems detected in the infrastructure, and stop future issues before they affect the end users. It gives the complete status of your IT infrastructure and its performance.
Why Nagios
Nagios offers the following features making it usable by a large group of user community −
- It can monitor Database servers such as SQL Server, Oracle, Mysql, Postgres
- It gives application level information (Apache, Postfix, LDAP, Citrix etc.).
- Provides active development.
- Has excellent support from a huge active community.
- Nagios runs on any operating system.
- It can ping to see if the host is reachable.
Subscribe For Free Demo
Error: Contact form not found.
Benefits of Nagios
Nagios offers the following benefits for the users −
- It helps in getting rid of periodic testing.
- It detects split-second failures when the wrist strap is still in the “intermittent” stage.
- It reduces maintenance cost without sacrificing performance.
- It provides timely notification to the management of control and breakdown.
Nagios Architecture
The following points are worth notable about Nagios architecture −
- Nagios has server-agent architecture.
- Nagios server is installed on the host and plugins are installed on the remote hosts/servers which are to be monitored.
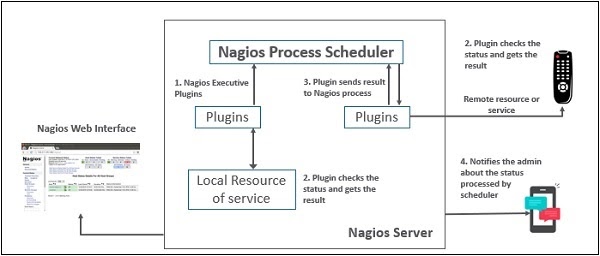
- Nagios sends a signal through a process scheduler to run the plugins on the local/remote hosts/servers.
- Plugins collect the data (CPU usage, memory usage etc.) and send it back to the scheduler.
- Then the process schedules send the notifications to the admin/s and update Nagios GUI.
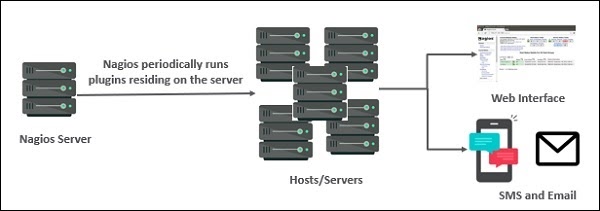
The following figure shows Nagios Server Agent Architecture in detail −
Nagios XI
It provides monitoring for complete IT infrastructure components like applications, services, network, operating systems etc. It gives a complete view of your infrastructure and business processes. The GUI is easily customizable giving the used flexibility. The standard edition of this tool costs $1995 and enterprise edition costs $3495.
Nagios Core
It is the core of monitoring IT infrastructure. Nagios XI product is also fundamentally based on Nagios core. Whenever there is any issue of failure in the infrastructure, it sends an alert/notification to the admin who can take the action quickly to resolve the issue. This tool is absolutely free.
Nagios Log Server
It makes searching for log data very simple and easy. It keeps all the log data at one location with high availability setup. It can easily send alerts if any issue is found in the log data. It can scale to 1000s of severs giving more power, speed, storage, and reliability to your log analysis platform. The price of this tool depends on the number of instances – 1 Instance $3995, 2 Instances $4995, 3 Instances $5995, 4 Instances $6995, 10 Instances $14995.
Nagios Fusion
This product provides a centralized view of the complete monitoring system. With Nagios Fusion, you can set up separate monitoring servers for separate geographies. It can be easily integrated with Nagios XI and Nagios core to give the complete visibility of the infrastructure. This tool costs $2495.

Nagios Network Analyser
It gives the complete information of the network infrastructure to the admin with the potential threats on the network so that admin can take quick actions. It shares very detailed data about the network after in-depth network analysis. This tool costs $1995.
Nagios XI
It provides monitoring for complete IT infrastructure components like applications, services, network, operating systems etc. It gives a complete view of your infrastructure and business processes. The GUI is easily customizable giving the used flexibility. The standard edition of this tool costs $1995 and enterprise edition costs $3495.
Nagios Core
It is the core of monitoring IT infrastructure. Nagios XI product is also fundamentally based on Nagios core. Whenever there is any issue of failure in the infrastructure, it sends an alert/notification to the admin who can take the action quickly to resolve the issue. This tool is absolutely free.
Nagios Log Server
It makes searching for log data very simple and easy. It keeps all the log data at one location with high availability setup. It can easily send alerts if any issue is found in the log data. It can scale to 1000s of severs giving more power, speed, storage, and reliability to your log analysis platform. The price of this tool depends on the number of instances – 1 Instance $3995, 2 Instances $4995, 3 Instances $5995, 4 Instances $6995, 10 Instances $14995.
Nagios Fusion
This product provides a centralized view of the complete monitoring system. With Nagios Fusion, you can set up separate monitoring servers for separate geographies. It can be easily integrated with Nagios XI and Nagios core to give the complete visibility of the infrastructure. This tool costs $2495.
Nagios Network Analyser
It gives the complete information of the network infrastructure to the admin with the potential threats on the network so that admin can take quick actions. It shares very detailed data about the network after in-depth network analysis. This tool costs $1995.
In this chapter, the steps to set up Nagios on Ubuntu are discussed in detail.
Before you install Nagios, some packages such as Apache, PHP, building packages etc., are required to be present on your Ubuntu system. Hence, let us install them first.
Step 1 − Run the following command to install pre-required packages −
sudo apt-get install wget build-essential apache2 php apache2-mod-php7.0 php-gd
libgd-dev sendmail unzip
Step 2 − Next, create a user and group for Nagios and add them to Apache www-data user.
sudo useradd nagios
sudo groupadd nagcmd
sudo usermod -a -G nagcmd nagios
sudo usermod -a -G nagios,nagcmd www-data
Step 3 − Download the latest Nagios package.
wget https://assets.nagios.com/downloads/nagioscore/releases/nagios-
4.4.3.tar.gz
Step 4 − Extract the tarball file.
tar -xzf nagios-4.4.3.tar.gz
cd nagios-4.4.3/
Step 5 − Run the following command to compile Nagios from source.
./configure –with-nagios-group=nagios –with-command-group=nagcmd
Step 6 − Run the following command to build Nagios files.
make all
Step 7 − Run the command shown below to install all the Nagios files.
sudo make install
Step 8 − Run the following commands to install init and external command configuration files.
sudo make install-commandmode
sudo make install-init
sudo make install-config
sudo /usr/bin/install -c -m 644 sample-config/httpd.conf /etc/apache2/sitesavailable/
nagios.conf
Step 9 − Now copy the event handler directory to Nagios directory.
sudo cp -R contrib/eventhandlers/ /usr/local/nagios/libexec/
sudo chown -R nagios:nagios /usr/local/nagios/libexec/eventhandlers
Step 10 − Download and extract Nagios plugins.
cd
wget https://nagios-plugins.org/download/nagiosplugins-
2.2.1.tar.gz
tar -xzf nagios-plugins*.tar.gz
cd nagios-plugins-2.2.1/
Step 11 − Install Nagios plugins using the below command.
./configure –with-nagios-user=nagios –with-nagios-group=nagios –with-openssl
make
sudo make install
Step 12 − Now edit the Nagios configuration file and uncomment line number 51 → cfg_dir=/usr/local/nagios/etc/servers
sudo gedit /usr/local/nagios/etc/nagios.cfg
Step 13 − Now, create a server directory.
sudo mkdir -p /usr/local/nagios/etc/servers
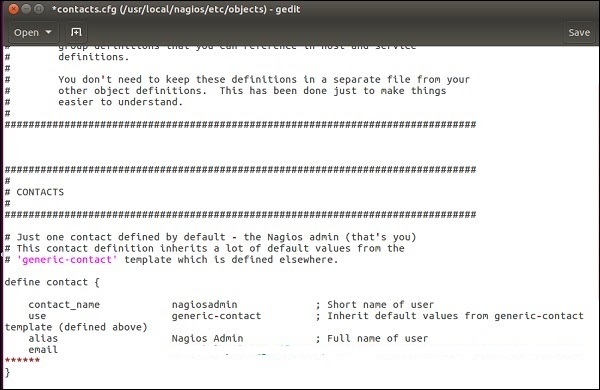
Step 14 − Edit contacts configuration file.
sudo gedit /usr/local/nagios/etc/objects/contacts.cfg
Step 15 − Now enable the Apache modules and configure a user nagiosadmin.
sudo a2enmod rewrite
sudo a2enmod cgi
sudo htpasswd -c /usr/local/nagios/etc/htpasswd.users nagiosadmin
sudo ln -s /etc/apache2/sites-available/nagios.conf /etc/apache2/sites-enabled/
Step 16 − Now, restart Apache and Nagios.
service apache2 restart
service nagios start
cd /etc/init.d/
sudo cp /etc/init.d/skeleton /etc/init.d/Nagios
Step 17 − Edit the Nagios file.
sudo gedit /etc/init.d/Nagios
DESC = “Nagios”
NAME = nagios
DAEMON = /usr/local/nagios/bin/$NAME
DAEMON_ARGS = “-d /usr/local/nagios/etc/nagios.cfg”
PIDFILE = /usr/local/nagios/var/$NAME.lock
Step 18 − Make the Nagios file executable and start Nagios.
sudo chmod +x /etc/init.d/nagios
service apache2 restart
service nagios start
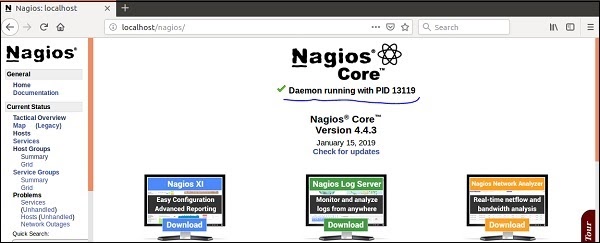
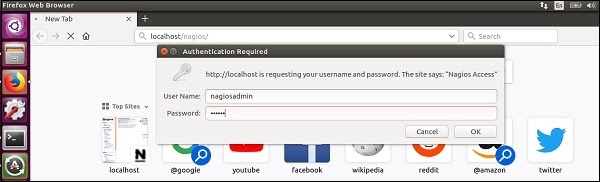
Step 19 − Now go to your browser and open url → http://localhost/nagios. Now login to Nagios with username nagiosadmin and use the password which you had set earlier. The login screen of Nagios is as shown in the screenshot given below −
If you have followed all the steps correctly, Nagios web interface will show up. You can find the Nagios dashboard as shown below −