
- What is Lean?| Everything You Need to Know
- What is SAP Workflow? : A Complete Guide
- Difference between Tableau and Power BI | Benefits and Special Features
- Data Warehouse in Tableau | Everything You Need to Know
- What is Tableau Server?| Everything You Need to Know | A Definitive Guide
- What is Dax in Power BI? | A Comprehensive Guide
- Upgrade in Tableau Desktop and Web Authoring | A Complete Guide with Best Practices
- What is SAP HANA | SAP HANA Database Connection | All you need to know [ OverView ]
- SAP BPC – What is Business Planning and Consolidation? : All you need to know [ OverView ]
- Root Cause Analysis: Definition, Examples & Methods | All you need to know [ OverView ]
- Seven Basic Quality Improvement Ishikawa Tools | Important asset to control quality in your project [OverView]
- What is Power BI | Its Use Cases and Applications | All you need to know [ OverView ]
- How and why to measure and analyze employee productivity | Everything You Need to Know
- Top 10 Employee Retention Strategies | Everything You Need to Know
- What are LookML Projects and the Developer Mode | How to Create LookML Projects?
- What are Slowly Changing Dimension | SCD Types and Implementations | Step-By-Step Process
- What is Pareto Chart and How to Create Pareto Chart | A Complete Guide For Beginners
- What does an Agile Business Analyst do | Required Skills, Roles and Responsibilities [ Job & Future ]
- What is Lean Management? | Role and Concepts of Lean Management | Expert’s Top Picks
- A Definitive Guide of Working Capital Management with Best Practices & REAL-TIME Examples
- Business Analytics with Excel Fundamentals | A Complete Guide For Beginners
- Business Analyst : Job Description | All you need to know [ Job & Future ]
- How to create a Splunk Dashboard | A Complete Guide For Beginners [ OverView ]
- What is Splunk Logging ? | The Ultimate Guide with Expert’s Top Picks
- Alteryx vs Tableau | Know Their Differences and Which Should You Learn?
- What is Predictive Analytics? : Step-By-Step Process with REAL-TIME Examples
- An Overview of SAS Stored Processes | The Ultimate Guide with Expert’s Top Picks
- How to Create Conditional Formatting in Cognos Report Studio | A Complete Guide
- Difference between OLTP vs OLAP | Know Their Differences and Which Should You Learn?
- ECBA vs CCBA vs CBAP | A Complete Guide For Beginners | Know Their Differences and Which Should You Learn?
- Import Custom Geocode Data in Tableau | Everything You Need to Know [ OverView ]
- Data Warehouse Tools : Features , Concepts and Architecture
- PGDM vs MBA | Know Their Differences and Which Should You Learn?
- Most Popular Data Visualization Tools | A Complete Beginners Guide | REAL-TIME Examples
- Tableau vs Looker : Comparision and Differences | Which Should You Learn?
- Benefits of Employee Satisfaction for the Organization [ Explained ]
- DAX In Power BI – Learn Power BI DAX Basics [ For Freshers and Experience ]
- Power Bi vs Tableau : Comparision and Differences | Which Should You Learn?
- What is Alteryx Tools | Alteryx ETL Tools | Comprehensive Guide
- What is Tableau Prep? : Comprehensive Guide | Free Guide Tutorial & REAL-TIME Examples
- What are Business Intelligence Tools ? : All you need to know [ OverView ]
- Tableau Aggregate Functions | A Complete Guide with REAL-TIME Examples
- Intervalmatch Function in Qlikview | Everything You Need to Know [ OverView ]
- QlikView Circular Reference | Free Guide Tutorial & REAL-TIME Examples
- Data Blending in Tableau | A Complete Guide with Best Practices | Free Guide Tutorial [ OverView ]
- Splunk vs ELK | Differences and Which Should You Learn? [ OverView ]
- QlikSense vs QlikView | Differences and What to learn and Why?
- What Is Measurement System Analysis | Required Skills | Everything You Need to Know
- Splunk Timechart | Free Guide Tutorial & REAL-TIME Examples
- What Is Image Processing ? A Complete Guide with Best Practices
- What is a Business Analysis ? A Complete Guide with Best Practices
- Top Business Analytics Tools | Comprehensive Guide
- Business Analyst Career Path [ Job & Future ]
- Time Series Analysis Tactics | A Complete Guide with Best Practices
- What is Splunk ? Free Guide Tutorial & REAL-TIME Examples
- Which Certification is Right for You: Six Sigma or Lean Six Sigma?
- SAS Vs R
- Top Technology Trends for 2020
- Data Analyst vs. Data Scientist
- What are the Essential Skills That You Need to Master in Data Analyst?
- What is Six Sigma?
- Common Cause Variation Vs Special Cause Variation
- Reasons to Get a Six Sigma Certification
- What Is Strategic Enterprise Management and its Components?
- What Are The Benefits Measurement Constrained Optimization Methods?
- What Is the Benefit of Modern Data Warehousing?
- What Is Corporate Social Responsibility (CSR)?
- What Is The Purpose and Importance Of Financial Analysis?
- What is Insights-as-a-Service (IaaS)?
- Business Analytics With R Programming Languages
- Where Are The 8 Hidden Wastes?
- What Are Market Structures?
- What is Cost of Quality (COQ)?
- What is Build Verification Testing?
- Quality Improvement in Six Sigma
- What is Process Capability Analysis?
- How To Measure The Effectiveness Of Corporate Training
- SAP Financials And SAP Accounting Modules
- Tips to Learn Tableau
- Why Should I Become a CBAP?
- History And Evolution of Six Sigma
- How to use Control Chart Constants?
- Data Analytics Course For Beginners
- How to Build a Successful Data Analyst Career?
- Data Analytics Vs Business Analytics
- What is SAP Certification?
- Books To Read For a Six Sigma Certification
- Six Sigma Green Belt Salary
- What is the ASAP Methodology?
- Complete list of SAP modules
Time Series Analysis Tactics | A Complete Guide with Best Practices
Last updated on 27th Oct 2022, Artciles, Blog, Business Analytics
- In this article you will learn:
- 1.Introduction.
- 2.Uses of Time Series Analysis.
- 3.Different ways to look at time series.
- 4.Things to Consider in Time Series Analysis.
- 5.Getting the most out of time series analysis.
- 6.Models for analysis of time series.
- 7.How the Methods of Time Series Analysis Work.
- 8.Conclusion.
Introduction:
Time collection analysis is a specific way of looking at a collection of facts and factors that have accumulated over time. In time collection analysis, analysts keep track of data points at regular intervals over a set amount of time, instead of just keeping track of them when they come up or at random. But this kind of evaluation isn’t always just a matter of putting together facts over time. What makes time collection facts different from other facts is that the evaluation can show how variables change over time. In other words, time is a very important factor because it shows how the facts change over time and how they affect the end results. It gives more statistics and a hard-and-fast order of how the facts depend on each other.Time collection analysis usually needs a lot of data points to make sure that it is consistent and reliable. A large data set makes sure that you have a representative sample size and that analysis can sort through noisy data. It also makes sure that any patterns or trends found don’t stand out and can account for seasonal differences. Also, time series facts can be used to make predictions about the future based on what has happened in the past.
Why Does a Company Use Time Series Analysis?
Time collection evaluation helps businesses figure out why changes or systemic patterns have happened over time. Using information visualizations, business customers can see seasonal changes and learn more about why those changes happen. These visualizations can go beyond line graphs in a variety of ways with today’s analytics platforms. When businesses look at information at regular intervals, they can use time series forecasting to figure out how likely things are to happen in the future. Predictive analytics includes time collection forecasting. It can show possible changes in the data, like seasonality or cyclic behavior, which gives a better understanding of the data variables and helps make better predictions. Des Moines Public Schools, for example, looked at five years of student success data to find out who was at risk and how music changed over time. Today’s technology lets us gather a lot of information every day, and it’s easier than ever to get enough consistent information for a full analysis.
Different ways to look at time series:
Even within time collection analysis, there are different types and styles of analysis that can be used to get different results:
- Classification: putting facts into different groups.
- Curve fitting plots the data along a curve to see how the variables in the data are related.
- Descriptive analysis looks at patterns in time series data, such as trends, cycles, or seasonal changes.
- Explanatory analysis: attempts to comprehend facts and their relationships, as well as cause and effect.
- Exploratory analysis shows the most important things about the data set, usually in a visual way.
- Forecasting: It provides information about the future. This style is mostly based on fashions from the past. It uses what happened in the past as a model for what will happen in the future. It can predict what might happen as well as future plot points.
- The evaluation of an intervention looks at how an event can change the facts.
- Segmentation is the process of breaking up the data into pieces that show the underlying properties of the source data.
Things to Consider in Time Series Analysis:
Analysis:When reading a time series, this type of data analysis means finding at least three interesting things about the data. These are autocorrelation, seasonality, and stationarity.
Autocorrelation:Autocorrelation is when facts, observations, and styles tend to repeat themselves over time. If these kinds of observations and styles keep happening to regular people, this is also called seasonality.
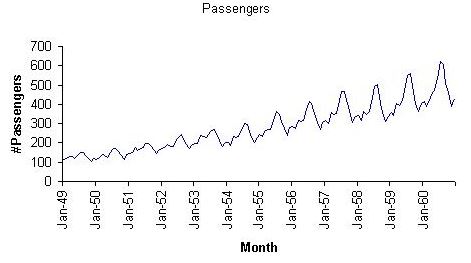
Seasonality:As we’ve already said, “seasonality” is when things like observations and styles happen at regular times. A graph of the temperatures over a few years would be a great example of seasonality. During the summer, the temperature is high, and during the winter, it is low.
Stationarity:Stationarity is a measure of how little the mean and standard deviation of a time series change over time. For example, a time collection might be said to have too much stationarity if, after taking into account the seasonality of the data, the temperatures measured over a ten-year period are all about the same in terms of how important they are and how much they vary.
Getting the most out of time series analysis:
Analysis:Time collection evaluation can help the records analyst in many ways. Different time collection models, which we’ll talk about later, are used to do everything from clean up data to learn about it and help predict future data problems.
Keeping records clean:The first benefit of time collection analysis is that it can help keep records straight. This means that it is possible to find the real “signal” in a set of records by filtering out the noise. If you want to get a general idea of what the data mean, you can remove outliers or use different averages.Cleaning up records is an important part of almost any kind of record analysis. The real benefit of time collection analysis is that it can be done with little extra work.
How to read records:Another benefit of time series analysis is that it can help an analyst better understand a set of records. This is because, as we’ve already talked about, the models used in time series analysis help us figure out what the records really mean.
Trying to guess records: Last but not least, one of the most important benefits of time series analysis is that it can be used to predict records. This is because the very nature of time series analysis is to find patterns in data, which can then be used to predict future data issues.
Models for analysis of time series:
There are different models that can be used to explain and predict records in a time series. In this section, we’ll look at some of the most basic designs:
1.Moving averages: A “changing average” version means that the average of a future data point could be the same as the average of past data points. This simple model does a good job of smoothing out data sets so that you can look at them in their normal form and not worry about data points that are out of the way. But it can make a collection less tied to the seasons.
2.Exponentially smoothing: Exponential smoothing is a different method that predicts future data points based on an average of past data points that gets smaller and smaller as time goes on. In time collection, it is said to be best to follow a shifting common model, in which there is no clear trend or fashion.
How the Methods of Time Series Analysis Work:
Time collection evaluation is a way to read a set of statistical factors that have been collected over a long period of time. In time collection and evaluation, analysts report statistics on factors at constant times over a set period of time. This is better than just recording statistical factors occasionally or at random.
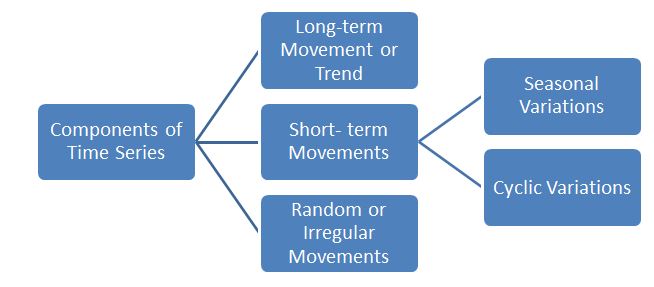
- Parts of Time Series Analysis Strategies.
- Time collection analysis gives you a lot of ways to better understand a dataset.
- The division of time collection into four parts may be the most useful of these.
- Level: The collection’s base price if it had been a straight line.
- Trend: The steady increase or decrease of a collection over time.
- Seasonality occurs when repeated patterns of behavior occur over time.
- Noise is the difference between the observations that can’t be explained by the model.
Tools for Analysis of Time Series:
Just as there are different types and styles, there are also different ways to keep up with news. Here are the three most frequent:
Box: Jenkins ARIMA models are used to get a better understanding of a single time-based variable, such as temperature over time, and to predict the future information points of variables. These styles are based on the idea that information doesn’t change. Analysts should consider and account for as many changes and seasonality in factors other than information as possible. The ARIMA model is helpful because it has words that take into account moving averages, seasonal difference operators, and autoregressive words.
Box-Jenkins Multivariate Models: Multivariate models are used to look at how time-based variables, like temperature and humidity, change over time.
Holt-Winters Method: The Holt-Winters method is a way to make a curve smoother. It is made so that you can expect results if the informational factors include seasonality.
Conclusion:
Time collection analysis is one of the most important parts of data analytics for large businesses because it helps them understand seasonality, trends, cyclicality, and randomness in their income, distribution, and other factors. These factors help groups make well-informed decisions that are very important for business.