
- What is Data Clustering? | A Complete Guide For Beginners [ OverView ]
- What is Regression ? Know about it’s types
- What is Lasso Regression? : Learn With examples
- What is Ridge Regression? Learn with examples
- What is Linear Regression? | A Complete Guide
- What is Linear Regression in Machine Learning?
- Bagging vs Boosting in Machine Learning | Know Their Differences
- What is a Confusion Matrix in Machine Learning? : A Complete Guide For Beginners
- What Is Machine Learning | How It Works and Techniques | All you need to know [ OverView ]
- Support Vector Machine (SVM) Algorithm – Machine Learning | Everything You Need to Know
- Decision Trees in Machine Learning: A Complete Guide with Best Practices
- Pattern Recognition and Machine Learning | A Definitive Guide | Everything You Need to Know [ OverView ]
- An Overview of ML on AWS : Computer Vision, Forecasting
- Keras vs TensorFlow – What to learn and Why? : All you need to know
- Machine Learning Engineer Salary | Required Skills | Everything You Need to Know
- The Best Machine Learning Tools
- Best Deep Learning Books to Read
- Top Machine Learning Projects for Beginners
- Top Machine Learning Algorithms You Need to Know

What is a Confusion Matrix in Machine Learning? : A Complete Guide For Beginners
Last updated on 05th Nov 2022, Artciles, Blog, Machine Learning
- In this article you will learn:
- 1.What Are the Confusion Matrices and Why Do Need Them?
- 2.How to Create a 2×2 Confusion Matrix?
- 3.Confusion Matrix Metrics.
- 4.Scaling a Confusion Matrix.
- 5.Confusion Matrix With Python.
- 6.Conclusion.
What Are the Confusion Matrices and Why Do Need Them?
- Classification Models have the multiple categorical outputs. Most error measures will calculate a total error in a model but cannot find individual instances of errors in a model. The model might misclassify some of categories more than others but cannot see this using a standard accuracy measure.
- Furthermore suppose there is the significant class imbalance in a given data. In that case i.e. a class has a more instances of data than the other classes a model might predict majority class for all the cases and have a high accuracy score when it is not a predicting the minority classes. This is where a confusion matrices are useful.
- The confusion matrix is the matrix used to determine the performance of a classification models for a given set of a test data. It can only be determined if a true values for test data are known. The matrix itself can be an easily understood but are related terminologies may be confusing. Since it shows an errors in a model performance in the form of matrix hence also known as error matrix.
- A confusion matrix presents the table layout of a various outcomes of a prediction and results of a classification problem and helps to visualize its outcomes.
- It plots a table of all predicted and the actual values of a classifier.
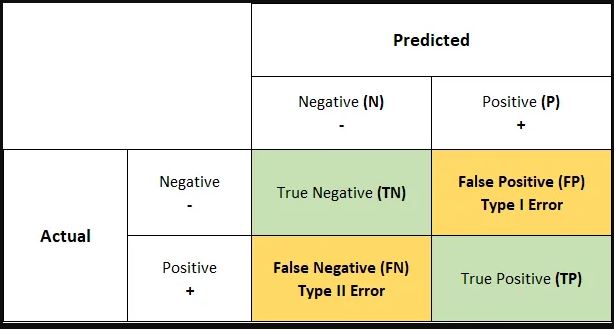
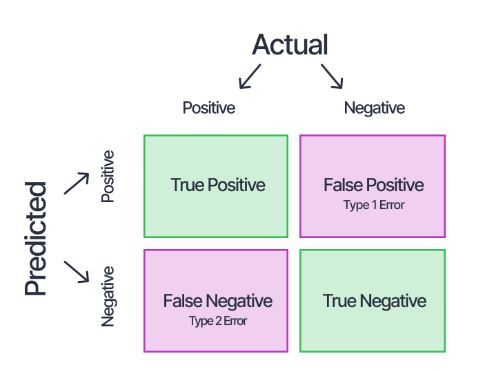
How to Create a 2×2 Confusion Matrix?
Can obtain a four different combinations from a predicted and actual values of the classifier:
True Positive: The number of times are actual positive values are equal to a predicted positive. A predicted a positive value and it is be correct.
False Positive: The number of times are model wrongly predicts a negative values as positives. And predicted a negative value and it is an actually positive.
True Negative: The number of times are actual negative values are equal to be predicted negative values. A predicted a negative value, and it is an actually negative.
False Negative: The number of times are model wrongly predicts a negative values as positives. A predicted a negative value and it is an actually positive.
Confusion Matrix Metrics:
Consider the confusion matrix made for a classifier that classifies a people based on whether they speak a English or Spanish.
- True Positives (TP) = 86
- True Negatives (TN) = 79
- False Positives (FP) = 12
- False Negatives (FN) = 10
From the matrix, the performance of a model is not very clear. To find how accurate the model is, use the following metrics:
Accuracy: The accuracy is used to find a portion of correctly classified values. It tells us how often the classifier is right. It is a sum of all true values divided by a total values.
Precision: Precision is used to calculate a model’s ability to classify the positive values correctly. It is a true positives divided by a total number of a predicted positive values.
Recall: It is used to calculate a model’s ability to predict positive values. How often does a model predict a correct positive values. It is the true positives divided by a total number of the actual positive values.
F1-Score: It is harmonic mean of a Recall and Precision. It is useful when need to take a both Precision and Recall into an account.
Scaling a Confusion Matrix:
To scale a confusion matrix, increase a number of rows and columns. All True Positives will be along diagonal. The other values will be a False Positives or False Negatives.Now that are understand what a confusion matrix is and its be inner working let’s explore how find accuracy of a model with a hands-on demo on confusion matrix with the Python.
Confusion Matrix With Python:
- Will build a logistic regression model using the heart attack dataset to predict if a patient is at a risk of heart attack.
- Depicted below is a dataset that are be using for this demonstration.
- Let’s import a necessary libraries to create a model.
- Can import confusion matrix function from a sklearn.metrics. Let’s split a dataset into the input features and target output dataset.
- As can see our data contains the massive range of values, some are the single digits, and some have three numbers. To make a calculations more straightforward, will scale a data and reduce it to a small range of the values using a Standard Scaler.
- Now let’s split a dataset into the two: one to train a model and another to test a model. To do this, use a train_test_split imported from sklearn. Using the Logistic Regression Model will perform the Classification on a train data and predict a test data to check an accuracy.
- To find accuracy of the confusion matrix and all other metrics and can import a accuracy_score and classification_report from a same library.
- The accuracy_score gives us an accuracy of a classifier.
- Using a predicted values(pred) and an actual values(y_test) can create a confusion matrix with a confusion_matrix function.
- Then using a ravel() method of a confusion_matrix function and can get a True Positive, True Negative, False Positive and False Negative values.
- Finally using a classification_report and can find the values of various metrics of a confusion matrix.
Conclusion:
In this article – The Best Guide to a Confusion Matrix, have looked at what a confusion matrix is and why are use a confusion matrices. Then looked at how to create the 2X2 confusion matrix and calculate a confusion matrix metrics using it.And took a look at how be confusion matrices can be scaled up to the include more than two classification classes and finally got hands-on experience with the confusion matrices by implementing them in a Python. In a machine learning, Classification is used to split a data into the categories. But the after cleaning and preprocessing a data and training our model how do know if our classification model performs well.A confusion matrix is used to measure a performance of a classifier in a depth.