
- What is Dimension Reduction? | Know the techniques
- Top Data Science Software Tools
- What is Data Scientist? | Know the skills required
- What is Data Scientist ? A Complete Overview
- Know the difference between R and Python
- What are the skills required for Data Science? | Know more about it
- What is Python Data Visualization ? : A Complete guide
- Data science and Business Analytics? : All you need to know [ OverView ]
- Supervised Learning Workflow and Algorithms | A Definitive Guide with Best Practices [ OverView ]
- Open Datasets for Machine Learning | A Complete Guide For Beginners with Best Practices
- What is Data Cleaning | The Ultimate Guide for Data Cleaning , Benefits [ OverView ]
- What is Data Normalization and Why it is Important | Expert’s Top Picks
- What does the Yield keyword do and How to use Yield in python ? [ OverView ]
- What is Dimensionality Reduction? : ( A Complete Guide with Best Practices )
- What You Need to Know About Inferential Statistics to Boost Your Career in Data Science | Expert’s Top Picks
- Most Effective Data Collection Methods | A Complete Beginners Guide | REAL-TIME Examples
- Most Popular Python Toolkit : Step-By-Step Process with REAL-TIME Examples
- Advantages of Python over Java in Data Science | Expert’s Top Picks [ OverView ]
- What Does a Data Analyst Do? : Everything You Need to Know | Expert’s Top Picks | Free Guide Tutorial
- How To Use Python Lambda Functions | A Complete Beginners Guide [ OverView ]
- Most Popular Data Science Tools | A Complete Beginners Guide | REAL-TIME Examples
- What is Seaborn in Python ? : A Complete Guide For Beginners & REAL-TIME Examples
- Stepwise Regression | Step-By-Step Process with REAL-TIME Examples
- Skewness vs Kurtosis : Comparision and Differences | Which Should You Learn?
- What is the Future scope of Data Science ? : Comprehensive Guide [ For Freshers and Experience ]
- Confusion Matrix in Python Sklearn | A Complete Beginners Guide | REAL-TIME Examples
- Polynomial Regression | All you need to know [ Job & Future ]
- What is a Web Crawler? : Expert’s Top Picks | Everything You Need to Know
- Pandas vs Numpy | What to learn and Why? : All you need to know
- What Is Data Wrangling? : Step-By-Step Process | Required Skills [ OverView ]
- What Does a Data Scientist Do? : Step-By-Step Process
- Data Analyst Salary in India [For Freshers and Experience]
- Elasticsearch vs Solr | Difference You Should Know
- Tools of R Programming | A Complete Guide with Best Practices
- How To Install Jenkins on Ubuntu | Free Guide Tutorial
- Skills Required to Become a Data Scientist | A Complete Guide with Best Practices
- Applications of Deep Learning in Daily Life : A Complete Guide with Best Practices
- Ridge and Lasso Regression (L1 and L2 regularization) Explained Using Python – Expert’s Top Picks
- Simple Linear Regression | Expert’s Top Picks
- Dispersion in Statistics – Comprehensive Guide
- Future Scope of Machine Learning | Everything You Need to Know
- What is Data Analysis ? Expert’s Top Picks
- Covariance vs Correlation | Difference You Should Know
- Highest Paying Jobs in India [ Job & Future ]
- What is Data Collection | Step-By-Step Process
- What Is Data Processing ? A Step-By-Step Guide
- Data Analyst Job Description ( A Complete Guide with Best Practices )
- What is Data ? All you need to know [ OverView ]
- What Is Cleaning Data ?
- What is Data Scrubbing?
- Data Science vs Data Analytics vs Machine Learning
- How to Use IF ELSE Statements in Python?
- What are the Analytical Skills Necessary for a Successful Career in Data Science?
- Python Career Opportunities
- Top Reasons To Learn Python
- Python Generators
- Advantages and Disadvantages of Python Programming Language
- Python vs R vs SAS
- What is Logistic Regression?
- Why Python Is Essential for Data Analysis and Data Science
- Data Mining Vs Statistics
- Role of Citizen Data Scientists in Today’s Business
- What is Normality Test in Minitab?
- Reasons You Should Learn R, Python, and Hadoop
- A Day in the Life of a Data Scientist
- Top Data Science Programming Languages
- Top Python Libraries For Data Science
- Machine Learning Vs Deep Learning
- Big Data vs Data Science
- Why Data Science Matters And How It Powers Business Value?
- Top Data Science Books for Beginners and Advanced Data Scientist
- Data Mining Vs. Machine Learning
- The Importance of Machine Learning for Data Scientists
- What is Data Science?
- Python Keywords
Covariance vs Correlation | Difference You Should Know
Last updated on 27th Oct 2022, Artciles, Blog, Data Science
- In this article you will learn:
- 1.Introduction
- 2.What Is the Meaning of Covariance?
- 3.Application Of Correlation
- 4.Three varieties of correlation exist
- 5.A correlation matrix is calculated for three primary purposes
- Difference Between Correlation and Covariance
- Compared to Covariance
- 6.Conclusion
Introduction
Covariance and correlation are two opposing notions utilized in statistics and regression analysis. Covariance reveals how the two variables differ, whereas correlation reveals how they are related. By looking at covariance and correlation, this tutorial will help you understand how they are different.
What Is the Meaning of Covariance?
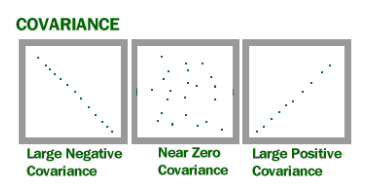
- Covariance is a statistical word that describes a relationship between two random variables in which a change in one variable reflects a change in the other.
- Covariance values can range between – and +, with negative values suggesting a negative association and positive values showing a positive relationship.
- The higher this number, the closer the relationship. Positive covariance represents a direct relationship and is denoted by a positive value.
- In contrast, a negative number implies negative covariance, which suggests an inverse link between the two variables. Covariance is excellent for characterizing the nature of a relationship but horrible for determining its magnitude.
If (X) and (Y) are the variables’ expected values, the covariance formula can be expressed as:
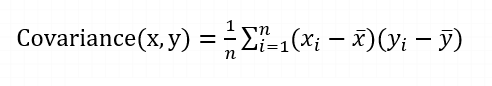
Where,
xi = data value of x
yi = data value of y
x̄ = mean of x
ȳ = mean of y
N = number of data values.
Application Of Correlation
The following are the most frequent uses for Covariance:
- Using Cholesky decomposition, systems with numerous correlated variables are simulated. The positive semidefinite nature of a covariance matrix aids in determining the Cholesky decomposition. The matrix is decomposed by multiplying the submatrix with its transpose.
- Principal component analysis is utilized to minimize the dimensions of huge data sets. To do principal component analysis, the covariance matrix is subjected to an eigen decomposition.
What Is the Meaning of Correlation?
In statistics, correlation is a way to measure how much the movements of two or more random variables follow each other. During the study of two variables, variables are said to be correlated when an analogous movement of another variable reciprocates the movement of one variable in some kind. The correlation formula is:
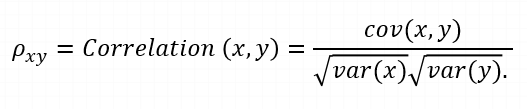
where,
var(X) = standard deviation of X
var(Y) = standard deviation of Y
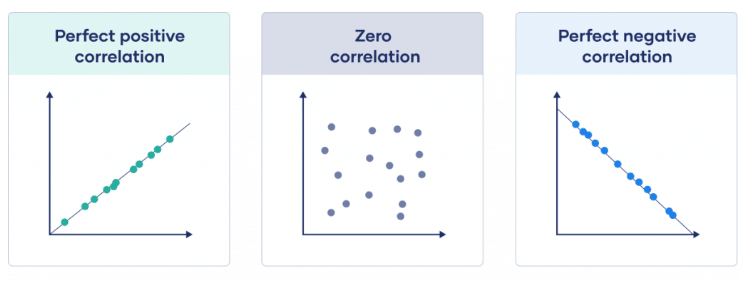
When there is a positive correlation between two variables, they move in the same direction. When variables move in opposing directions, a negative correlation is observed.
Three varieties of correlation exist:
- In simple correlation, a single number indicates the degree of relationship between two variables.
- When the effects of one variable are taken away, the relationship between two variables becomes clear.
Multiple correlations: A statistical strategy in which two or more variables are used to predict the value of one variable.Calculation Methods for Correlation. There are a variety of correlation coefficient. Here are a few of the most prevalent:
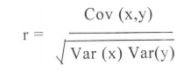
Pearson’s coefficient of correlation
This is the most prevalent technique for calculating the correlation coefficient between two variables. It is calculated by dividing the covariance between two variables by the product of their standard deviations.
Correlation Coefficient by Rank
A rank correlation coefficient measures how much two variables are alike and can be used to figure out how important their relationship is. It measures the degree to which one variable drops as another one increases.
where,
ρ = coefficient of rank relation
D = difference between paired ranks
N = number of items ranked
Coefficient of Parallel Variations
The coefficient of concurrent deviations is utilized when the association is to be studied in a fairly casual manner and there is little demand for precision.
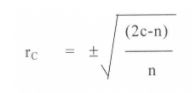
where,
rc = coefficient of concurrent deviations
n = number of pairs of deviations
We will keep looking at the differences between covariance and correlation by looking at these ways the correlation matrix can be used.
A correlation matrix is calculated for three primary purposes:
- When working with vast amounts of data, the objective is to identify patterns. Consequently, a correlation matrix is employed to search for a pattern in the data and establish whether the variables are highly connected.
- Useful for other analyses. When missing values are taken into account pairwise, correlation matrices are often used as inputs for exploratory component analysis, confirmatory factor analysis, structural equation models, and linear regression.
- As a diagnostic while verifying other analyses. For example, if there are a lot of correlations, linear regression estimates will be wrong.
Difference Between Correlation and Covariance:
- Covariance and correlation are opposite terms that are used in statistics and regression analysis. Covariance refers to the extent to which two variables vary from one another, whereas correlation refers to the relationship between the variables and the way they’re related.
- Correlation and variance are mathematical concepts that can be used to figure out how two random variables are related. Correlation describes how a change in one variable can influence a decision, while variance describes how items vary over time. Confusing? Let’s delve in evenly to comprehend the distinction between these closely related phrases.
Compared to Covariance:
As was already said, variance shows how different variables are from each other, while correlation shows the strength and direction of this request. Variance and correlation are interdependent in several ways. Correlation, in simple terms, refers back to the scaled model of variance. In this sense, the correlation may be a special case of variance that may be calculated when the statistics are in a standardized form.
The primary distinctions between variance and correlation can also be summed up as follows:
- What degree do they hold? Variance measures whether or not or not a version in one variable results in a version in the opposite variable; for example, determining whether or not growth in one variable results in an increase, a decrease, or no trade in the alternative variable. Correlation evaluates the direction in addition to the strength of the relationship between variables (i.e. however powerfully those variables are related to each other).
- Relationship constraints: Variance shows how the simplest variables in a set of data change over time, while correlation shows the linear relationships between variables or statistical units.
- Despite the fact that both the coefficient of correlation and the variance are measurements of linear association, correlation coefficients are standardized, hence displaying an absolute fee within a predefined range from -1 to 1. On the other hand, variance values are not standardized and employ an unlimited range from – to +, which makes variance interpretation more challenging.
- The correlation coefficient is dimensionless, i.e., it is a unit-free measure of the relationship between variables. In contrast, variance is measured in units and is found by multiplying the unit of one variable by the unit of the other variable.
- Change in scale: variance is full of the exchange scale, i.e., if all the values of one variable are gradually increased and all the values of the other variable are gradually increased, then the variance is modified. In contrast, correlation is not at the top of the exchange scale.
Conclusion :
Correlation and covariance are incredibly interdependent, but they fluctuate substantially. Covariance talks about the kind of interaction, while correlation talks about both the kind of interaction and how strong it is. Due to this, correlation is often referred to as the sole instance of covariance. However, if one had to choose between the two, the majority of analysts would choose correlation because it is unaffected by changes in dimensions, locations, and size. Also, because the range is limited to -1 to +1, it is helpful to compare variables from different domains. However, a significant disadvantage is that each of these concepts demonstrates a linear relationship.