
- File formats in Hadoop Tutorial | A Concise Tutorial Just An Hour
- Controlling Hadoop Jobs Using Oozie Tutorial | The Complete Guide
- Apache Spark Streaming Tutorial | Best Guide For Beginners
- What is Elasticsearch | Tutorial for Beginners
- Amazon Kinesis : Process & Analyze Streaming Data | The Ultimate Student Guide
- Apache Camel Tutorial – EIP, Routes, Components | Ultimate Guide to Learn [BEST & NEW]
- Apache NiFi (Cloudera DataFlow) | Become an expert with Free Online Tutorial
- Kafka Tutorial : Learn Kafka Configuration
- Apache Sqoop Tutorial
- Spark And RDD Cheat Sheet Tutorial
- Apache Pig Tutorial
- Talend
- Cassandra Tutorial
- Kafka Tutorial
- HBase Tutorial
- Spark Java Tutorial
- ELK Stack Tutorial
- Netbeans Tutorial
- PySpark MLlib Tutorial
- Spark RDD Optimization Techniques Tutorial
- Apache Spark & Scala Tutorial
- Apache Impala Tutorial
- Apache Oozie: A Concise Tutorial Just An Hour | LearnoVita
- Apache Storm Advanced Concepts Tutorial
- Apache Storm Tutorial
- Hadoop Mapreduce tutorial
- Hive cheat sheet
- Spark Algorithm Tutorial
- Apache Spark Tutorial
- Apache Cassandra Data Model Tutorial
- Big Data Applications Tutorial
- Advanced Hive Concepts and Data File Partitioning Tutorial
- Hadoop Architecture Tutorial
- Big Data and Hadoop Ecosystem Tutorial
- Apache Mahout Tutorial
- Hadoop Tutorial
- BIG DATA Tutorial

PySpark MLlib Tutorial
Last updated on 12th Oct 2020, Big Data, Blog, Tutorials
Apache Spark comes with a library named MLlib to perform Machine Learning tasks using the Spark framework. Since there is a Python API for Apache Spark, i.e., PySpark, you can also use this Spark ML library in PySpark. MLlib contains many algorithms and Machine Learning utilities.
In this tutorial, you will learn how to use Machine Learning in PySpark. The dataset of Fortune 500 is used in this tutorial to implement this. This dataset consists of the information related to the top 5 companies ranked by Fortune 500 in the year 2017. This tutorial will use the first five fields.
The dataset looks like below:
| Rank | Title | Website | Employees | Sector |
|---|---|---|---|---|
| 1 | Walmart | http://www.walmart.com | 2,300,000 | Retail |
| 2 | Berkshire Hathaway | http://www.berkshirehathaway.com | 367,700 | Finance |
| 3 | Apple | http://www.apple.com | 116,000 | Technology |
| 4 | ExxonMobil | http://www.exxonmobil.com | 72,700 | Energy |
| 5 | McKesson | http://www.mckesson.com | 68,000 | Wholesale |
In this Spark ML tutorial, you will implement Machine Learning to predict which one of the fields is the most important factor to predict the ranking of the above-mentioned companies in the coming years. Also, you will use DataFrames to implement Machine Learning.
Before diving right into this Spark MLlib tutorial, have a quick rundown of all the topics included in this tutorial:
Subscribe For Free Demo
Error: Contact form not found.
What is Machine Learning?
Machine Learning is one of the many applications of Artificial Intelligence (AI) where the primary aim is to enable computers to learn automatically without any human assistance. With the help of Machine Learning, computers are able to tackle the tasks that were, until now, only handled and carried out by people. It is basically a process of teaching a system on how to make accurate predictions when fed with the right data. It has the ability to learn and improve from past experience without being specifically programmed for a task. Machine Learning mainly focuses on developing computer programs and algorithms that make predictions and learn from the provided data.
First, learn the basics of DataFrames in PySpark to get started with Machine Learning in PySpark.
DataFrames
What are DataFrames?
DataFrame is a new API for Apache Spark. It is basically a distributed, strongly-typed collection of data, i.e., a dataset, which is organized into named columns. A DataFrame is equivalent to what a table is in a relational database, except for the fact that it has richer optimization options.
How to create DataFrames?
There are multiple ways to create DataFrames in Apache Spark:
- DataFrames can be created using an existing RDD
- You can create a DataFrame by loading a CSV file directly
- You can programmatically specify a schema to create a DataFrame
This tutorial uses DataFrames created from an existing CSV file.
What is PySpark MLlib?
Basic Introduction to PySpark MLlib
Spark MLlib is the short form of the Spark Machine Learning library. Machine Learning in PySpark is easy to use and scalable. It works on distributed systems. You can use Spark Machine Learning for data analysis. There are various techniques you can make use of with Machine Learning algorithms such as regression, classification, etc., all because of the PySpark MLlib.
Parameters in PySpark MLlib
Some of the main parameters of PySpark MLlib are listed below:
- Ratings: This parameter is used to create an RDD of ratings, rows, or tuples.
- Rank: It shows the number of features computed and ranks them.
- Lambda: Lambda is a regularization parameter.
- Blocks: Blocks are used to parallel the number of computations. The default value for this is −1.
Performing Linear Regression on a Real-world Dataset
Let’s understand Machine Learning better by implementing a full-fledged code to perform Loading Data
As mentioned above, you are going to use a DataFrame that is created directly from a CSV file. Following are the commands to load data into a DataFrame and to view the loaded data.
Input: In [1]:- from pyspark import SparkConf, SparkContext
- from pyspark.sql import SQLContext
- Sc = SparkContext()
- sqlContext = SQLContext(sc)
company_df=sqlContext.read.format(‘com.databricks.spark.csv’).options(header=’true’, inferschema=’true’).load(‘C:/Users/intellipaat/Downloads/spark-2.3.2-bin-hadoop2.7/Fortune5002017.csv’)
company_df.take(1)
You can choose the number of rows you want to view while displaying the data of the DataFrame. Here, only the first row is displayed.
Output:Out[2][Row (Rank=1, Title= ‘Walmart’, Website= ‘http:/www.walmart.com’, Employees-2300000, Sector= ‘retailing’)]
Data Exploration
To check the data type of every column of a DataFrame and to print the schema of the DataFrame in a tree format, you can use the following commands, respectively:
Input:In[3]- company_df.cache()
- company_df.printSchema()
DataFrame[Rank: int, Title: string, Website: string, Employees: Int, Sector: string]
root
|– Rank: integer (nullable = true)
|– Title: string (nullable = true)
|– Website: string (nullable = true)
|– Employees: integer (nullable = true)
|– Sector: string (nullable = true)
Performing Descriptive Analysis
Input:In [4]company_df.describe().toPandas().transpose()
Output:Out [4]| 0 | 1 | 2 | 3 | 4 | |
| Summary | count | mean | stddev | min | max |
|---|---|---|---|---|---|
| Rank | 5 | 3.0 | 1.581138830084 | 1 | 5 |
| Title | 5 | None | None | Apple | Walmart |
| Website | 5 | None | None | www.apple.com | www.walmart.com |
| Employees | 5 | 584880.0 | 966714.2168190142 | 68000 | 2300000 |
| Sector | 5 | None | None | Energy | Wholesalers |
Finding the Correlation Between Independent Variables
To find out if any of the variables, i.e., fields have correlations or dependencies, you can plot a scatter matrix. Plotting a scatter matrix is one of the best ways in Machine Learning to identify linear correlations if any.
You can plot a scatter matrix on your DataFrame using the following code:
Input:In [5]import pandas as pdnumeric_features = [t[0] for t in company_df.dtypes if t[1] == ‘int’ or t[1] == ‘double’]
- sampled_data = company_df.select(numeric_features).sample(False, 0.8).toPandas()
- axs = pd.scatter_matrix(sampled_data, figsize=(10, 10))
- n = len(sampled_data.columns)
- for i in range(n):
- v = axis[i, 0]
- v.yaxis.label.set_rotation(0)
- v.yaxis.label.set_ha(‘right’)
- v.set_yticks(())
- h = axs[n-1, i]
- h.xaxis.label.set_rotation(90)
- h.set_xticks(())
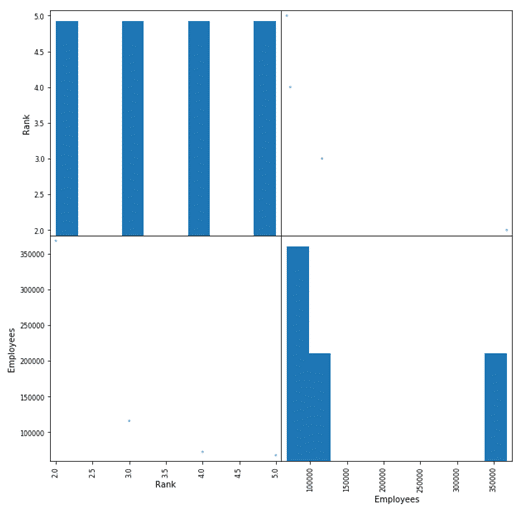
Here, you can come to the conclusion that in the dataset, the “Rank” and “Employees” columns have a correlation. Let’s dig a little deeper into finding the correlation specifically between these two columns.
Correlation Between Independent Variables
Input:In [6]-
if not( isinstance(company_df.select(i).take(1)[0][0], six.string_types)):
- print( “Correlation to Employees for “, i, company_df.stat.corr(‘Employees’,i))
Correlation to Employees for Rank −0.778372714650932
Correlation to Employees 1.0
The value of correlation ranges from −1 to 1, the closer it is to ‘1’ the more positive correlation can be found between the fields. If the value is closer to −1, it means that there is a strong negative correlation between the fields. Now, you can analyze your output and see if there is a correlation or not, and if there is, then if it is a strong positive or negative correlation.
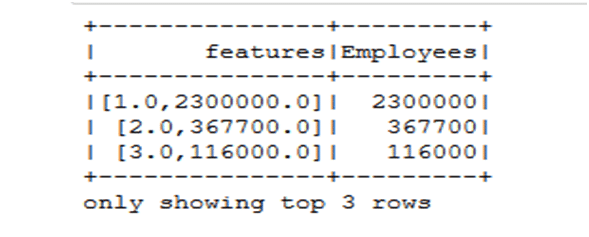
Preparing Data
Input:In [7]- from pyspark.ml.feature import VectorAssembler
- vectorAssembler = VectorAssembler(inputCols = [‘Rank’, ‘Employees’], outputCol = ‘features’)
- tcompany_df = vectorAssembler.transform(company_df)
- tcompany_df = tcompany_df.select([‘features’, ‘Employees’])
- tcompany_df.show(3)
Input:
In [8]- splits = tcompany_df.randomSplit([0.7, 0.3])
- train_df = splits[0]
- test_df = splits[1]
Linear Regression
Input:In [10]- from pyspark.ml.regression import LinearRegression
- lr = LinearRegression(featuresCol = ‘features’, labelCol=’Employees’, maxIter=10, regParam=0.3, elasticNetParam=0.8)
- lr_model = lr.fit(train_df)
- print(“Coefficients: ” + str(lr_model.coefficients))
- print(“Intercept: ” + str(lr_model.intercept))
Coefficients: [-32251.88812374517, 0.9255193858709874]
Intercept: 140317.88600801243
After performing linear regression on the dataset, you can finally come to the conclusion that ‘Employees’ is the most important field or factor, in the given dataset, which can be used to predict the ranking of the companies in the coming future. ‘Ranks’ has a linear correlation with ‘Employees,’ indicating that the number of employees in a particular year, in the companies in our dataset, has a direct impact on the Rank of those companies.
Features of Spark MLlib Library
- MLlib provides algorithmic optimizations for accurate predictions and efficient distributed learning. For instance, the alternating least squares machine learning algorithms for making recommendations effectively uses blocking to reduce JVM garbage collection overhead.
- MLlib benefits from its tight integration with various spark components. MLlib leverages high level libraries packaged with the Spark framework – Spark Core (has over 80 operators for data cleaning and featurization), Spark SQL, Spark Streaming and GraphX.
- MLlib provides a package called spark.ml to simplify the development and performance tuning of multi-stage machine learning pipelines. When working with large datasets, the process of patching an end-to-end pipeline is expensive in terms of network overhead and labour-intensive. MLlib eases this by providing high-level API’s which help data scientists swap out a standard learning approach instead of using their own specialized machine learning algorithms.
- MLlib provides fast and distributed implementations of common machine learning algorithms along with a number of low-level primitives and various utilities for statistical analysis, feature extraction, convex optimizations, and distributed linear algebra.
- Spark MLlib library has extensive documentation which describes all the supported utilities and methods with several spark machine learning example codes and the API docs for all the supported languages.
- MLlib has a very active open source community and frequent event meetups to encourage community contributions and enhancements to the library over time. With wide number of Spark use cases for MLlib and contributions from large number of developers, the adoption of Spark MLlib for Machine Learning is growing rapidly.
Machine Learning in the Industry
Computer systems with the ability to learn to predict from a given data and improve themselves without having to be reprogrammed used to be a dream until recent years. But now, it has been made possible using Machine Learning. Today, Machine Learning is the most used branch of Artificial Intelligence that is being adopted by big industries in order to benefit their businesses.
Following are some of the organizations where Machine Learning has various use cases:
- PayPal: PayPal uses Machine Learning to detect suspicious activity.
- IBM: There is a Machine Learning technology patented by IBM that helps decide when to hand over the control of a self-driving vehicle between a vehicle control processor and a human driver.
- Google: Machine Learning is used to gather information from users that is further used to improve its search engine results.
- Walmart: Machine Learning in Walmart is used to improve its efficiency.
- Amazon: Amazon uses Machine learning to design and implement personalized product recommendations.
- Facebook: Machine Learning is used to filter out poor quality content.
Conclusion
Machine Learning denotes a step taken forward in how computers can learn and make predictions. It has applications in various sectors and is being extensively used. Having knowledge of Machine Learning will not only open multiple doors of opportunities for you, but it also makes sure that, if you have mastered Machine Learning, you are never out of jobs.
Machine Learning has been gaining popularity ever since it came into the picture and it won’t stop any time soon.