
- What is Lean?| Everything You Need to Know
- What is SAP Workflow? : A Complete Guide
- Difference between Tableau and Power BI | Benefits and Special Features
- Data Warehouse in Tableau | Everything You Need to Know
- What is Tableau Server?| Everything You Need to Know | A Definitive Guide
- What is Dax in Power BI? | A Comprehensive Guide
- Upgrade in Tableau Desktop and Web Authoring | A Complete Guide with Best Practices
- What is SAP HANA | SAP HANA Database Connection | All you need to know [ OverView ]
- SAP BPC – What is Business Planning and Consolidation? : All you need to know [ OverView ]
- Root Cause Analysis: Definition, Examples & Methods | All you need to know [ OverView ]
- Seven Basic Quality Improvement Ishikawa Tools | Important asset to control quality in your project [OverView]
- What is Power BI | Its Use Cases and Applications | All you need to know [ OverView ]
- How and why to measure and analyze employee productivity | Everything You Need to Know
- Top 10 Employee Retention Strategies | Everything You Need to Know
- What are LookML Projects and the Developer Mode | How to Create LookML Projects?
- What are Slowly Changing Dimension | SCD Types and Implementations | Step-By-Step Process
- What is Pareto Chart and How to Create Pareto Chart | A Complete Guide For Beginners
- What does an Agile Business Analyst do | Required Skills, Roles and Responsibilities [ Job & Future ]
- What is Lean Management? | Role and Concepts of Lean Management | Expert’s Top Picks
- A Definitive Guide of Working Capital Management with Best Practices & REAL-TIME Examples
- Business Analytics with Excel Fundamentals | A Complete Guide For Beginners
- Business Analyst : Job Description | All you need to know [ Job & Future ]
- How to create a Splunk Dashboard | A Complete Guide For Beginners [ OverView ]
- What is Splunk Logging ? | The Ultimate Guide with Expert’s Top Picks
- Alteryx vs Tableau | Know Their Differences and Which Should You Learn?
- What is Predictive Analytics? : Step-By-Step Process with REAL-TIME Examples
- An Overview of SAS Stored Processes | The Ultimate Guide with Expert’s Top Picks
- How to Create Conditional Formatting in Cognos Report Studio | A Complete Guide
- Difference between OLTP vs OLAP | Know Their Differences and Which Should You Learn?
- ECBA vs CCBA vs CBAP | A Complete Guide For Beginners | Know Their Differences and Which Should You Learn?
- Import Custom Geocode Data in Tableau | Everything You Need to Know [ OverView ]
- Data Warehouse Tools : Features , Concepts and Architecture
- PGDM vs MBA | Know Their Differences and Which Should You Learn?
- Most Popular Data Visualization Tools | A Complete Beginners Guide | REAL-TIME Examples
- Tableau vs Looker : Comparision and Differences | Which Should You Learn?
- Benefits of Employee Satisfaction for the Organization [ Explained ]
- DAX In Power BI – Learn Power BI DAX Basics [ For Freshers and Experience ]
- Power Bi vs Tableau : Comparision and Differences | Which Should You Learn?
- What is Alteryx Tools | Alteryx ETL Tools | Comprehensive Guide
- What is Tableau Prep? : Comprehensive Guide | Free Guide Tutorial & REAL-TIME Examples
- What are Business Intelligence Tools ? : All you need to know [ OverView ]
- Tableau Aggregate Functions | A Complete Guide with REAL-TIME Examples
- Intervalmatch Function in Qlikview | Everything You Need to Know [ OverView ]
- QlikView Circular Reference | Free Guide Tutorial & REAL-TIME Examples
- Data Blending in Tableau | A Complete Guide with Best Practices | Free Guide Tutorial [ OverView ]
- Splunk vs ELK | Differences and Which Should You Learn? [ OverView ]
- QlikSense vs QlikView | Differences and What to learn and Why?
- What Is Measurement System Analysis | Required Skills | Everything You Need to Know
- Splunk Timechart | Free Guide Tutorial & REAL-TIME Examples
- What Is Image Processing ? A Complete Guide with Best Practices
- What is a Business Analysis ? A Complete Guide with Best Practices
- Top Business Analytics Tools | Comprehensive Guide
- Business Analyst Career Path [ Job & Future ]
- Time Series Analysis Tactics | A Complete Guide with Best Practices
- What is Splunk ? Free Guide Tutorial & REAL-TIME Examples
- Which Certification is Right for You: Six Sigma or Lean Six Sigma?
- SAS Vs R
- Top Technology Trends for 2020
- Data Analyst vs. Data Scientist
- What are the Essential Skills That You Need to Master in Data Analyst?
- What is Six Sigma?
- Common Cause Variation Vs Special Cause Variation
- Reasons to Get a Six Sigma Certification
- What Is Strategic Enterprise Management and its Components?
- What Are The Benefits Measurement Constrained Optimization Methods?
- What Is the Benefit of Modern Data Warehousing?
- What Is Corporate Social Responsibility (CSR)?
- What Is The Purpose and Importance Of Financial Analysis?
- What is Insights-as-a-Service (IaaS)?
- Business Analytics With R Programming Languages
- Where Are The 8 Hidden Wastes?
- What Are Market Structures?
- What is Cost of Quality (COQ)?
- What is Build Verification Testing?
- Quality Improvement in Six Sigma
- What is Process Capability Analysis?
- How To Measure The Effectiveness Of Corporate Training
- SAP Financials And SAP Accounting Modules
- Tips to Learn Tableau
- Why Should I Become a CBAP?
- History And Evolution of Six Sigma
- How to use Control Chart Constants?
- Data Analytics Course For Beginners
- How to Build a Successful Data Analyst Career?
- Data Analytics Vs Business Analytics
- What is SAP Certification?
- Books To Read For a Six Sigma Certification
- Six Sigma Green Belt Salary
- What is the ASAP Methodology?
- Complete list of SAP modules

Difference between Tableau and Power BI | Benefits and Special Features
Last updated on 30th Jan 2023, Artciles, Blog, Business Analytics
- In this article you will get
- What is Power BI?
- What is Tableau?
- Difference between Tableau vs Power BI
- Advantages of Tableau
- Advantages of Power BI
- Disadvantages of Power BI
- Disadvantages of Tableau
- Features of Power BI
- Features of Tableau
- Conclusion
What is Power BI?
Power BI is the Business Intelligence and Data Visualization tool which helps to convert a data from the various data source into interactive dashboards and also BI reports. It also provides the multiple software connectors and services. Microsoft Power BI is the business intelligence tool that helps to handle data from various sources and provides visualization after the cleaning and integration process. It also provides a feature of Adhoc report generation, which helps in analysis of a data.
What is Tableau?
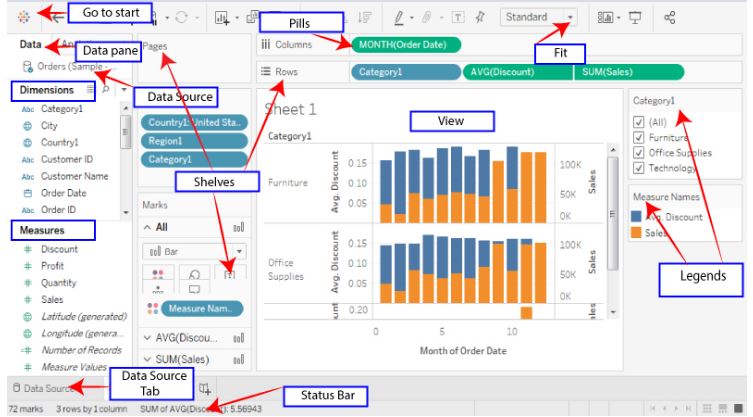
Tableau is the powerful and fastest-growing data visualization tool used in a business intelligence industry. It allows to simplify a raw data into a more easily understandable format.This helps professionals to understand a data that is created using a Tableau at any level in organization.
Difference Between the Tableau vs Power BI
| Tableau | Power BI |
|---|---|
| Tableau can handle big volume of data with a better performance. | Power BI can handle the limited volume of a data. |
| Tableau platform is known for a data visualization functionality. The users can use a 24 various types of visualizations in Tableau. | Power BI provides a numerous data points to offer data visualization. lt is offering a more than 3500 data points for drilling down a dataset. |
| Tableau has an excellent customer support. It has large community forum for a discussions. | Power BI provides the limited customer support to its users with free Power Bl account. However, the paid version users will get a faster support compared with a free version. |
| An Analysts and experienced- users mostly use for a analytics purposes. | It is used by both the naive and experienced users. |
| Tableau is a complex. | Power BI Interface is more easy to learn. |
| Tableau deploys a MDX for measures and dimensions. | Power BI uses a DAX for calculating and measuring columns. |
| Embedding report is the real-time challenge in Tableau. | Embedding report is simple with a Power BI. |
Advantages of Tableau
- A less cost of training.
- Very fast and simple to create visualizations.
- A good customer support.
- A data interpreter story-telling ability.
- Tableau provides a feature of visualization.
- It helps to combine a shape & clean the data for analysis.
- It helps to handle a large amount of a data.
- Allows users to create a reports, dashboards, and stories using a tableau desktop.
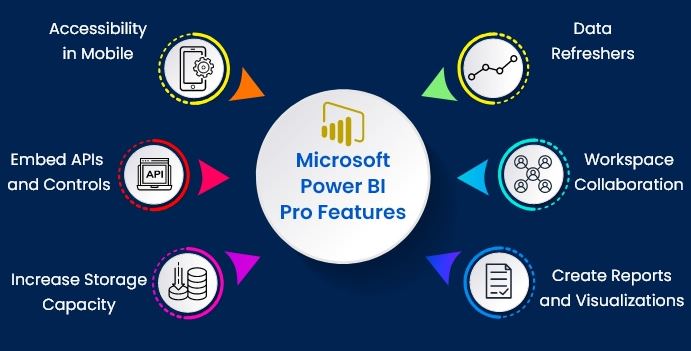
Advantages of Power BI
- Provide a pre-built dashboards and reports for a SaaS Solutions.
- Provide a real-time dashboard updates.
- Secure and reliable connection to the data sources in a cloud or on-premises.
- A data exploration using a natural language query.
- Power BI provide a quick deployment, hybrid configuration, and a secure environment.
- Feature for a dashboard visualization.
- New features are frequently added that are great for an excel users.
- An extensive database connectivity capabilities Q&A feature publish to a web.
- Integration with the both Python and R coding to use a visualizations.
- Power query provides more options related to be wrangling and clean the data.
- Post publishing a data into Power BI web service can be schedule a refresh without manual intervention.
- Power BI backed by a superpower of with an artificial intelligence and machine learning.
Disadvantages of Power BI
- Dashboards and reports only shared with the users having a same email domains.
- Power BI will be never mix imported data, which is an accessed from real-time connections.
- Power BI can’t accept a file size larger than 1 GB.
Disadvantages of Tableau
- Relatively more cost.
- No change management or a versioning.
- Importing custom visualization is a bit complex .
- Not provide easy methods for an embedding reports to other applications.
- Tableau is suitable only for large organization which can pay for a licensing cost.
- The tableau does not offer support for an artificial intelligence and machine learning.
- There is integration with the other Microsoft products like Power Apps , Dynamics 365, Office 365, and Microsoft Flow, which uses a Single Sign-On (SSO).
Features of Power BI
- A Customizable dashboards.
- Datasets.
- Reports.
- Navigation pane.
- Q&A question box.
- Help & feedback buttons.
- Ad Hoc reporting and analysis.
- Online Analytical Processing (OLAP).
- Trend indicators.
- Interactive reports authoring.
- A complete reporting & data visualization tools.
- Real-time dashboards that help to business owners solve problems as they occur.
- Offers a Power BI embedded, azure service that allows applications to interact with a Power BI.
Features of Tableau
- Data blending.
- No need of a technical knowledge.
- Real-time analysis.
- Data collaboration and data notifications.
- DAX analysis function.
- Patented technology from Stanford university.
- Toggle view and drag-and-drop.
- List of a native data connectors.
- Highlight and filter data.
- A share dashboards.
- Embed dashboards within.
- Mobile-ready dashboards.
- Tableau reader for a data viewing.
- Dashboard commenting.
- Create “no-code” data queries.
- Translate a queries to visualizations.
- Import all ranges and sizes of a data.
Conclusion
Tableau deploys a MDX for measures and dimensions, while the Power BI uses a DAX for calculating and measuring columns.