
- Probability Density Function in Statistics Tutorial | Definition, Formula & Examples
- Best Clojure Tutorial | Ultimate Guide to Learn [UPDATED]
- Introduction to RapidMiner Tutorial | Get Started with RapidMiner
- R Tutorial
- Spark SQL Tutorial
- Data Extraction in R Tutorial
- Introduction to RapidMiner Tutorial | Get Started with RapidMiner
- Data Scientist vs Data Analyst vs Data Engineer Tutorial
- Unsupervised Learning with Clustering- Machine Learning Tutorial
- Data Scientist Report 2020 Tutorial
- Tutorial on Statistics and Probability for Data Science | All you need to know [ OverView ]
- Machine Learning-K-Means Clustering Algorithm Tutorial
- Julia Tutorial
- Data Science Tutorial
Machine Learning-K-Means Clustering Algorithm Tutorial
Last updated on 26th Sep 2020, Blog, Data Science, Tutorials
What Is Clustering?
Clustering is a set of techniques used to partition data into groups, or clusters. Clusters are loosely defined as groups of data objects that are more similar to other objects in their cluster than they are to data objects in other clusters. In practice, clustering helps identify two qualities of data:
- 1.Meaningfulness
- 2.Usefulness
Meaningful clusters expand domain knowledge. For example, in the medical field, researchers applied clustering to gene expression experiments. The clustering results identified groups of patients who respond differently to medical treatments.
Useful clusters, on the other hand, serve as an intermediate step in a data pipeline. For example, businesses use clustering for customer segmentation. The clustering results segment customers into groups with similar purchase histories, which businesses can then use to create targeted advertising campaigns.
Types of ML Clustering Algorithms
The following are the most important and useful ML clustering algorithms −
K-means Clustering
This clustering algorithm computes the centroids and iterates until we find the optimal centroid. It assumes that the number of clusters are already known. It is also called a flat clustering algorithm. The number of clusters identified from data by algorithm is represented by ‘K’ in K-means.
Mean-Shift Algorithm
It is another powerful clustering algorithm used in unsupervised learning. Unlike K-means clustering, it does not make any assumptions hence it is a non-parametric algorithm.
Hierarchical Clustering
It is another unsupervised learning algorithm that is used to group together the unlabeled data points having similar characteristics.
We will be discussing all these algorithms in detail in the upcoming chapters.
How to Perform K-Means Clustering in Python
In this section, you’ll take a step-by-step tour of the conventional version of the k-means algorithm. Understanding the details of the algorithm is a fundamental step in the process of writing your k-means clustering pipeline in Python. What you learn in this section will help you decide if k-means is the right choice to solve your clustering problem.
K-Means Clustering
There are multiple ways to cluster the data but the K-Means algorithm is the most used algorithm. Which tries to improve the inter group similarity while keeping the groups as far as possible from each other.
Basically K-Means runs on distance calculations, which again uses “Euclidean Distance” for this purpose. Euclidean distance calculates the distance between two given points using the following formula:
Euclidean Distance =
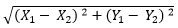
Above formula captures the distance in 2-Dimensional space but the same is applicable in multi-dimensional space as well with an increase in the number of terms getting added. “K” in K-Means represents the number of clusters in which we want our data to divide into. The basic restriction for the K-Means algorithm is that your data should be continuous in nature. It won’t work if data is categorical in nature.
Data Preparation
As discussed, K-Means and most of the other clustering techniques work on the concept of distances. They calculate distance from a specific given point and try to reduce it. The problem occurs when different variables have different units, e.g., we want to segment the population of India but weight is given in KGs but height is given in CMs. One can understand that the distance matrix discussed above is highly susceptible to the units of variables. Hence, it is advisable to standardize your data before moving towards clustering exercise.
Subscribe For Free Demo
Error: Contact form not found.
Algorithm
K-Means is an iterative process of clustering; which keeps iterating until it reaches the best solution or clusters in our problem space. Following pseudo example talks about the basic steps in K-Means clustering which is generally used to cluster our data
- 1.Start with the number of clusters we want e.g., 3 in this case. K-Means algorithm start the process with random centers in data, and then tries to attach the nearest points to these centers
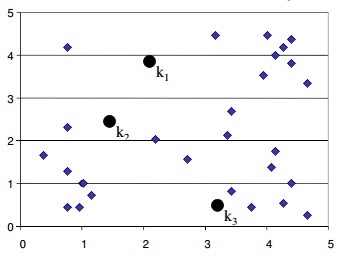
- 1.Algorithm then moves the randomly allocated centers to the means of created groups
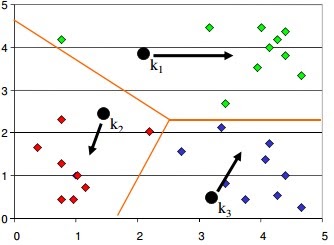
- 2. In the next step, data points are again reassigned to these newly created centers
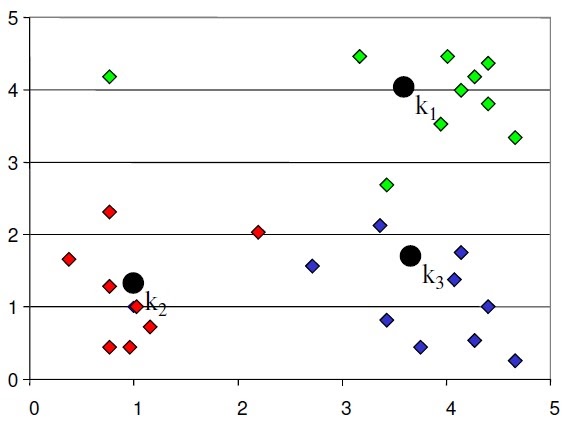
- 3.Steps 2 & 3 are repeated until no member changes their association/ groups
Understanding the K-Means Algorithm
Conventional k-means requires only a few steps. The first step is to randomly select k centroids, where k is equal to the number of clusters you choose. Centroids are data points representing the center of a cluster.
The main element of the algorithm works by a two-step process called expectation-maximization. The expectation step assigns each data point to its nearest centroid. Then, the maximization step computes the mean of all the points for each cluster and sets the new centroid. Here’s what the conventional version of the k-means algorithm looks like:
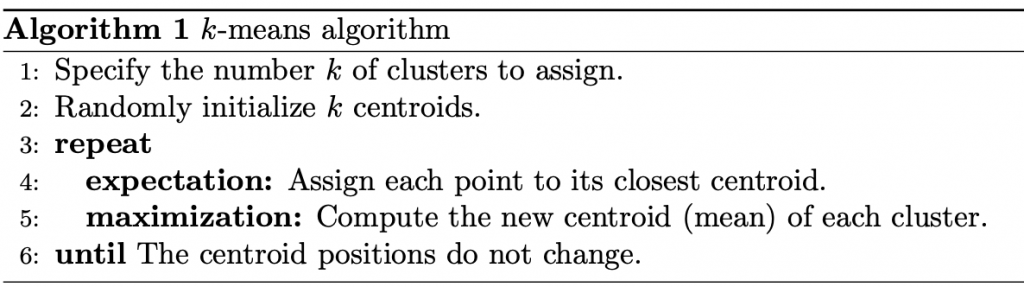
The quality of the cluster assignments is determined by computing the sum of the squared error (SSE) after the centroids converge, or match the previous iteration’s assignment. The SSE is defined as the sum of the squared Euclidean distances of each point to its closest centroid. Since this is a measure of error, the objective of k-means is to try to minimize this value.
The figure below shows the centroids and SSE updating through the first five iterations from two different runs of the k-means algorithm on the same dataset:
The purpose of this figure is to show that the initialization of the centroids is an important step. It also highlights the use of SSE as a measure of clustering performance. After choosing a number of clusters and the initial centroids, the expectation-maximization step is repeated until the centroid positions reach convergence and are unchanged.
The random initialization step causes the k-means algorithm to be nondeterministic, meaning that cluster assignments will vary if you run the same algorithm twice on the same dataset. Researchers commonly run several initializations of the entire k-means algorithm and choose the cluster assignments from the initialization with the lowest SSE.
Understanding K-means Clustering in Machine Learning
K-means clustering is one of the simplest and popular unsupervised machine learning algorithms.
Typically, unsupervised algorithms make inferences from datasets using only input vectors without referring to known, or labelled, outcomes.
AndreyBu, who has more than 5 years of machine learning experience and currently teaches people his skills, says that “the objective of K-means is simple: group similar data points together and discover underlying patterns. To achieve this objective, K-means looks for a fixed number (k) of clusters in a dataset.”
A cluster refers to a collection of data points aggregated together because of certain similarities.
You’ll define a target number k, which refers to the number of centroids you need in the dataset. A centroid is the imaginary or real location representing the center of the cluster.
Every data point is allocated to each of the clusters through reducing the in-cluster sum of squares.
In other words, the K-means algorithm identifies the k number of centroids, and then allocates every data point to the nearest cluster, while keeping the centroids as small as possible.
The ‘means’ in the K-means refers to averaging of the data; that is, finding the centroid.
How the K-means algorithm works
To process the learning data, the K-means algorithm in data mining starts with a first group of randomly selected centroids, which are used as the beginning points for every cluster, and then performs iterative (repetitive) calculations to optimize the positions of the centroids
It halts creating and optimizing clusters when either:
- The centroids have stabilized — there is no change in their values because the clustering has been successful.
- The defined number of iterations has been achieved.
K-means algorithm example problem
Let’s see the steps on how the K-means machine learning algorithm works using the Python programming language.
We’ll use the Scikit-learn library and some random data to illustrate a K-means clustering simple explanation.
Step 1: Import libraries
- import pandas as pd
- import numpy as np
- import matplotlib.pyplot as plt
- from sklearn.cluster import KMeans
- %matplotlib inline
As you can see from the above code, we’ll import the following libraries in our project:
- Pandas for reading and writing spreadsheets
- Numpy for carrying out efficient computations
- Matplotlib for visualization of data
Step 2: Generate random data
Here is the code for generating some random data in a two-dimensional space:
- X= -2 * np.random.rand(100,2)
- X1 = 1 + 2 * np.random.rand(50,2)
- X[50:100, :] = X1
- plt.scatter(X[ : , 0], X[ :, 1], s = 50, c = ‘b’)
- plt.show()
A total of 100 data points has been generated and divided into two groups, of 50 points each.
Here is how the data is displayed on a two-dimensional space:

Step 3: Use Scikit-Learn
We’ll use some of the available functions in the Scikit-learn library to process the randomly generated data.
Here is the code:
- from sklearn.cluster import KMeans
- Kmean = KMeans(n_clusters=2)
- Kmean.fit(X)
In this case, we arbitrarily gave k (n_clusters) an arbitrary value of two.
Here is the output of the K-means parameters we get if we run the code:
- KMeans(algorithm=’auto’, copy_x=True, init=’k-means++’, max_iter=300
- n_clusters=2, n_init=10, n_jobs=1, precompute_distances=’auto’,
- random_state=None, tol=0.0001, verbose=0)
Step 4: Finding the centroid
Here is the code for finding the center of the clusters:
- Kmean.cluster_centers_
Here is the result of the value of the centroids:
- array([[-0.94665068, -0.97138368],
- [ 2.01559419, 2.02597093]])
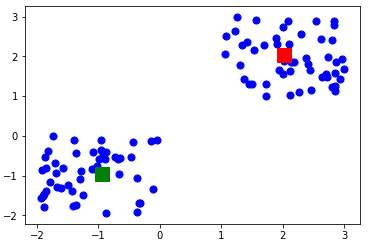
Let’s display the cluster centroids (using green and red color).
- plt.scatter(X[ : , 0], X[ : , 1], s =50, c=’b’)
- plt.scatter(-0.94665068, -0.97138368, s=200, c=’g’, marker=’s’)
- plt.scatter(2.01559419, 2.02597093, s=200, c=’r’, marker=’s’)
- plt.show()
Here is the output:

Step 5: Testing the algorithm
Here is the code for getting the labels property of the K-means clustering example dataset; that is, how the data points are categorized into the two clusters.
Kmean.labels_
Here is the result of running the above K-means algorithm code:
- array([0, 0, 0, 0, 0, 0, 0, 0, 0, 0, 0, 0, 0, 0, 0, 0, 0, 0, 0, 0, 0, 0,
- 0, 0, 0, 0, 0, 0, 0, 0, 0, 0, 0, 0, 0, 0, 0, 0, 0, 0, 0, 0, 0, 0,
- 0, 0, 0, 0, 0, 0, 1, 1, 1, 1, 1, 1, 1, 1, 1, 1, 1, 1, 1, 1, 1, 1,
- 1, 1, 1, 1, 1, 1, 1, 1, 1, 1, 1, 1, 1, 1, 1, 1, 1, 1, 1, 1, 1, 1,
- 1, 1, 1, 1, 1, 1, 1, 1, 1, 1, 1, 1])
As you can see above, 50 data points belong to the 0 cluster while the rest belong to the 1 cluster.
For example, let’s use the code below for predicting the cluster of a data point:
- sample_test=np.array([-3.0,-3.0])
- second_test=sample_test.reshape(1, -1)
- Kmean.predict(second_test)
Here is the result:
- array([0])
It shows that the test data point belongs to the 0 (green centroid) cluster.
Wrapping up
Here is the entire K-means clustering algorithm code in Python:
- import pandas as pd
- import numpy as np
- import matplotlib.pyplot as plt
- from sklearn.cluster import KMeans
- %matplotlib inline
- X= -2 * np.random.rand(100,2)
- X1 = 1 + 2 * np.random.rand(50,2)
- X[50:100, :] = X1
- plt.scatter(X[ : , 0], X[ :, 1], s = 50, c = ‘b’)
- plt.show()
- from sklearn.cluster import KMeans
- Kmean = KMeans(n_clusters=2)
- Kmean.fit(X)
- Kmean.cluster_centers_
- plt.scatter(X[ : , 0], X[ : , 1], s =50, c=’b’)
- plt.scatter(-0.94665068, -0.97138368, s=200, c=’g’, marker=’s’)
- plt.scatter(2.01559419, 2.02597093, s=200, c=’r’, marker=’s’)
- plt.show()
- Kmean.labels_
- sample_test=np.array([-3.0,-3.0])
- second_test=sample_test.reshape(1, -1)
- Kmean.predict(second_test)
Advantages and Disadvantages
Advantages
The following are some advantages of K-Means clustering algorithms −
- It is very easy to understand and implement.
- If we have a large number of variables then, K-means would be faster than Hierarchical clustering.
- On re-computation of centroids, an instance can change the cluster.
- Tighter clusters are formed with K-means as compared to Hierarchical clustering.
Disadvantages
The following are some disadvantages of K-Means clustering algorithms −
- It is a bit difficult to predict the number of clusters i.e. the value of k.
- Output is strongly impacted by initial inputs like number of clusters (value of k).
- Order of data will have a strong impact on the final output.
- It is very sensitive to rescaling. If we will rescale our data by means of normalization or standardization, then the output will completely change.final output.
- It is not good to do clustering jobs if the clusters have a complicated geometric shape.
Applications of K-Means Clustering Algorithm
The main goals of cluster analysis are −
- To get a meaningful intuition from the data we are working with.
- Cluster-then-predict where different models will be built for different subgroups.
To fulfill the above-mentioned goals, K-means clustering is performing well enough. It can be used in following applications −
- Market segmentation
- Document Clustering
- Image segmentation
- Image compression
- Customer segmentation Analyzing the trend on dynamic data
Conclusion
K-means clustering is an extensively used technique for data cluster analysis.
It is easy to understand, especially if you accelerate your learning using a K-means clustering tutorial. Furthermore, it delivers training results quickly.
However, its performance is usually not as competitive as those of the other sophisticated clustering techniques because slight variations in the data could lead to high variance.
Furthermore, clusters are assumed to be spherical and evenly sized, something which may reduce the accuracy of the K-means clustering Python results.