
- Probability Density Function in Statistics Tutorial | Definition, Formula & Examples
- Best Clojure Tutorial | Ultimate Guide to Learn [UPDATED]
- Introduction to RapidMiner Tutorial | Get Started with RapidMiner
- R Tutorial
- Spark SQL Tutorial
- Data Extraction in R Tutorial
- Introduction to RapidMiner Tutorial | Get Started with RapidMiner
- Data Scientist vs Data Analyst vs Data Engineer Tutorial
- Unsupervised Learning with Clustering- Machine Learning Tutorial
- Data Scientist Report 2020 Tutorial
- Tutorial on Statistics and Probability for Data Science | All you need to know [ OverView ]
- Machine Learning-K-Means Clustering Algorithm Tutorial
- Julia Tutorial
- Data Science Tutorial
Unsupervised Learning with Clustering- Machine Learning Tutorial
Last updated on 29th Sep 2020, Blog, Data Science, Tutorials
This is ‘Unsupervised Learning with Clustering’ tutorial which is a part of the Machine Learning course offered by Simplilearn. We will learn machine learning clustering algorithms and K-means clustering algorithms majorly in this tutorial.
Objectives
Let us look at the objectives covered in this Clustering Tutorial.
- Discuss machine learning clustering algorithms
- Explain the k-means clustering algorithm with examples
Recall: Clustering
Cluster analysis or clustering is the most commonly used technique of unsupervised learning. It is used to find data clusters such that each cluster has the most closely matched data.
Subscribe For Free Demo
Error: Contact form not found.
Clustering Algorithms
The types of Clustering Algorithms are:
- Prototype-based Clustering
- Hierarchical Clustering
- Density-based Clustering (DBSCAN)
Prototype-based Clustering
Prototype-based clustering assumes that most data is located near prototypes; example: centroids (average) or medoid (most frequently occurring point) K-means, a Prototype-based method, is the most popular method for clustering that involves:
- Training data that gets assigned to matching cluster based on similarity
- The iterative process to get data points in the best clusters possible
What is K-means Clustering ?
K-means clustering is an unsupervised learning algorithm. In this case, you don’t have labeled data unlike in supervised learning. You have a set of data that you want to group into and you want to put them into clusters, which means objects that are similar in nature and similar in characteristics need to be put together. This is what k-means clustering is all about. The term K basically is a number and you need to tell the system how many clusters you need to perform. If K is equal to 2, there will be 2 clusters if K is equal to 3, 3 clusters and so on and so forth. That’s what the K stands for and of course, there is a way of finding out what is the best or optimum value of K.
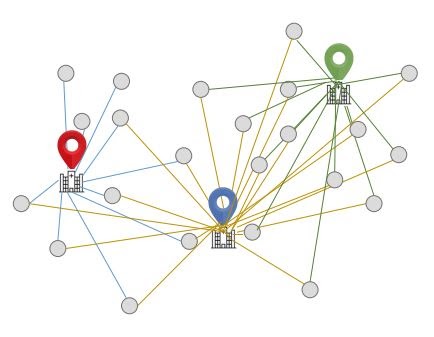
Step 1: Randomly Pick K Centroids
Start by picking k centroids. Assume, k = 3
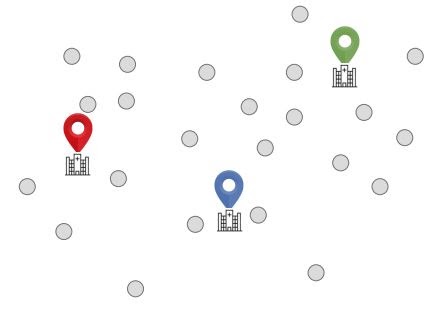
Finding the number of clusters: Use Elbow Method (to be reviewed later)
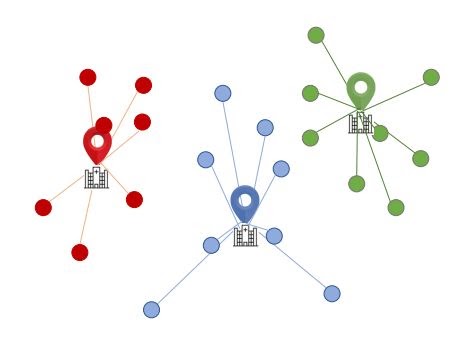
Step 2: Assign Each Point To The Nearest Centroid Μ(J), J ∈ {1,…, K}.
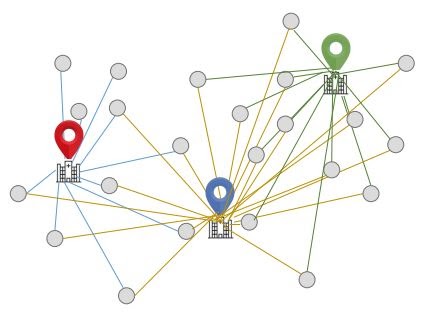
The points are assigned such that the Euclidean distance of each point from the respective centroid is minimized
Step 3: Move Each Centroid To The Centre Of The Respective Cluster
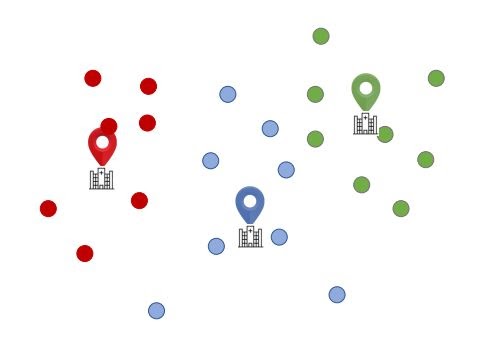
Step 4: Calculate Distance Of The Centroids From Each Point Again
Calculate the Euclidean distance between each point and its centroid.
Step 5: Move Points Across Clusters And Re-calculate The Distance From The Centroid
Step 6: Keep Moving The Points Across Clusters Until The Euclidean Distance Is Minimized
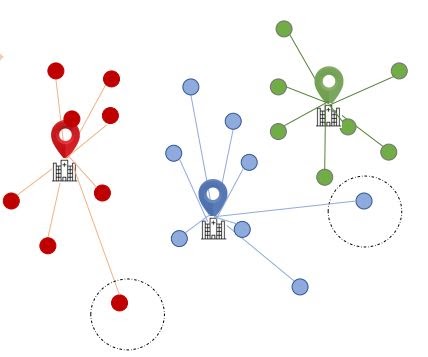
Repeat the steps until the within-cluster Euclidean distance is minimized for each cluster (or a user-defined limit on the number of iterations is reached)
Giving it a Mathematical Angle
The analysis was based on a lot of calculations. Now let’s understand the mathematical aspect.
- A key challenge in Clustering is that you have to pre-set the number of clusters. This influences the quality of clustering.
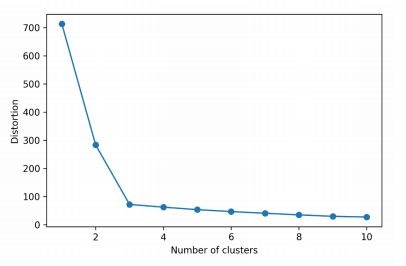
- Unlike Supervised Learning, here one does not have ground truth labels. Hence, to check the quality of clustering, one has to use intrinsic methods, such as the within-cluster SSE, also called Distortion.
- In the scikit-learn ML library, this value is available via the inertia_ attribute after fitting a K-means model.
- One could plot the Distortion against the number of clusters k. Intuitively, if k increases, distortion should decrease. This is because the samples will be close to their assigned centroids.
- This plot is called the Elbow method. It indicates the optimum number of clusters at the position of the elbow, the point where distortion begins to increase most rapidly
- The adjoining Elbow method suggests that k = 3 is the most optimum number of clusters.
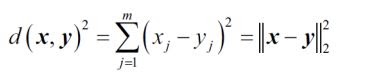
- K-means is based on finding points close to cluster centroids. The distance between two points x and y can be measured by the squared Euclidean distance between them in an m-dimensional space.
- Here, j refers to j-th dimension (or j-th feature) of the data point.
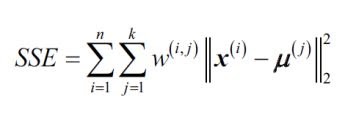
- Based on this, the optimization problem is to minimize the within-cluster sum of squared errors (SSE), which is sometimes also called the cluster inertia.
- Here, j refers to the j-th cluster. μ (j) is the centroid of that cluster.
- w(i,j) = 1 if the sample x (i) is in cluster j, and 0 otherwise.
Mathematical Representation(Contd.)
Scikit-learn cluster module has the K-means function. In the code shown,
- k = 3
- n_init = 10: which means that you run the clustering logic 10 times, each time with random cluster centroids. Finally, the model with the lowest SSE among the 10 schemes gets chosen.
- max_iter = 300: which means within each of the 10 runs, iterate 300 times to find ideal clusters.
- If convergence happens before 300 iterations, it will stop early.
- A large max_iter is computationally intensive (if convergence does not happen early).
- tol is another parameter which governs tolerance with regard to changes in the within-cluster SSE to declare convergence. A larger tol means it will declare convergence sooner.
Other K-means Clustering Examples
Some of the examples related to K-means Clustering.
- Grouping articles (example: Google news)
- Grouping customers who share similar interests, for example: analyzing customers who like contemporary fashion vs. those who prefer traditional clothing
- Classifying high risk and low-risk patients from a patient pool
- Segregating criminals from the normal crowd in a security control process
Key Takeaways
Let us quickly go through what you have learned so far in this tutorial.
- The most common form of Unsupervised Learning is Clustering, which involves segregating data based on the similarity between data instances.
- K-means is a popular technique for Clustering. It involves an iterative process to find cluster centers called centroids and assigning data points to one of the centroids.
- K-means finds clusters by minimizing the within-cluster distance of data points from respective centroids.
- The Elbow method is used to determine the most optimum number of clusters.

Enhance Your Career with Machine Learning Training By Experts Trainers
- Instructor-led Sessions
- Real-life Case Studies
- Assignments
Gaussian Mixture Models (GMM)
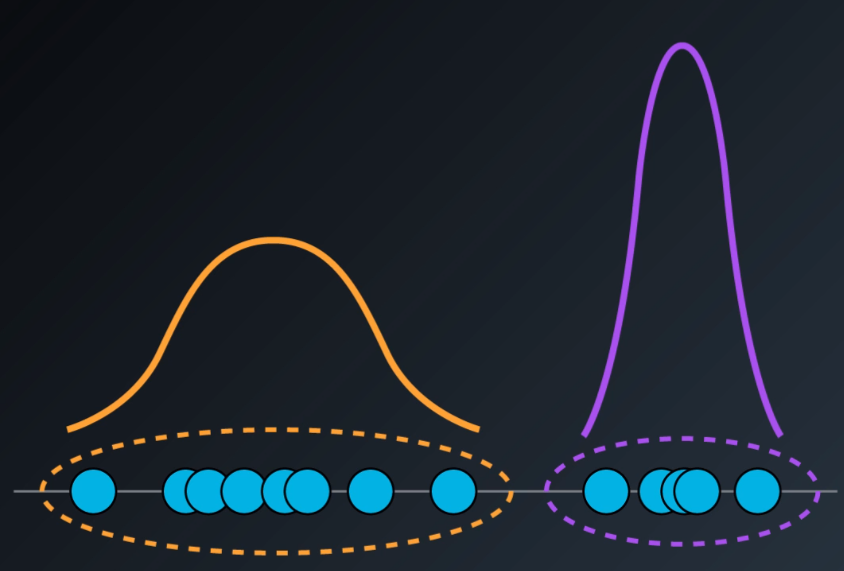
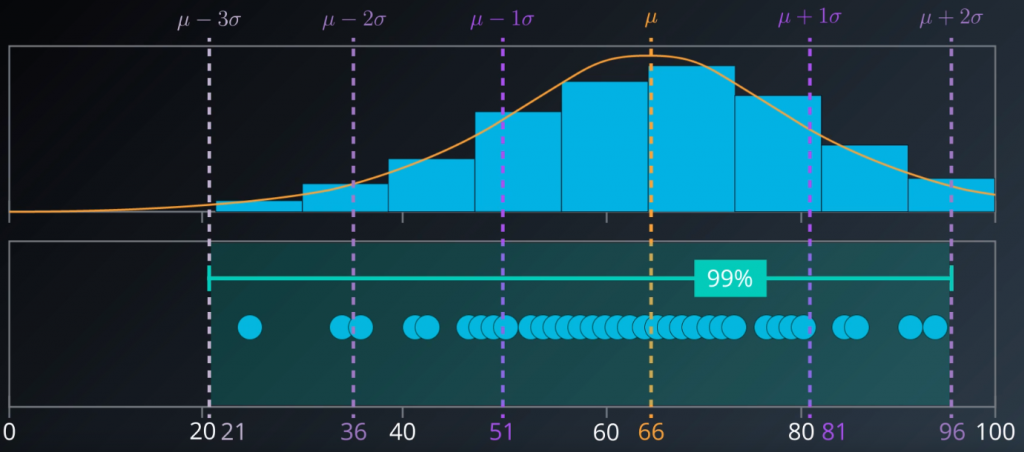
Gaussian Mixture Models are probabilistic models that assume that all samples are generated from a mix of a finitite number of Gaussian distributions with unknown parameters.
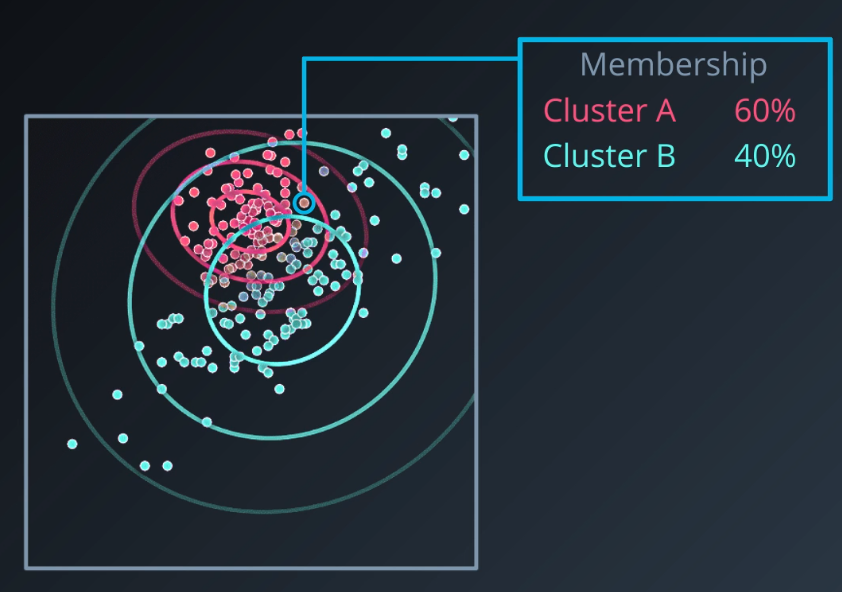
It belongs to the group of soft clustering algorithms in which every data point will belong to every cluster existing in the dataset, but with different levels of membership to each cluster. This membership is assigned as the probability of belonging to a certain cluster, ranging from 0 to 1.
For example, the highlighted point will belong to clusters A and B simultaneoulsy, but with higher membership to the group A, due to its closeness to it.
GMM is one of the most advanced clustering methods that we will study in this series, it assumes that each cluster follows a probabilistic distribution that can be Gaussian or Normal. It is a generalization of K-Means clustering that includes information about the covariance structure of the data as well as the centers of the latent Gaussians.
GMM Algorithm
It is an expectation-maximization algorithm which process could be summarize as follows:
- 1.Initialize K Gaussian distributions. It does this with the µ (mean) and σ (standard deviation) values. They can be taken from the dataset (naive method) or by applying K-Means.
- 2.Soft cluster the data: this is the ‘Expectation’ phase in which all datapoints will be assigned to every cluster with their respective level of membership.
- 3.Re-estimate the gaussians: this is the ‘Maximization’ phase in which the expectations are checked and they are used to calculate new parameters for the gaussians: new µ and σ.
- 4.Evaluate the log-likelihood of the data to check for convergence. The higher the log-likehood is, the more probable is that the mixture of the model we created is likely to fit our dataset. So, this is the function to maximize.
- 5.Repeat from step 2 until convergence.
GMM Advantages
- It is a soft-clustering method, which assigns sample membersips to multiple clusters. This characteristic makes it the fastest algorithm to learn mixture models
- There is high flexibility in the number and shape of the clusters.
GMM Disadvantages
- It is very sensitive to the initial values which will condition greatly its performance.
- GMM may converge to a local minimum, which would be a sub-optimal solution.
- When having insufficient points per mixture, the algorithm diverges and finds solutions with infinite likelihood unless we regularize the covariances between the data points artificially.
Clustering Validation
Clustering validation is the process of evaluating the result of a cluster objectively and quantitatively. We will do this validation by applying cluster validation indices. There are three main categories:
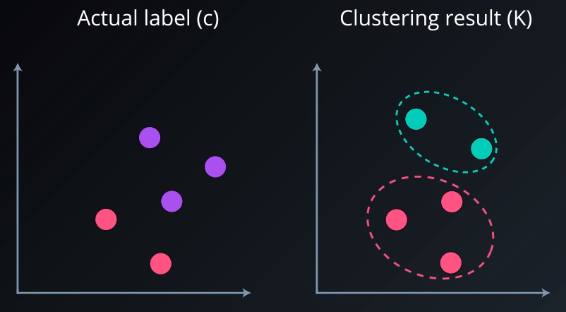
The most used index is the Adjusted Rand index.
- Adjusted Rand Index (ARI) € [-1,1]
To understand it we should first define its components:
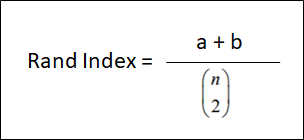
- a: is the number of points that are in the same cluster both in C and in K
- b: is the number of points that are in the different cluster both in C and in K.
- n = is the total number of samples
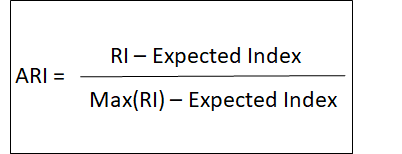
The ARI can get values ranging from -1 to 1. The higher the value, the better it matches the original data.
Internal Validation Indices
In unsupervised learning, we will work with unlabeled data and this is when internal indices are more useful.
One of the most common indices is the Silhouette Coefficient.
- Silhouette Coefficient:
There is a Silhouette Coefficient for each data point.
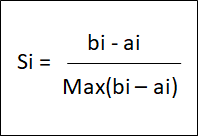
- a = average distance to other sample i in the same cluster
- b = average distance to other sample i in closest neighbouring cluster
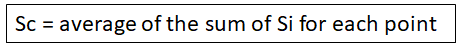
The Silhouette Coefficient (SC) can get values from -1 to 1. The higher the value, the better the K selected is. It penalized more if we surpass the ideal K than if we fall short.
It is only suitable for certain algorithms such as K-Means and hierarchical clustering. It is not suitable to work with DBSCAN, we will use DBCV instead.
Conclusion
We have made a first introduction to unsupervised learning and the main clustering algorithms.
In the next article we will walk through an implementation that will serve as an example to build a K-means model and will review and put in practice the concepts explained.