
- What is Lean?| Everything You Need to Know
- What is SAP Workflow? : A Complete Guide
- Difference between Tableau and Power BI | Benefits and Special Features
- Data Warehouse in Tableau | Everything You Need to Know
- What is Tableau Server?| Everything You Need to Know | A Definitive Guide
- What is Dax in Power BI? | A Comprehensive Guide
- Upgrade in Tableau Desktop and Web Authoring | A Complete Guide with Best Practices
- What is SAP HANA | SAP HANA Database Connection | All you need to know [ OverView ]
- SAP BPC – What is Business Planning and Consolidation? : All you need to know [ OverView ]
- Root Cause Analysis: Definition, Examples & Methods | All you need to know [ OverView ]
- Seven Basic Quality Improvement Ishikawa Tools | Important asset to control quality in your project [OverView]
- What is Power BI | Its Use Cases and Applications | All you need to know [ OverView ]
- How and why to measure and analyze employee productivity | Everything You Need to Know
- Top 10 Employee Retention Strategies | Everything You Need to Know
- What are LookML Projects and the Developer Mode | How to Create LookML Projects?
- What are Slowly Changing Dimension | SCD Types and Implementations | Step-By-Step Process
- What is Pareto Chart and How to Create Pareto Chart | A Complete Guide For Beginners
- What does an Agile Business Analyst do | Required Skills, Roles and Responsibilities [ Job & Future ]
- What is Lean Management? | Role and Concepts of Lean Management | Expert’s Top Picks
- A Definitive Guide of Working Capital Management with Best Practices & REAL-TIME Examples
- Business Analytics with Excel Fundamentals | A Complete Guide For Beginners
- Business Analyst : Job Description | All you need to know [ Job & Future ]
- How to create a Splunk Dashboard | A Complete Guide For Beginners [ OverView ]
- What is Splunk Logging ? | The Ultimate Guide with Expert’s Top Picks
- Alteryx vs Tableau | Know Their Differences and Which Should You Learn?
- What is Predictive Analytics? : Step-By-Step Process with REAL-TIME Examples
- An Overview of SAS Stored Processes | The Ultimate Guide with Expert’s Top Picks
- How to Create Conditional Formatting in Cognos Report Studio | A Complete Guide
- Difference between OLTP vs OLAP | Know Their Differences and Which Should You Learn?
- ECBA vs CCBA vs CBAP | A Complete Guide For Beginners | Know Their Differences and Which Should You Learn?
- Import Custom Geocode Data in Tableau | Everything You Need to Know [ OverView ]
- Data Warehouse Tools : Features , Concepts and Architecture
- PGDM vs MBA | Know Their Differences and Which Should You Learn?
- Most Popular Data Visualization Tools | A Complete Beginners Guide | REAL-TIME Examples
- Tableau vs Looker : Comparision and Differences | Which Should You Learn?
- Benefits of Employee Satisfaction for the Organization [ Explained ]
- DAX In Power BI – Learn Power BI DAX Basics [ For Freshers and Experience ]
- Power Bi vs Tableau : Comparision and Differences | Which Should You Learn?
- What is Alteryx Tools | Alteryx ETL Tools | Comprehensive Guide
- What is Tableau Prep? : Comprehensive Guide | Free Guide Tutorial & REAL-TIME Examples
- What are Business Intelligence Tools ? : All you need to know [ OverView ]
- Tableau Aggregate Functions | A Complete Guide with REAL-TIME Examples
- Intervalmatch Function in Qlikview | Everything You Need to Know [ OverView ]
- QlikView Circular Reference | Free Guide Tutorial & REAL-TIME Examples
- Data Blending in Tableau | A Complete Guide with Best Practices | Free Guide Tutorial [ OverView ]
- Splunk vs ELK | Differences and Which Should You Learn? [ OverView ]
- QlikSense vs QlikView | Differences and What to learn and Why?
- What Is Measurement System Analysis | Required Skills | Everything You Need to Know
- Splunk Timechart | Free Guide Tutorial & REAL-TIME Examples
- What Is Image Processing ? A Complete Guide with Best Practices
- What is a Business Analysis ? A Complete Guide with Best Practices
- Top Business Analytics Tools | Comprehensive Guide
- Business Analyst Career Path [ Job & Future ]
- Time Series Analysis Tactics | A Complete Guide with Best Practices
- What is Splunk ? Free Guide Tutorial & REAL-TIME Examples
- Which Certification is Right for You: Six Sigma or Lean Six Sigma?
- SAS Vs R
- Top Technology Trends for 2020
- Data Analyst vs. Data Scientist
- What are the Essential Skills That You Need to Master in Data Analyst?
- What is Six Sigma?
- Common Cause Variation Vs Special Cause Variation
- Reasons to Get a Six Sigma Certification
- What Is Strategic Enterprise Management and its Components?
- What Are The Benefits Measurement Constrained Optimization Methods?
- What Is the Benefit of Modern Data Warehousing?
- What Is Corporate Social Responsibility (CSR)?
- What Is The Purpose and Importance Of Financial Analysis?
- What is Insights-as-a-Service (IaaS)?
- Business Analytics With R Programming Languages
- Where Are The 8 Hidden Wastes?
- What Are Market Structures?
- What is Cost of Quality (COQ)?
- What is Build Verification Testing?
- Quality Improvement in Six Sigma
- What is Process Capability Analysis?
- How To Measure The Effectiveness Of Corporate Training
- SAP Financials And SAP Accounting Modules
- Tips to Learn Tableau
- Why Should I Become a CBAP?
- History And Evolution of Six Sigma
- How to use Control Chart Constants?
- Data Analytics Course For Beginners
- How to Build a Successful Data Analyst Career?
- Data Analytics Vs Business Analytics
- What is SAP Certification?
- Books To Read For a Six Sigma Certification
- Six Sigma Green Belt Salary
- What is the ASAP Methodology?
- Complete list of SAP modules
What are Slowly Changing Dimension | SCD Types and Implementations | Step-By-Step Process
Last updated on 04th Nov 2022, Artciles, Blog, Business Analytics
- In this article you will learn:
- 1.Introduction.
- 2.Slowly changing dimension.
- 3.Types of Slowly changing dimension.
- 4.Conclusion.
Introduction:
A Slowly Changing Dimension (SCD) is the dimension that stores and manages the both current and historical data over time in data warehouse.
Slowly changing dimension:
- In a data management and data warehousing, a slowly changing dimension (SCD) is the dimension that consists of relatively static data that can change slowly but unexpectedly, rather than on regular schedule. Some examples of a specific slowly changing dimensions are entities in the form of the names of a geographic locations, customers or products.
- For example the database may contain fact table that are stores sales records. This fact table will be linked to dimensions by a foreign keys. One of these dimensions can contain a data about a company’s salespeople: for example regional offices they work in.
- However a salespeople are sometimes transferred from the one regional office to another. A Historical sales reporting purposes may need keeping records of the fact that a particular sales person was assigned to the particular regional office at earlier date, whereas that sales person is now assigned to a various regional office.
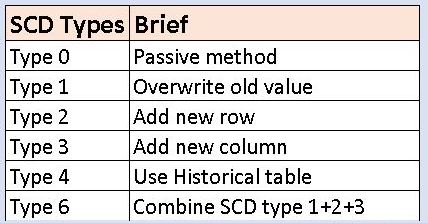
- Tackling these problems are includes SCD management practises referred to as a Types 0 to 6. Type 6 SCDs are sometimes called a hybrid SCDs.
Types of Slowly changing dimension:
Type 0: retain original
Type 0 dimension attributes are never change and are assigned to attributes that have durable values or are explained as ‘native’.Example: date of birth, original credit score.
Type 1: overwrite
This method overwrites an old data with a new data, and therefore does not track a historical data.Example of a supplier table:
- supplier_key supplier_code supplier_name supplier_state
- 123 ABC Acme Supply Company Ca
- In above example, supplier_code is a natural key and supplier_key is surrogate key. Technically, surrogate key is not necessary, as the row will be unique by a natural key (supplier_code).
- If supplier moves a headquarters to Illinois, the record will be an overwritten by:
- supplier_key supplier_code supplier_name supplier_state
- 123 ABC Acme Supply Company IL
- The disadvantage of a Type 1 method is that there is no history in a data warehouse. However it has advantage that it is simple to maintain.
- If one has computed an aggregate table summarizing facts by a supplier state, it will need to be a recalculated when supplier_state changes.
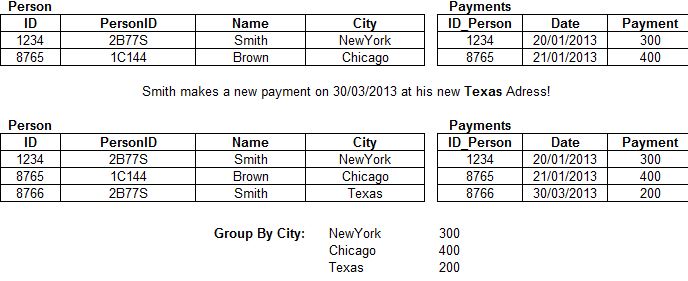
Type 2: add new row
This method tracks a historical data by creating the multiple records for a given natural key in a dimensional tables with various surrogate keys and/or different version numbers. Unlimited history is a preserved for each insert.For example, if a supplier moves to Illinois, version number will be an incremented sequentially: supplier_key supplier_code supplier_name supplier_state version
- 123 ABC Acme Supply Company Ca 0
- 124 ABC ACME SUPPLY COMPANY IL 1
- The Another way is to add an Effective Date column.
- supplier_key supplier_code supplier_name supplier_state start_date end_date.
- The start date/time of a second row is equal to the end date/time of previous row. The null End_Date in line two indicates a current tuple version. Instead of a standardized surrogate higher date (such as 9999-12-31) can be used as a end date, so that the field can be included in index, and so that zero-value replacement is not be required when querying Ho.
- And third method uses an effective date and also current flag.
- Supplier_key supplier_code supplier_name supplier_state effective_date current_flag.
- The Current_Flag value of ‘Y’ indicates a current tuple version.
- Transactions that refer to the particular surrogate key (supplier_key) are then permanently bound to time slice defined by that row of the slowly changing dimension table. A composite table summarizing facts by the supplier state showing a historical position that is the state the supplier was in at a time of the transaction No update is be required. In order to refer to an entity via the natural key, it is important to overcome unique constraint that makes it impossible by aDBMS.
- If changes are made retroactively to content of a dimension, or if new attributes are added to dimension (for example the Sales_Rep column) that have various effective dates than those already explained , this may result in the need for an existing transactions Updated to reflect a new status. This can be an expensive database operation, so Type 2 SCD is not good choice if a dimensional model is subject to frequent changes.
Type 3: add new attribute
Type 3 preserves the limited amount of history because it is limited to a number of columns specified for a storing historical data. Type 1 and Type 2 have same basic table structure but Type 3 adds additional columns. In following example, an additional column has been added to a table to record the original position of supplier – only a past history is stored.
Type 4: add history table
The Type 4 method is usually referred to be using a “history tables” where one table holds a current data, and an additional table is used to maintain a record of some or all of changes. Both the surrogate keys are referenced in a fact table to increase query performance.
Type 5 : Technology build
- The Type 5 technology builds on a Type 4 mini-dimension by an embedding a “current profile” mini-dimension key in a base dimension which is overwritten as Type 1 attribute. This approach is called a type 5 because 4 + 1 equals 5. Type 5 slowly changing the dimensions allows currently assigned a mini-dimension attribute values to be accessed with the others of base dimension without being linked by a fact table.
- Logically usually represent a base dimension and the current mini-dimension profile outrigger as a table in a presentation layer.
- The outrigger attribute must have distinct column names, like “current income level”, to distinguish them from the attributes of a mini-dimensions associated with fact table.
- Whenever a current mini-dimension changes over time,an ETL team must update/overwrite a Type 1 mini-dimension reference.
- If outrigger approach does not offer a satisfactory query performance, mini-dimension attributes can be physically embedded (and updated) in a base dimension.
Type 6: Combined approach
- The type 6 method combines a methods of types 1, 2 and 3 (1 + 2 + 3 = 6). One possible explanation for an origin of the term was that it was coined by a Ralph Kimball during a conversation with the Stephen Pace of Kaleido [citation needed]. Ralph Kimball in a Data Warehouse Toolkit calls this method “unexpected changes with a single-version overlays”.
- The supplier table begins with the record for an example supplier: supplier_key row_key supplier_code supplier_name current_state historical_state start_date end date current_flag 123 1 ABC Acme Supply Company CA CA 2000-01-01T00:00:00 9999-12-31T23:59:59 Y Current_state and historical_state are be same. The optional Current_Flag attribute indicates the whether this is a current or latest record for this supplier.
- When Acme Supply Company moves to the Illinois, we add a new record, as in Type 2 processing, although row key is included to ensure we have a unique key for every row: supplier_key row_key supplier_code supplier_name current_state historical_state start_date end date current_flag
- 123 1 ABC Acme Supply Company IL CA 2000-01-01T00:00:00 2004-12-22T00:00:00 N
- 123 2 ABC ACME SUPPLY COMPANY IL IL 2004-12-22T00:00:00 9999-12-31T23:59:59 Y
Overwrite a Current_State information in a first record (Row_Key = 1) with a new information, as in type 1 processing. create a new record to track changes, as in a type 2 processing. And can store the history in the another state column (Historical_State), which contains a type 3 processing.For example, if a supplier were to be moved again, would add another record to supplier dimension, and would overwrite contents of the Current_State column.
Type 7: Hybrid[4]
- An alternative implementation is to place the both surrogate key and natural key in a fact tableThis allows the user to select an appropriate dimension record based on.
- The primary effective date on a fact record (above), most recent or a current information, Any other date attached to a record of fact.
- This method allows for much flexible link to dimension, even if one used Type 2 approach rather than Type 6.
Conclusion:
To understand an importance of SCDs, it is best to look at example. A company that sells a cell phones divides devices into three categories: high, medium and basic. In this area, technology develops a rapidly, so that high-end (for example) terminals may be considered a mid-range with an advent of a new equipment a few months later.The company’s ERP transactional system stores an information in the standardised database. On one hand, have the “Sales” table, where each transaction is be recorded. Another “Products” table contains a technical information for mobile, which includes field indicating the range.The marketing department, while loading a data into data warehouse, needs to know how many cell phones are sold every year in each category. What happens when cell phone changes range? By modifying this data in a Products table, all the past sales are also changed to the new category, falsifying the information and making it impossible to know this data for a sure.