
- What is Lean?| Everything You Need to Know
- What is SAP Workflow? : A Complete Guide
- Difference between Tableau and Power BI | Benefits and Special Features
- Data Warehouse in Tableau | Everything You Need to Know
- What is Tableau Server?| Everything You Need to Know | A Definitive Guide
- What is Dax in Power BI? | A Comprehensive Guide
- Upgrade in Tableau Desktop and Web Authoring | A Complete Guide with Best Practices
- What is SAP HANA | SAP HANA Database Connection | All you need to know [ OverView ]
- SAP BPC – What is Business Planning and Consolidation? : All you need to know [ OverView ]
- Root Cause Analysis: Definition, Examples & Methods | All you need to know [ OverView ]
- Seven Basic Quality Improvement Ishikawa Tools | Important asset to control quality in your project [OverView]
- What is Power BI | Its Use Cases and Applications | All you need to know [ OverView ]
- How and why to measure and analyze employee productivity | Everything You Need to Know
- Top 10 Employee Retention Strategies | Everything You Need to Know
- What are LookML Projects and the Developer Mode | How to Create LookML Projects?
- What are Slowly Changing Dimension | SCD Types and Implementations | Step-By-Step Process
- What is Pareto Chart and How to Create Pareto Chart | A Complete Guide For Beginners
- What does an Agile Business Analyst do | Required Skills, Roles and Responsibilities [ Job & Future ]
- What is Lean Management? | Role and Concepts of Lean Management | Expert’s Top Picks
- A Definitive Guide of Working Capital Management with Best Practices & REAL-TIME Examples
- Business Analytics with Excel Fundamentals | A Complete Guide For Beginners
- Business Analyst : Job Description | All you need to know [ Job & Future ]
- How to create a Splunk Dashboard | A Complete Guide For Beginners [ OverView ]
- What is Splunk Logging ? | The Ultimate Guide with Expert’s Top Picks
- Alteryx vs Tableau | Know Their Differences and Which Should You Learn?
- What is Predictive Analytics? : Step-By-Step Process with REAL-TIME Examples
- An Overview of SAS Stored Processes | The Ultimate Guide with Expert’s Top Picks
- How to Create Conditional Formatting in Cognos Report Studio | A Complete Guide
- Difference between OLTP vs OLAP | Know Their Differences and Which Should You Learn?
- ECBA vs CCBA vs CBAP | A Complete Guide For Beginners | Know Their Differences and Which Should You Learn?
- Import Custom Geocode Data in Tableau | Everything You Need to Know [ OverView ]
- Data Warehouse Tools : Features , Concepts and Architecture
- PGDM vs MBA | Know Their Differences and Which Should You Learn?
- Most Popular Data Visualization Tools | A Complete Beginners Guide | REAL-TIME Examples
- Tableau vs Looker : Comparision and Differences | Which Should You Learn?
- Benefits of Employee Satisfaction for the Organization [ Explained ]
- DAX In Power BI – Learn Power BI DAX Basics [ For Freshers and Experience ]
- Power Bi vs Tableau : Comparision and Differences | Which Should You Learn?
- What is Alteryx Tools | Alteryx ETL Tools | Comprehensive Guide
- What is Tableau Prep? : Comprehensive Guide | Free Guide Tutorial & REAL-TIME Examples
- What are Business Intelligence Tools ? : All you need to know [ OverView ]
- Tableau Aggregate Functions | A Complete Guide with REAL-TIME Examples
- Intervalmatch Function in Qlikview | Everything You Need to Know [ OverView ]
- QlikView Circular Reference | Free Guide Tutorial & REAL-TIME Examples
- Data Blending in Tableau | A Complete Guide with Best Practices | Free Guide Tutorial [ OverView ]
- Splunk vs ELK | Differences and Which Should You Learn? [ OverView ]
- QlikSense vs QlikView | Differences and What to learn and Why?
- What Is Measurement System Analysis | Required Skills | Everything You Need to Know
- Splunk Timechart | Free Guide Tutorial & REAL-TIME Examples
- What Is Image Processing ? A Complete Guide with Best Practices
- What is a Business Analysis ? A Complete Guide with Best Practices
- Top Business Analytics Tools | Comprehensive Guide
- Business Analyst Career Path [ Job & Future ]
- Time Series Analysis Tactics | A Complete Guide with Best Practices
- What is Splunk ? Free Guide Tutorial & REAL-TIME Examples
- Which Certification is Right for You: Six Sigma or Lean Six Sigma?
- SAS Vs R
- Top Technology Trends for 2020
- Data Analyst vs. Data Scientist
- What are the Essential Skills That You Need to Master in Data Analyst?
- What is Six Sigma?
- Common Cause Variation Vs Special Cause Variation
- Reasons to Get a Six Sigma Certification
- What Is Strategic Enterprise Management and its Components?
- What Are The Benefits Measurement Constrained Optimization Methods?
- What Is the Benefit of Modern Data Warehousing?
- What Is Corporate Social Responsibility (CSR)?
- What Is The Purpose and Importance Of Financial Analysis?
- What is Insights-as-a-Service (IaaS)?
- Business Analytics With R Programming Languages
- Where Are The 8 Hidden Wastes?
- What Are Market Structures?
- What is Cost of Quality (COQ)?
- What is Build Verification Testing?
- Quality Improvement in Six Sigma
- What is Process Capability Analysis?
- How To Measure The Effectiveness Of Corporate Training
- SAP Financials And SAP Accounting Modules
- Tips to Learn Tableau
- Why Should I Become a CBAP?
- History And Evolution of Six Sigma
- How to use Control Chart Constants?
- Data Analytics Course For Beginners
- How to Build a Successful Data Analyst Career?
- Data Analytics Vs Business Analytics
- What is SAP Certification?
- Books To Read For a Six Sigma Certification
- Six Sigma Green Belt Salary
- What is the ASAP Methodology?
- Complete list of SAP modules

Common Cause Variation Vs Special Cause Variation
Last updated on 14th Oct 2020, Artciles, Blog, Business Analytics
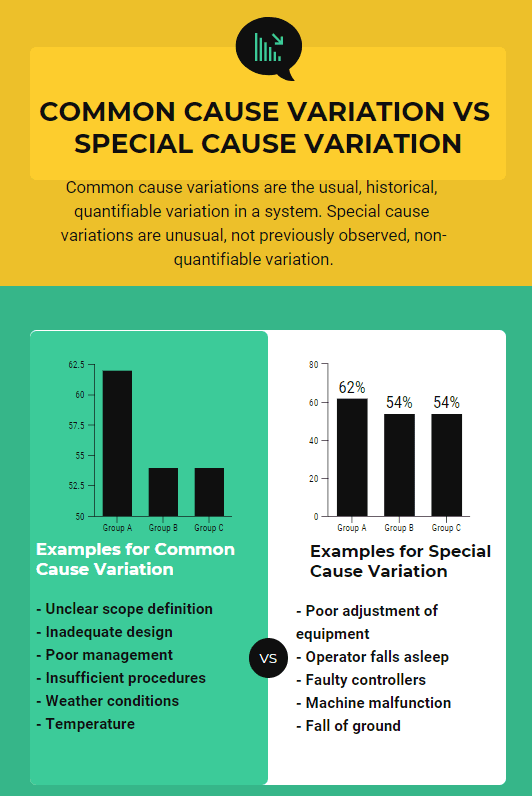
Unlike common cause variability, special cause variation is caused by known factors that result in a non-random distribution of output. Also referred to as “exceptional” or “assignable” variation. Example: Few X’s with big impact.
Special cause variation is a shift in output caused by a specific factor such as environmental conditions or process input parameters. It can be accounted for directly and potentially removed and is a measure of process control.
What is the variation?
Whatever measurement we take, there is always a variation between these measurements. No two items or measurements are precisely the same.
The problem with the variation is that it is the enemy of quality. Variation and quality do not go hand in hand. Variation reduction is one of the significant challenges of quality professionals.
Two types of variation, and why is it important to differentiate?
When dealing with variation, the challenge quality professionals face when to act and when not to act. Because if you act on each and every variation in the process and adjust the process, this will be a never-ending process. Dr. Deming called this “tempering the process.” Rather than improving the quality, tempering, in fact, reduces the quality. Deming demonstrated the effect of tempering with the help of a funnel experiment.
Subscribe For Free Demo
Error: Contact form not found.
The causes of variation can be classified into two categories:
- Common Causes
- Special Causes
Common Cause Vs Special Cause: Types of Variation :
Common cause variation is the natural variation in the process. It is a part of the process. There are “many” causes of this type of variation, and it is not easy to identify and remove these. You will need to live with them unless drastic action is taken, such as process re-engineering.
Common causes are also called natural causes, noise, non-assignable and random causes.
Special cause variation, on the other hand, is the unexpected variation in the process. There is a specific cause that can be assigned to the variation. For that reason, this is also called as the assignable cause. You are required to take action to address these variations.
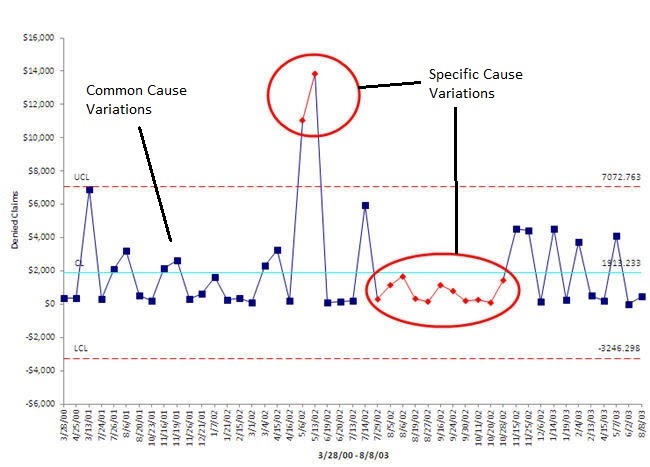
Control Charts to identify special causes :
If the measurements of a process are normally distributed, then there is a 99.73% chance that the measurement will be within plus and minus three standard deviations. This is the basis of control charts.
If you plot the measurements on a Control Chart, then any measurements which are outside the plus and minus three standard deviation limits are expected to be because of a special cause. These limits are called as the Upper Control Limit (UCL) and the Lower Control Limits (LCL), Once you get such measurement, you are expected to investigate, do the root cause analysis, find out the reason for such deviation and take necessary actions.
Common cause variation is fluctuation caused by unknown factors resulting in a steady but random distribution of output around the average of the data. It is a measure of the process potential, or how well the process can perform when special cause variation removed.
Common cause variability is a source of variation caused by unknown factors that result in a steady but random distribution of output around the average of the data. Common cause variation is a measure of the process’s potential, or how well the process can perform when special cause variation is removed. Therefore, it is a measure of the process technology. Common cause variation is also called random variation, noise, noncontrollable variation, within-group variation, or inherent variation. Example: Many X’s with a small impact.
Common cause variation is the remaining variation after removing the special causes (non-normal causes) due to one or more of the 5Ms and an “E” causes (Manpower, Material, Method, Measurement, Machine, and Environment), also known as 6Ms (Manpower, Mother nature, Materials, Method, Measurements or Machine).
Common Cause Variation
Common cause variation is variation resulting from factors that may or may not be known, but the final impact they have on your output is predictable and controllable, and you would usually know to expect some variation in specific areas when looking at your final reports. As we said above, some level of variation is inevitable for most types of processes, and this is usually the kind you want to have if you want to be sure that you’re in control of the current situation.
Note that in some cases, common cause variation can still be quite high, and this might cause issues in your production. Take steps to reduce it if you are able to identify the root causes, but don’t stress too much if you can’t get to the bottom of the situation.
Special Cause Variation
On the other hand, special cause variation occurs when something out of the ordinary happens in a process. This might be a one-time occurrence, or it can develop into a repeating effect, in which case it might eventually be categorized as common cause variation depending on the circumstances. It’s important to understand that sometimes you will simply not be able to avoid special cause variation, either because the nature of a process is prone to it, or because of external factors in your environment that are beyond your control.
When you’ve identified special cause variation though, it’s important to take prompt steps to deal with it. It may not be such a problematic factor right now, but if you leave it unattended for a long time, this might be a real problem that can bring down some parts of your operations. There are some tools that can help you figure out where some issues are coming from, but you may need to come up with some solutions of your own in some cases, depending on the complexity of the situation.

Get Practical Oriented Six Sigma Training to Meet the Industry Needs
- Instructor-led Sessions
- Real-life Case Studies
- Assignments
Example
We recently had the pleasure of doing a home exchange with a couple in Paris, France. Unlike Phoenix, Paris has a phenomenal public transportation system. By using the Metro, we were able to travel all over the city and visit a lot of great locations.
At the Metro stations, there is a reader board next to each track telling when the next train will arrive.
The trains arrive anywhere from four to five minutes apart. These variances would be considered from common, or random, causes.
However, on my birthday (a particularly cold night), we go down to the Metro station to get our train back to our arrondissement, check the reader board, and see that the train is delayed by 25 minutes due to a mechanical failure.
This variance would be considered from a special, or assignable, cause.
Common Cause Variation vs Special Cause Variation
What are the causes of variation in quality control or what are the types of variation? The term “variation” is widely used in statistics, quality management, genetics, and even in biology. It refers to the measurement for a group of numbers that spread out from their average value. Every measured data set involves some degree of variation even if the degree is slight. It is a numerical value specifies how widely data in a data set vary. A small variance shows that data are closer to the average and a high variance shows that data are very different than each other. There are two causes of variation in quality control which are Common Cause Variation and Special Cause Variation. In this article, we will give examples of common cause of variance and special cause of variance for the control chart.
How Should Organizations Respond to Variations?
In day-to-day business, there are some occasional issues that warrant a major corrective response and others that do not. We alluded to this in our prior example, pointing out that major response to normal traffic in a city is not needed; it is normal. A disruptive sinkhole does require alternative strategy.
Our focus here is the common. Other examples of common cause variation are a printer running out of paper, an assembly line arm needed to pause for regular maintenance, or a freight truck needing an oil change. These things can cause small variations in production time, but they are expected and planned for. They are not a surprise. An organization does not need to hold a conference call to decide how to respond to an empty printer. A worker pauses, grabs another ream, and pops it in. Back to business.
One other note is that variations can also be positive, warranting a good change in process. But that is a topic for the special variance section.
Prep, Not Avoidance
One might think that a major key to business success is avoiding trouble altogether. However, consider this simple law of physics: Every moving object faces a level of resistance. All the same, any time we are moving–whether it be toward our personal goals or business goals–there will be problems in our way that we must decide how to handle.
The issue at hand is not how to avoid all trouble, but how to respond to it and what to respond to. The key Six Sigma categories of common cause variation and special cause variation are helpful aids in planning how your organization will conserve time and material resources by responding.