
- Understanding Agile Methodologies and Principles | A Complete Tutorial
- What is a Work Breakdown Structure (WBS)? | Learn Overview, Steps, Benefits
- Traditional Project Management Tutorial | A Comprehensive Guide
- Total Quality Management (TQM): Complete Guide [STEP-IN]
- Total Productive Maintenance Tutorial | Get an Overview
- Virtual Team Tutorial – Learn Origin, Definition and its Scope
- The Rule of Seven in Project Management – Tutorial
- Make or Buy Decision – A Derivative Tutorial for Beginners
- What is Halo Effect? | Learn More through Tutorial
- Balanced Score Card Tutorial | Learn with Definition & Examples
- What is Supply Chain Management? | Tutorial with Examples
- Succession Planning Tutorial | A Complete Guide with Definitions
- What is Structured Brainstorming? | Quickstart & Learn the Tutorial
- Stress Management Tutorial | A Comprehensive Guide for Beginners
- What is a Statement of Work? | Learn with Definition & Examples
- What is Stakeholder Management? – The Ultimate Guide for Beginners
- How to Create a Staffing Management Plan? | Learn from Tutorial
- What is Resource Leveling? | A Comprehensive Tutorial
- Requirements Collection Tutorial: Gather Project Needs
- What Is a RACI Chart? | Learn with Example & Definitions
- Quality Assurance vs Quality Control: Tutorial with Definitions & Differences
- Project Workforce Management Tutorial | A Definitive Guide
- Project Time Management Tutorial: Strategies, Tips & Tools
- Project Management Success Criteria Tutorial | Understand and Know More
- Identify Risk Categories in Project Management | A Comprehensive Tutorial
- Project Records Management Tutorial | Quickstart -MUST READ
- Project Quality Plan (PQP) Tutorial | Ultimate Guide to Learn [BEST & NEW]
- Project Portfolio Management | A Defined Tutorial for Beginners
- Goals of a Project Manager Tutorial | The Ultimate Guide
- Project Management Triangle Tutorial: What It Is and How to Use
- Project Management Tools Tutorial | Learn Tools & Techniques
- What is PMO (project management office)? | A Complete Tutorial from Scratch
- Project Management Lessons | Learn in 1 Day [ STEP-IN ]
- What is a Project Kickoff Meeting? | Learn Now – A Definitve Tutorial
- Project Cost Management Tutorial | Steps, Basics, and Benefits
- Types of Contracts in Project Management | Learn with Examples
- Project Activity Diagram | Ultimate Guide to Learn [BEST & NEW]
- What is Project Procurement Management? | Tutorial Explained
- Procurement Documents Tutorial | The Ultimate Guide
- Process-Based Project Management Tutorial: A Beginner’s Guide
- What Is PRINCE2 Project Management? | A Definitive Tutorial for Beginners
- Effective Presentation Skills – Learn More through Tutorial
- Powerful Leadership Skills Tutorial | The Ultimate Guide
- PERT Estimation Technique Tutorial | Explained with Examples
- Pareto Chart Tool Tutorial | Learn Analysis, Diagram
- Organizational Structure Tutorial: Definition and Types
- Negotiation Skills for Project Management | Learn from the Basics
- Monte Carlo Analysis in Project Management Tutorial | A Perfect Guide to Refer
- Effective Management Styles Tutorial | The Ultimate Guide
- Management by Objectives (MBO) Tutorial | Overview, Steps, Benefits
- Leads, Lags & Float – Understand the Difference through Tutorial
- What is Knowledge Management? – Tutorial Explained
- What is Just-in-Time Manufacturing (JIT)? | Know More through Tutorial
- Gantt Chart Tool Tutorial: The Ultimate Guide
- Extreme Project Management Tutorial – Methodology & Examples
- Introduction for Event Chain Methodology Tutorial | Guide For Beginners
- Enterprise Resource Planning (ERP) | A Complete Tutorial for Beginners
- What Is Design of Experiments (DOE)? | Learn Now – A Definitve Tutorial
- Decision Making Tutorial – Know about Meaning, Nature, Characteristics
- Critical Path Method Tutorial | How to use CPM for project management
- What is Critical Chain Project Management? | A Complete Tutorial
- What is Conflict Management? | Learn the Definition, styles, strategies through Tutorial
- Effective Communication Skills Tutorial – Definitions and Examples
- Communication Models Tutorial – Project Management
- Methods of Communication Tutorial | A Complete Learning Path
- Communication Management Tutorial | Know more about Plans & Process
- What are Communication Channels? | Learn Now Tutorial
- Communication Blocker Tutorial | Explained with Examples
- Cause and Effect Diagrams Tutorial | The Ultimate Guide
- What is Benchmarking? | Technical & Competitive Tutorial
- Seven Processes of Prince2 Tutorial | Everything you Need to Know
- Design Thinking Tutorial – Quick Guide For Beginners
- What is Performance Testing | A Complete Testing Guide With Real-Time Examples Tutorial
- What is Confluence? : Tutorial For Beginners | A Complete Guide
- Lean Six Sigma Tutorial
- Agile Scrum Tutorial
- PMI-RMP Plan Risk Management Tutorial
- Designing the Blueprint Delivery Tutorial
- What is Confluence? : Tutorial For Beginners | A Complete Guide
- Program Benefits Management Tutorial
- Continuous Improvement – Agile Value Stream Mapping
- Program Organization Tutorial
- Risk and Issue Management Tutorial
- Project Integration Management Tutorial
- Planning and Control Tutorial
- Program Management Principles Tutorial
- program strategy Alignment Tutorial
- PMP Tutorial
- Program Governance Tutorial
- Program Life Cycle Management Tutorial
- PMP Exam Preparation Tutorial
- PMI-PgMP Tutorial
- Agile Methodologies and Frameworks- Kanban and Lean Management Tutorial
- JIRA Tutorial
- Primavera P6 Tutorial
Continuous Improvement – Agile Value Stream Mapping
Last updated on 29th Sep 2020, Blog, Project Management, Tutorials
What is value stream mapping?
Value stream mapping (sometimes called VSM) is a lean manufacturing technique to analyze, design, and manage the flow of materials and information required to bring a product to a customer. Also known as “material and information-flow mapping”, it uses a system of standard symbols to depict various work streams and information flows. Items are mapped as adding value or not adding value from the customer’s standpoint, with the purpose of rooting out items that don’t add value.
Value stream mapping can be used to improve any process where there are repeatable steps – and especially when there are multiple handoffs. In manufacturing, handoffs are easier to visualize because they usually involve the handoff of a tangible deliverable through stations. If, for example, a problem arises when assembling a vehicle, line workers can see the physical parts accumulating and jamming up a certain part of the assembly line. They can then stop the line to solve that problem and get the process flowing again.
The application of value stream mapping – also referred to as “visualizing” or “mapping” a process – isn’t limited to the assembly line. Lean value stream mapping has gained momentum in knowledge work because it results in better team communication and more effective collaboration.
Much of the waste in knowledge work occurs in the handoffs (or wait time) between team members, not within the steps themselves. Inefficient handoffs lead to low productivity and poor quality. Value stream mapping helps identify waste and streamline the production process. Value stream mapping can be applied to both the product and customer delivery flows. Product flow focuses on steps required to optimize product delivery and completion. The customer flow focuses on the steps required to deliver on end user requests and expectations.
Subscribe For Free Demo
Error: Contact form not found.
If you’re familiar with continuous delivery, then you likely already have an idea of how value stream mapping can apply to — and improve — that process. But before we dive into that topic, let’s take a look at some of the pros and cons of adopting value stream mapping.
History of value stream mapping
The origins of value stream mapping are often attributed to Toyota Motor Corporation. However, this is a murky topic. Toyota may have adopted it from other origin sources or it may have grown organically from shared ideas in the lean manufacturing community. Early versions of diagrams revealing the flow of materials and information can be found as early as 1918 in a book called Installing Efficiency Methods, by Charles E. Knoeppel.
Inside Toyota the practice was called “material and information flow mapping” and was done almost as an afterthought. Toyota’s success and use of lean manufacturing practices helped promote value stream mapping as a modern best practice for high efficiency business teams during the 1990s.
Value Stream Mapping – Stages
Value stream mapping involves creating visual maps of the process, called Value Stream Maps.
Value Stream Mapping progresses in the following stages:
Step 1: Start by identifying the product or service to be analyzed and the value being created by this process.
Step 2: Create a value stream map of the current process by identifying the steps, queues, delays, and information flows.
Step 3: Review the map to find delays, waste, and constraints. This can be done by reviewing the process and identifying activities that can be classified as waste. Also, identify the constraints if any.
Step 4: Create a new value stream map of the optimized state to be achieved in the future, by removing delays, waste, and constraints.
Step 5: Develop a roadmap to achieve the future state.
Step 6: Plan to revisit the process in the future to continually calibrate and optimize.
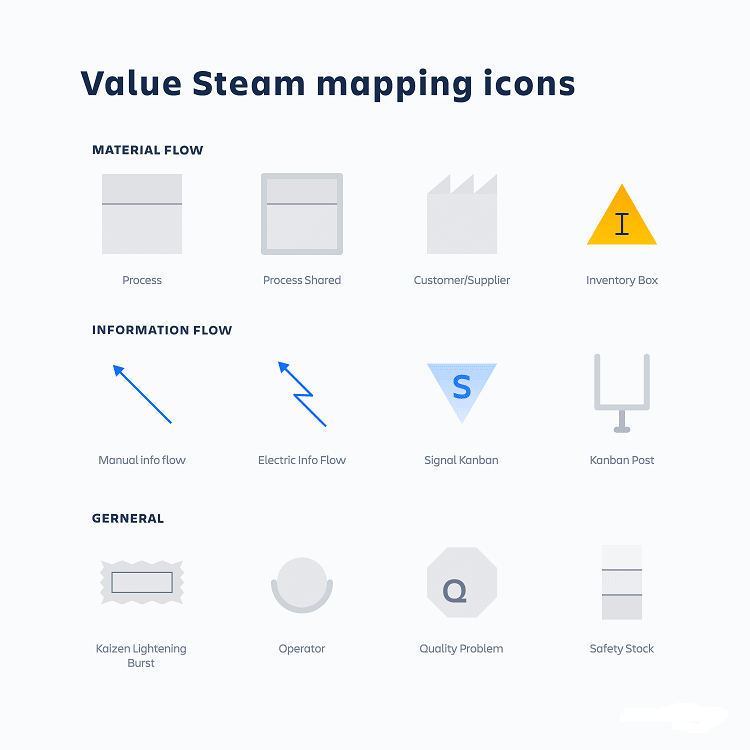
Value stream mapping symbols
There are standard symbols for outlining value stream mapping.
How to create a value stream map
1. Decide the problem you are solving for
What problem are you solving from the customer’s standpoint? Do your customers feel like it takes too long to deliver new features or improvements to a product? Publish the problem statement and get everyone on the same page.
2. Empower the right team
Empower a mature and experienced team who can skillfully address these problems in a timely fashion. The C-suite should set aside enough budget to ensure that execution is uninterrupted.
3. Bound the process
Once the problem statement is published, limit the scope of your value stream mapping accordingly. You may not need to map the release process in its entirety, and focus on a particular area instead.
4. Map the bounded process
Be sure to review the bounded process. This can make a difference, since firsthand experience cannot be substituted by (possibly biased) narratives and (possibly incomplete and inaccurate) documentation done by others.
Define the steps. I conduct a value stream mapping analysis multiple times. While this may sound redundant, I have found missing pieces in the second pass that were not exposed in the first pass. And when we investigated further, skeletons fell out of the closet during the third (and final) pass!
5. Collect process data
As you conduct value stream mapping, note the process data in the data boxes of the map. Process data includes (but is not limited to) the number of people involved, the average number of working hours, cycle time, wait time, uptime, downtime, and more.
6. Create a timeline
Map out process times and lead times.
7. Assess your current map
Be inquisitive. Do your teams have multiple dependencies with each other? Is your lead time too long? If it is, is it because your test suites don’t (or can’t) run in parallel? Do you have stable environments, or do you observe intermittent test failures that the teams cannot reproduce?
Or, you may have process steps that you think are valuable but don’t mean anything to the customer. Regarding the information flow, look for stagnation and drag in the flow. Note whether it was a push versus a pull.
8. Design the future map
You may not be able to nail a full and final version, and that’s okay. Make sure your new map aligns with the company’s vision.
Also, nothing is set in stone. Based on customer needs, make continuous adjustments.
9. Implement the future map
Follow the value stream mapping of the future and validate that it makes better sense for the customers. It should have solved the problem statement that you started with. Monitor KPIs regularly and learn from trends. Make sure everyone is rowing in the direction of customers.
Following are specific steps smaller companies can take to prepare for and achieve Value Stream Mapping (VSM).
Step 1: Gather Preliminary Information
Before moving ahead with VSM, be sure to gather the following information:
- 1. A history of your product mix from the previous year’s sales
- 2. The volume of sales for each product sold from the previous year
- 3. A list of your annual sales goals for the next year
- 4. Any calculated assumptions from your sales and marketing strategy that will affect your sales for the next year
- 5. This information will be useful in creating a history of your product mix, and the volume of sales for each product will help you apply Pareto’s 80-20 rule. In most cases, you will find that 20 percent of what you build represents 80 percent of your business in a typical year.
- 6. For example, an analysis for a company revealed that although the company offered more than 100 different base products, only five made up 72 percent of its overall business. In this case, company management initially decided to limit the value stream map to those five base products.
- 7. However, when management looked at the sales goals for the next year, three of the base products had targeted sales numbers that varied by 5 percent, and two new products with large projected sales volumes were planned for release. As a result, the analysis was modified so that seven out of the total number of base products amounted to 86 percent of the total business. This was the final analysis by which company management limited the scope of its value stream mapping activity.
Step 2: Create a Product Quantity Routing Analysis
- 1. To create a product quantity routing analysis, start by listing all of your customers and the products you build for each of them. Be sure to stick to the basics when it comes to your products. Don’t get bogged down with the various options that can be added to your base product. List your base standard products that differ in form, fit, and function.
- 2. Referencing your sales from the previous year, determine the volume for each product you made for your customers. Calculate the total number of products made, showing the volume of business generated from each customer to understand what your base demand was for the prior year. In, for instance, the total is 125 units.
- 3. Determine the percentage of business that each product represents from your total number of units sold, and then identify the mix of products that represents around 80 percent of your business. That mix will be what you want to VSM, which will allow you to begin thinking of what a model line will look like in your operation. In other words, by value stream mapping the 20 percent of the products that represent 80 percent of your business, you can identify and eliminate waste from these in-demand products so that a majority of your business becomes more efficient.
- 4. If you are a piece-part manufacturer (PPM), you also should start the process by making a list of your customers. Use that list to calculate the total number of finished piece parts you produced from the previous year. Then determine the percentage of business that each customer represents from the volume of parts you produced.
Step 3: Group Customers and Sort Materials
- 1. The next step is to group your customers together by the industry they represent. Figure 3 shows the total number of finished piece parts along with the total percentage of finished piece parts that each industry represents.
- 2. Sort out the number of material types by each industry and determine how many parts account for each type. The recreational vehicle (RV) industry has both aluminum parts and steel parts. (This scenario is very common for a PPM.) In this case, simply determine how many parts from the RV industry are aluminum and how many are steel. You do not need to keep all the customer’s parts together.
- 3. The purpose of this exercise is to identify which product families you want to map. Many PPMs do not know what their product families are, and if you try to map every product family at once in a HMLV environment, it will become too complicated.

Best Agile Training & Certification Course from Real-Time Experts
Weekday / Weekend BatchesSee Batch DetailsStep 4: Sort Product Families by Build Sequence
- 1. The next step before VSM is to construct a process quantity routing analysis to identify product families according to a similar build sequence. With this information, you will know exactly what you are mapping through the flow of your operations.
- 2. You have to know what parts or products flow through each work center and in what order. This helps you see which products follow the same routing sequence that logically make sense to group together. You might need to look at drawings you use to build the product to ensure you understand the routing of parts through the work centers.
Step 5: Choose One Value Stream to Begin With
- 1. It is important to know what products or piece parts comprise 80 percent of your business and which products or piece parts of that 80 percent make sense to group together as a value stream (product family). Start by value stream mapping one value stream at a time to keep things simple. You may find that although your analysis is examining 80 percent of what you build, it might be useful to group together products or piece parts from the other 20 percent with other value streams.
- 2. This could arise because they follow the same build sequence and have similar form, fit, and function. Don’t be so militant in following the 80-20 rule that you don’t leave room for flexibility when opportunities arise that are logical to include in your analysis
- 3. So, when choosing a value stream to start with, consider the impact that value stream has on the business unit, such as:
- 4. Highest percent of sales volume.
- 5. Market changes affecting consumer demand.
- 6. Profit margins of individual products.
- 7. Warranty data affecting various product lines.
- 8. Most enthusiasm from the company.
Step 6: Create an Operations Flow Chart
- 1. Next, create a flow chart of all the operations in your value stream. Refer to work order routings or the bill of materials for the product value stream as needed to identify the steps and create a starting point.
Step 7: Walk the Shop Floor
- 1. When it’s time to map the product family, the team needs to take a walk around the shop floor. The temptation will be together in a meeting room staring at numbers you ran from your MRP system without ever stepping foot onto your shop floor. That’s a sure way to miss wasteful activity that the MRP system doesn’t report.
- 2. Walk through the steps of your value stream where the work is being done. Start at the end of the process, working your way upstream to the beginning, to get a customer-supplier perspective at each step. You will be able to see any waste that’s occurring and whether it is unnecessary or acceptable. Don’t rationalize waste and assume it is happening only because of a new operator in training or a new product design, as you will miss identifying opportunities for improvement.
Step 8: Collect the Data
- 1. As you walk upstream through your value stream, you might be wondering how in the world you are going to collect all the data for each step! It can seem overwhelming for the team. Just remember to keep your team moving, and don’t get stuck in “analysis paralysis.” Data collection is important, but not at the expense of taking months to get anything implemented.
- 2. The first step is to refer to the routings you have available in your MRP system. Conduct time studies where applicable and review the results with the operators. If the operators and your team agree with your results, then use this data to fill in the gaps in your data box for any process that is missing data. Operators can be the best source for information when the data is unavailable and you can’t conduct a time study.
- 3. Another option is to use data from similar jobs. Referring back to your process quantity routing analysis, you should be able to identify other part numbers in your value stream that are similar. Run a report on a handful of similar parts in your value stream to give you some data to examine.
Step 9: Construct the Value Stream Mapping (VSM)
- 1. Metrics and Measurements. On a separate sheet of blank paper, begin constructing your value stream using symbols to indicate what is happening at each process.
- 2. At each step, be sure to measure the appropriate metrics as they apply to your process. This paints a good picture of the current condition at each process, despite what your MRP system says or what others might tell you.
- 3. Which metrics should you measure” That depends on your process. The point of VSM isn’t data collection; it’s to show you where the value is created and where the waste accumulates in your process.
- 4. Flow of Information. A VSM should show not only the flow of material, but also the flow of information. If you don’t know how information flows to the shop floor, you run the risk of processes waiting for instruction, creating downtime. You also have an incomplete picture of what you need to improve without first knowing how the flow of information will support your proposed idea.
- 5. For example, let’s say you have a weldment that takes 100 hours to complete. You decide that you want to break this into two stages into two different workcells. While it might make sense to break the work out this way, how are you going to know which parts need to be routed to each workcell” How do you know when these parts need to be routed? How will the operators record their time? How will drawings follow the work order (if you use work orders)?
- 6. When you start mapping the flow of information, you might discover why your lead-times are so long.
Step 10: Summarize the Data and Get the Big Picture
- 1. When you have identified all the steps in your value stream and have filled in all the data applicable to your VSM, it’s time to put it all together. Figure 8 demonstrates what a sample VSM should like when all the data has been collected. With this format, your team can stand back and look at what the data is telling you about the flow through your process.
- 2. Remember, the point isn’t to put together an artistic portrait of the flow through your value stream, but to use your VSM to see where the value is being created and identify where wasteful activity occurs. To help you find the waste, examine the process and ask yourself, “If the customer were to walk through each step of this value stream with his checkbook in hand, would he be willing to pay for each step he sees””
- 3. In addition, looking at your VSM, take the list of kaizen opportunities you identified in this process and begin prioritizing them by level of impact an improvement will make to the flow of your value stream. This will give your team an organized plan of action for where to start making improvements to your value stream.
- 4. With your VSM in hand, you are armed, ready, and well on your way to eliminating waste and learning to see the whole picture. Keep in mind that learning to see is not only the first step in creating a lean organization—it is half the battle.
Benefits of value stream mapping
Value stream mapping is critical for business sustainability. Here’s why:
- Reducing or eliminating waste can improve your company’s bottom line. As a bonus, you discover the root cause and the source of the waste.
- Once wasteful handoffs are identified as part of value stream visualizers, your teams can consciously improve behavior, culture, communication, and collaboration.
- Teams discard individual opinions and prioritize based on the customer’s perspective.
Challenges of value stream mapping
Value stream mapping can be wasteful in itself, if you are not careful. Here’s how you can avoid common pitfalls:
- The LOE (level of effort) to conduct value stream mapping should be balanced with the potential value and savings. Essentially, keep an eye on the return on investment ROI(return on investment) from the start.
- Involve experienced people from the business side and product side in conducting value stream mapping since the mapping process could be vastly cross-functional and complex.
- Fear and uncertainty are common symptoms when value stream mapping is conducted, and so the process of identifying waste can be intense.
- Improving a step here and a step there will rake in savings for sure. However, it may not directly translate to a bottom line improvement until a full walkthrough is completed. Having said that, baby steps are often a great way to start.
- Don’t rush to use professional charts, tools, and symbols right away. First, sketch with a pencil or use a whiteboard to outline the idea. Once the dust settles, formalize the map appropriately. Remember, you are trying to cut waste and not create any more than you already have.
- Overall, doing value stream mapping is fine, yet overdoing it can be problematic.
Value Stream Mapping – Example
- A subsidiary group of a publicly traded company produces a variety of products used in the metal brazing, cutting, and welding industries, and an array of gas-control equipment used in industrial, medical, and laboratory applications.
- As part of its continuous improvement drive, the group wanted to improve the preparation of chrome-plated components to assemble in its gas-pressure regulators. To achieve this goal, they decided to use the technique of value stream mapping.
Solution
- The group performed a Value Stream Mapping analysis. The given image depicts the analysis and implementation processes. The Value Stream Mapping tool provides detailed information on the flow of materials through a production process.
- It helped identify areas for improvement. The analysis revealed that to ensure a steady flow of these components through the production process, “supermarkets” have to be placed at various points along the production chain. Supermarkets are locations in which a standard amount of inventory is stored. When employees notice that the supermarkets are running low on materials, they restock them.
Outcome
- After reorganizing the production process, the group witnessed various improvements. For the last 18 months, there has been no shortage of components for assembly into regulators. There was a 75% reduction in WIP related to the components. This helped to minimize inventory costs leading to significant savings.