
- File formats in Hadoop Tutorial | A Concise Tutorial Just An Hour
- Controlling Hadoop Jobs Using Oozie Tutorial | The Complete Guide
- Apache Spark Streaming Tutorial | Best Guide For Beginners
- What is Elasticsearch | Tutorial for Beginners
- Amazon Kinesis : Process & Analyze Streaming Data | The Ultimate Student Guide
- Apache Camel Tutorial – EIP, Routes, Components | Ultimate Guide to Learn [BEST & NEW]
- Apache NiFi (Cloudera DataFlow) | Become an expert with Free Online Tutorial
- Kafka Tutorial : Learn Kafka Configuration
- Apache Sqoop Tutorial
- Spark And RDD Cheat Sheet Tutorial
- Apache Pig Tutorial
- Talend
- Cassandra Tutorial
- Kafka Tutorial
- HBase Tutorial
- Spark Java Tutorial
- ELK Stack Tutorial
- Netbeans Tutorial
- PySpark MLlib Tutorial
- Spark RDD Optimization Techniques Tutorial
- Apache Spark & Scala Tutorial
- Apache Impala Tutorial
- Apache Oozie: A Concise Tutorial Just An Hour | LearnoVita
- Apache Storm Advanced Concepts Tutorial
- Apache Storm Tutorial
- Hadoop Mapreduce tutorial
- Hive cheat sheet
- Spark Algorithm Tutorial
- Apache Spark Tutorial
- Apache Cassandra Data Model Tutorial
- Big Data Applications Tutorial
- Advanced Hive Concepts and Data File Partitioning Tutorial
- Hadoop Architecture Tutorial
- Big Data and Hadoop Ecosystem Tutorial
- Apache Mahout Tutorial
- Hadoop Tutorial
- BIG DATA Tutorial

ELK Stack Tutorial
Last updated on 12th Oct 2020, Big Data, Blog, Tutorials
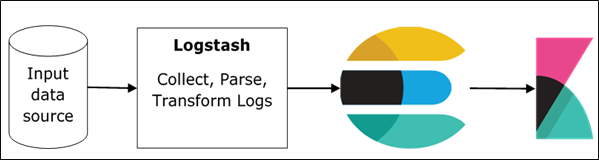
ELK stands for Elasticsearch, Logstash, and Kibana. In the ELK stack, Logstash extracts the logging data or other events from different input sources. It processes the events and later stores it in Elasticsearch. Kibana is a web interface, which accesses the logging data form Elasticsearch and visualizes it.
Subscribe For Free Demo
Error: Contact form not found.
Logstash and Elasticsearch
Logstash provides input and output Elasticsearch plugin to read and write log events to Elasticsearch. Elasticsearch as an output destination is also recommended by Elasticsearch Company because of its compatibility with Kibana. Logstash sends the data to Elasticsearch over the http protocol.
Elasticsearch provides bulk upload facility, which helps to upload the data from different sources or Logstash instances to a centralized Elasticsearch engine. ELK has the following advantages over other DevOps Solutions −
- ELK stack is easier to manage and can be scaled for handling petabytes of events.
- ELK stack architecture is very flexible and it provides integration with Hadoop. Hadoop is mainly used for archive purposes. Logstash can be directly connected to Hadoop by using flume and Elasticsearch provides a connector named es-hadoop to connect with Hadoop.
- ELK ownership total cost is much lesser than its alternatives.
Logstash and Kibana
Kibana does not interact with Logstash directly but through a data source, which is Elasticsearch in the ELK stack. Logstash collects the data from every source and Elasticsearch analyzes it at a very fast speed, then Kibana provides the actionable insights on that data.
Kibana is a web based visualization tool, which helps developers and others to analyze the variations in large amounts of events collected by Logstash in Elasticsearch engine. This visualization makes it easy to predict or to see the changes in trends of errors or other significant events of the input source.
To install Logstash on the system, we should follow the steps given below −
Step 1 − Check the version of your Java installed in your computer; it should be Java 8 because it is not compatible with Java 9. You can check this by −
In a Windows Operating System (OS) (using command prompt) −
- > java -version
- In UNIX OS (Using Terminal) −
- $ echo $JAVA_HOME
Step 2 − Download Logstash from −
- For Windows OS, download the ZIP file.
- For UNIX OS, download the TAR file.
- For Debian OS download the DEB file.
- For Red Hat and other Linux distributions, download the RPN file.
- APT and Yum utilities can also be used to install Logstash in many Linux distributions.
Step 3 − The installation process for Logstash is very easy. Let’s see how you can install Logstash on different platforms.
Note − Do not put any whitespace or colon in the installation folder.
- Windows OS − Unzip the zip package and the Logstash is installed.
- UNIX OS − Extract the tar file in any location and the Logstash is installed.
$tar –xvf logstash-5.0.2.tar.gz
Using APT utility for Linux OS −
- Download and install the Public Signing Key −
$ wget -qO – https://artifacts.elastic.co/GPG-KEY-elasticsearch | sudo apt-key add –
- Save the repository definition −
$ echo “deb https://artifacts.elastic.co/packages/5.x/apt stable main” | sudo
tee -a /etc/apt/sources.list.d/elastic-5.x.list
- Run update −
$ sudo apt-get update
- Now you can install by using the following command −
$ sudo apt-get install logstash
Using YUM utility for Debian Linux OS −
- Download and install the Public Signing Key −
$ rpm –import https://artifacts.elastic.co/GPG-KEY-elasticsearch
- Add the following text in the file with the .repo suffix in your o “/etc/yum.repos.d/” directory. For example, logstash.repo
- [logstash-5.x]
- name = Elastic repository for 5.x packages
- baseurl = https://artifacts.elastic.co/packages/5.x/yum
- gpgcheck = 1
- gpgkey = https://artifacts.elastic.co/GPG-KEY-elasticsearch
- enabled = 1
- autorefresh = 1
- type = rpm-md
- You can now install Logstash by using the following command −
$ sudo yum install logstash
Step 4 − Go to the Logstash home directory. Inside the bin folder, run the elasticsearch.bat file in case of windows or you can do the same using the command prompt and through the terminal. In UNIX, run the Logstash file.
We need to specify the input source, output source and optional filters. For verifying the installation, you can run it with the basic configuration by using a standard input stream (stdin) as the input source and a standard output stream (stdout) as the output source. You can specify the configuration in the command line also by using –e option.
In Windows −
- > cd logstash-5.0.1/bin
- > Logstash -e ‘input { stdin { } } output { stdout {} }’
In Linux −
- $ cd logstash-5.0.1/bin
- $ ./logstash -e ‘input { stdin { } } output { stdout {} }’
Note − in case of windows, you might get an error stating JAVA_HOME is not set. For this, please set it in environment variables to “C:\Program Files\Java\jre1.8.0_111” or the location where you installed java.
Step 5 − Default ports for Logstash web interface are 9600 to 9700 are defined in the logstash-5.0.1\config\logstash.yml as the http.port and it will pick up the first available port in the given range.
We can check if the Logstash server is up and running by browsing http://localhost:9600 or if the port is different and then please check the command prompt or terminal. We can see the assigned port as “Successfully started Logstash API endpoint {:port ⇒ 9600}. It will return a JSON object, which contains the information about the installed Logstash in the following way −
- {
- “host”:”manu-PC”,
- “version”:”5.0.1″,
- “http_address”:”127.0.0.1:9600″,
- “build_date”:”2016-11-11T22:28:04+00:00″,
- “build_sha”:”2d8d6263dd09417793f2a0c6d5ee702063b5fada”,
- “build_snapshot”:false
- }
In this chapter, we will discuss regarding the internal architecture and the different components of Logstash.
Logstash Service Architecture
Logstash processes logs from different servers and data sources and it behaves as the shipper. The shippers are used to collect the logs and these are installed in every input source. Brokers like Redis, Kafka or RabbitMQ are buffers to hold the data for indexers, there may be more than one brokers as failed over instances.
Indexers like Lucene are used to index the logs for better search performance and then the output is stored in Elasticsearch or other output destination. The data in output storage is available for Kibana and other visualization software.
Logstash Internal Architecture
The Logstash pipeline consists of three components Input, Filters and Output. The input part is responsible to specify and access the input data source such as the log folder of the Apache Tomcat Server.
Example to Explain the Logstash Pipeline
The Logstash configuration file contains the details about the three components of Logstash. In this case, we are creating a file name called Logstash.conf.
The following configuration captures data from an input log “inlog.log” and writes it to an output log “outlog.log” without any filters.
Logstash.conf
The Logstash configuration file just copies the data from the inlog.log file using the input plugin and flushes the log data to outlog.log file using the output plugin.
- input {
- file {
- path => “C:/tpwork/logstash/bin/log/inlog.log”
- }
- }
- output {
- file {
- path => “C:/tpwork/logstash/bin/log/outlog.log”
- }
- }
Run Logstash
Logstash uses –f option to specify the config file.
C:\logstash\bin> logstash –f logstash.conf
inlog.log
The following code block shows the input log data.
Hello tutorialspoint.com
outlog.log
The Logstash output contains the input data in message field. Logstash also adds other fields to the output like Timestamp, Path of the Input Source, Version, Host and Tags.
- {
- “path”:”C:/tpwork/logstash/bin/log/inlog1.log”,
- “@timestamp”:”2016-12-13T02:28:38.763Z”,
- “@version”:”1″, “host”:”Dell-PC”,
- “message”:” Hello tutorialspoint.com”, “tags”:[]
- }
As you can, the output of Logstash contains more than the data supplied through the input log. The output contains the Source Path, Timestamp, Version, Hostname and Tag, which are used to represent the extra messages like errors.
We can use filters to process the data and make its useful for our needs. In the next example, we are using filter to get the data, which restricts the output to only data with a verb like GET or POST followed by a Unique Resource Identifier.
Logstash.conf
In this Logstash configuration, we add a filter named grok to filter out the input data. The input log event, which matches the pattern sequence input log, only get to the output destination with error. Logstash adds a tag named “_grokparsefailure” in the output events, which does not match the grok filter pattern sequence.
Logstash offers many inbuilt regex patterns for parsing popular server logs like Apache. The pattern used here expects a verb like get, post, etc., followed by a uniform resource identifier.
- input {
- file {
- path => “C:/tpwork/logstash/bin/log/inlog2.log”
- }
- }
- filter {
- grok {
- match => {“message” => “%{WORD:verb} %{URIPATHPARAM:uri}”}
- }
- }
- output {
- file {
- path => “C:/tpwork/logstash/bin/log/outlog2.log”
- }
- }
Run Logstash
We can run Logstash by using the following command.
C:\logstash\bin> logstash –f Logstash.conf
inlog2.log
Our input file contains two events separated by default delimiter, i.e., new line delimiter. The first event matches the pattern specified in GROk and the second one does not.
GET /tutorialspoint/Logstash
Input 1234
outlog2.log
We can see that the second output event contains “_grokparsefailure” tag, because it does not match the grok filter pattern. The user can also remove these unmatched events in output by using the ‘if’ condition in the output plugin.
- {
- “path”:”C:/tpwork/logstash/bin/log/inlog2.log”,
- “@timestamp”:”2016-12-13T02:47:10.352Z”,”@version”:”1″,”host”:”Dell-PC”,”verb”:”GET”,
- “message”:”GET /tutorialspoint/logstash”, “uri”:”/tutorialspoint/logstash”, “tags”:[]
- }
- {
- “path”:”C:/tpwork/logstash/bin/log/inlog2.log”,
- “@timestamp”:”2016-12-13T02:48:12.418Z”, “@version”:”1″, “host”:”Dell-PC”,
- “message”:”t 1234\r”, “tags”:[“_grokparsefailure”]
- }
Conclusion
The ELK Stack is used by famous corporations all over the world such as Netflix, Medium and LinkedIn for handling their log data. This is because the tool works great while collecting data from different applications and converge it into a single instance. It is also very useful in vertical and horizontal scaling. Moreover, it supports multiple languages such as Python, Java, Perl and Ruby.
So, if you are a business owner struggling to handle your log data, ELK is the solution. For understanding the basics, keep this ELK Stack tutorial handy.