
- What is Lean?| Everything You Need to Know
- What is SAP Workflow? : A Complete Guide
- Difference between Tableau and Power BI | Benefits and Special Features
- Data Warehouse in Tableau | Everything You Need to Know
- What is Tableau Server?| Everything You Need to Know | A Definitive Guide
- What is Dax in Power BI? | A Comprehensive Guide
- Upgrade in Tableau Desktop and Web Authoring | A Complete Guide with Best Practices
- What is SAP HANA | SAP HANA Database Connection | All you need to know [ OverView ]
- SAP BPC – What is Business Planning and Consolidation? : All you need to know [ OverView ]
- Root Cause Analysis: Definition, Examples & Methods | All you need to know [ OverView ]
- Seven Basic Quality Improvement Ishikawa Tools | Important asset to control quality in your project [OverView]
- What is Power BI | Its Use Cases and Applications | All you need to know [ OverView ]
- How and why to measure and analyze employee productivity | Everything You Need to Know
- Top 10 Employee Retention Strategies | Everything You Need to Know
- What are LookML Projects and the Developer Mode | How to Create LookML Projects?
- What are Slowly Changing Dimension | SCD Types and Implementations | Step-By-Step Process
- What is Pareto Chart and How to Create Pareto Chart | A Complete Guide For Beginners
- What does an Agile Business Analyst do | Required Skills, Roles and Responsibilities [ Job & Future ]
- What is Lean Management? | Role and Concepts of Lean Management | Expert’s Top Picks
- A Definitive Guide of Working Capital Management with Best Practices & REAL-TIME Examples
- Business Analytics with Excel Fundamentals | A Complete Guide For Beginners
- Business Analyst : Job Description | All you need to know [ Job & Future ]
- How to create a Splunk Dashboard | A Complete Guide For Beginners [ OverView ]
- What is Splunk Logging ? | The Ultimate Guide with Expert’s Top Picks
- Alteryx vs Tableau | Know Their Differences and Which Should You Learn?
- What is Predictive Analytics? : Step-By-Step Process with REAL-TIME Examples
- An Overview of SAS Stored Processes | The Ultimate Guide with Expert’s Top Picks
- How to Create Conditional Formatting in Cognos Report Studio | A Complete Guide
- Difference between OLTP vs OLAP | Know Their Differences and Which Should You Learn?
- ECBA vs CCBA vs CBAP | A Complete Guide For Beginners | Know Their Differences and Which Should You Learn?
- Import Custom Geocode Data in Tableau | Everything You Need to Know [ OverView ]
- Data Warehouse Tools : Features , Concepts and Architecture
- PGDM vs MBA | Know Their Differences and Which Should You Learn?
- Most Popular Data Visualization Tools | A Complete Beginners Guide | REAL-TIME Examples
- Tableau vs Looker : Comparision and Differences | Which Should You Learn?
- Benefits of Employee Satisfaction for the Organization [ Explained ]
- DAX In Power BI – Learn Power BI DAX Basics [ For Freshers and Experience ]
- Power Bi vs Tableau : Comparision and Differences | Which Should You Learn?
- What is Alteryx Tools | Alteryx ETL Tools | Comprehensive Guide
- What is Tableau Prep? : Comprehensive Guide | Free Guide Tutorial & REAL-TIME Examples
- What are Business Intelligence Tools ? : All you need to know [ OverView ]
- Tableau Aggregate Functions | A Complete Guide with REAL-TIME Examples
- Intervalmatch Function in Qlikview | Everything You Need to Know [ OverView ]
- QlikView Circular Reference | Free Guide Tutorial & REAL-TIME Examples
- Data Blending in Tableau | A Complete Guide with Best Practices | Free Guide Tutorial [ OverView ]
- Splunk vs ELK | Differences and Which Should You Learn? [ OverView ]
- QlikSense vs QlikView | Differences and What to learn and Why?
- What Is Measurement System Analysis | Required Skills | Everything You Need to Know
- Splunk Timechart | Free Guide Tutorial & REAL-TIME Examples
- What Is Image Processing ? A Complete Guide with Best Practices
- What is a Business Analysis ? A Complete Guide with Best Practices
- Top Business Analytics Tools | Comprehensive Guide
- Business Analyst Career Path [ Job & Future ]
- Time Series Analysis Tactics | A Complete Guide with Best Practices
- What is Splunk ? Free Guide Tutorial & REAL-TIME Examples
- Which Certification is Right for You: Six Sigma or Lean Six Sigma?
- SAS Vs R
- Top Technology Trends for 2020
- Data Analyst vs. Data Scientist
- What are the Essential Skills That You Need to Master in Data Analyst?
- What is Six Sigma?
- Common Cause Variation Vs Special Cause Variation
- Reasons to Get a Six Sigma Certification
- What Is Strategic Enterprise Management and its Components?
- What Are The Benefits Measurement Constrained Optimization Methods?
- What Is the Benefit of Modern Data Warehousing?
- What Is Corporate Social Responsibility (CSR)?
- What Is The Purpose and Importance Of Financial Analysis?
- What is Insights-as-a-Service (IaaS)?
- Business Analytics With R Programming Languages
- Where Are The 8 Hidden Wastes?
- What Are Market Structures?
- What is Cost of Quality (COQ)?
- What is Build Verification Testing?
- Quality Improvement in Six Sigma
- What is Process Capability Analysis?
- How To Measure The Effectiveness Of Corporate Training
- SAP Financials And SAP Accounting Modules
- Tips to Learn Tableau
- Why Should I Become a CBAP?
- History And Evolution of Six Sigma
- How to use Control Chart Constants?
- Data Analytics Course For Beginners
- How to Build a Successful Data Analyst Career?
- Data Analytics Vs Business Analytics
- What is SAP Certification?
- Books To Read For a Six Sigma Certification
- Six Sigma Green Belt Salary
- What is the ASAP Methodology?
- Complete list of SAP modules

How to Build a Successful Data Analyst Career?
Last updated on 30th Sep 2020, Artciles, Blog, Business Analytics
Who Is a Data Analyst?
A data analyst is the one who collects, organizes, and analyzes large sets of data to discover patterns and other useful information. Data mining and data auditing must have skills to become a Data Analyst.
How to Become a Data Analyst in 2020
Here are five steps to consider if you’re interested in pursuing a career in data science:
- 1. Earn a bachelor’s degree in a field with an emphasis on statistical and analytical skills, such as math or computer science
- 2. Learn important data analytics skills
- 3. Consider certification
- 4. Get your first entry-level data analyst job
- 5. Earn a master’s degree in data analytics
What Does a Data Analyst Do?
A data analyst collects, processes and performs statistical analyses on large dataset. They discover how data can be used to answer questions and solve problems. With the development of computers and an ever increasing move toward technological intertwinement, data analysis has evolved. The development of the relational database gave a new breath to data analysts, which allowed analysts to use SQL (pronounced “sequel” or “s-q-l”) to retrieve data from databases.
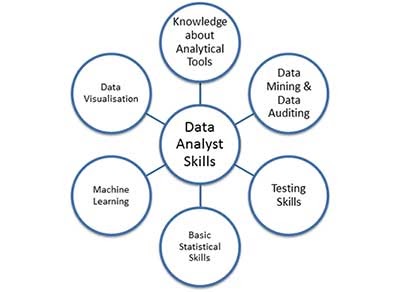
Data Analyst Skills:
If you intend to become a successful data analyst, you must start by ensuring a good knowledge in technology, business intelligence, data mining, data auditing, mathematics, statistics and another bunch of analytics skills which include:
- 1. Programming Languages: You need to be familiar with some computer software and scripting languages like Matlab and Python to find significant insights, statistical languages like R, SAS, and other computer skills include JavaScript, XML, and so on.
- 2. Data Mining and Auditing: A data analyst must have data mining and auditing skills. Data mining is the process of sorting through large sets of data to classify patterns and establish relationships through data analysis. Data auditing is the process of conducting a data audit to assess how a company’s data can be used for a given purpose.
- 3. Testing Skills: A data analyst must have testing skills as tests are carried out based on different hypotheses that impact the key performance indicators in one way or another.
- 4. Statistical Skills: A data analyst must have a grounding in statistics as it helps in understanding algorithms.
- 5. Communication Skills: A data analyst is expected to work with different people. So, one should be able to communicate technical findings to non-technical co-workers to solve business problems.
Data Analyst Job Description:
As a data analyst, you will need to:
- Identify, analyze, and interpret trends or patterns in complex data sets that help in boosting business.
- Import data from various external data sources to bring meaningful insights to the business.
- Create data visualizations to effectively convey findings to management that helps in the decision-making process.
- Filter and clean data by examining computer reports and performance indicators.
- Work with management, IT teams, and data scientists to determine organizational goals.
- Collect customer requirements, determine technical issues, and design reports to meet data analysis needs.
- Identify new sources of data and methods to improve data collection, analysis, and reporting.
- Collect, understand, and document detailed business requirements using appropriate tools and techniques.
- Locate and define new process improvement opportunities.
Data Mining and Data Auditing Skills
As mentioned above, data mining and data auditing are must-have skills for any data analyst. Data mining is the practice of examining large, pre-existing databases in order to generate new information, whereas data auditing involves profiling the data and assessing the impact of poor quality data on the organization’s performance and profits. So make sure to brush on these skills.
Testing Skills
Testing skills are required to be a big data analyst, as he/she will be carrying out A/B testing based on different hypotheses that directly and indirectly impact different Key Performance Indicators.
Basic Statistical Skills
Usually, it is the Data Scientist that works on the statistical part but even as a data analyst you should have basic statistical knowledge as it will help you to select the right approach while dealing with a particular situation.
Machine Learning
Again like statistical skills, machine learning is something that most data scientists work on but if you are working in a large organization then there is a chance that you will need to know about machine learning methods like Decision Trees, K-Means, etc.
Data Visualization and Communication
This is one of the most important skills that a data analyst must possess. Data visualization is the presentation of data in a pictorial or graphical format. This helps the management to understand the data easily and quick. The success of data visualization depends on how well you can communicate it to management.
Typical Data Analyst Job Description
Most jobs in data analytics involve gathering and cleaning data to uncover trends and business insights. The day-to-day data analyst job varies depending on the industry or company or the type of data analytics you consider your specialty. Data analysts may be responsible for creating dashboards, designing and maintaining relationship databases and systems for different departments throughout their organization using business intelligence software, Tableau, and programming.
Most data analysts work with IT teams, management and/or data scientists to determine organizational goals. They mine and clean data from primary and secondary sources then analyze and interpret results using standard statistical tools and techniques. In most cases, they pinpoint trends, correlations and patterns in complex data sets and identify new opportunities for process improvement. Data analysts must also create reports on their findings and communicate next steps to key stakeholders.
Data Analyst Qualifications
Skills Required for Data Analysts
- 1. Programming Languages (R/SAS): data analysts should be proficient in one language and have working knowledge of a few more. Data analysts use programming languages such as R and SAS for data gathering, data cleaning, statistical analysis, and data visualization.
- 2. Creative and Analytical Thinking: Curiosity and creativity are key attributes of a good data analyst. It’s important to have a strong grounding in statistical methods, but even more critical to think through problems with a creative and analytical lens. This will help the analyst to generate interesting research questions that will enhance a company’s understanding of the matter at hand.
- 3. Strong and Effective Communication: Data analysts must clearly convey their findings — whether it’s to an audience of readers or a small team of executives making business decisions. Strong communication is the key to success.
- 4. Data Visualization: Effective data visualization takes trial and error. A successful data analyst understands what types of graphs to use, how to scale visualizations, and know which charts to use depending on their audience.
- 5. Data Warehousing: Some data analysts work on the back-end. They connect databases from multiple sources to create a data warehouse and use querying languages to find and manage data.
- 6. SQL Databases: SQL databases are relational databases with structured data. Data is stored in tables and a data analyst pulls information from different tables to perform analysis.
- 7. Database Querying Languages: The most common querying language data analysts use is SQL and many variations of this language exist, including PostreSQL, T-SQL, PL/SQL (Procedural Language/SQL).
- 8. Data Mining, Cleaning and Munging: When data isn’t neatly stored in a database, data analysts must use other tools to gather unstructured data. Once they have enough data, they clean and process through programming.
- 9. Advanced Microsoft Excel: Data analysts should have a good handle on excel and understand advanced modeling and analytics techniques.
- 10. Machine Learning: Data analysts with machine learning skills are incredibly valuable, although machine learning is not expected skill of typical data analyst jobs.
Data Analyst Responsibilities
A Day in the Life of a Data Analyst
The day-to-day for a data analyst depends on where they work and what tools they work with. Some data analysts don’t use programming languages and prefer statistical software and Excel. Depending on the problems they are trying to solve, some analysts perform regression analysis or create data visualizations. Experienced data analysts are sometimes considered “junior data scientists” or “data scientists in training.” In some cases, a data analyst/scientist could be writing queries or addressing standard requests in the morning and building custom solutions or experimenting with relational databases, Hadoop and NoSQL in the afternoon.
“A big part of my job is creating player projections for Fantasy Baseball. These power the default rankings in our draft rooms and inform my preseason and in-season rankings of players. Our readers and customers of our Fantasy product rely on the accuracy of these projections, so it’s important to have a sound statistical basis for making them.During the season, we have a high degree of interaction with our audience, as a large part of our responsibility is to respond to questions about player value and performance. Statistical analysis informs these recommendations, whether they are made through social media platforms, written and video content, or podcasts”
What tools do data analysts use?
Here are some other important tools data analysts use on the job:
- Google Analytics (GA): GA helps analysts gain an understanding of customer data, including trends and areas of customer experience that need improvement on landing pages or calls to action (CTAs)
- Tableau: Analysts use Tableau to aggregate and analyze data. They can create and share dashboards with different team members and create visualizations
- Jupyter Notebook system: Jupyter notebooks make it simple for data analysts to test code. Non-technical folks prefer the simple design of jupyter notebooks because of its markdown feature
- Github: Github is a platform for sharing and building technical projects. A must for data analysts who use object-oriented programming
- AWS S3: AWS S3 is a cloud storage system. Data analysts can use it to store and retrieve large datasets
Data Analyst Job Outlook
Today’s data analysts should be prepared for a change. Analyst’s roles are increasingly becoming more complex. Experienced analysts use modeling and predictive analytics techniques to generate useful insights and actions. Then they have to explain what they’ve discovered to rooms of confused laymen. In other words, they have to transform themselves from data analysts into data scientists.
Market research analyst positions are expected to grow by 20% and management analyst positions are all expected to grow by 14%, which is much faster than the average job growth according to recent data from the Bureau of Labor Statistics. Because data analysts can fit in the majority of industries such as finance, healthcare, information, manufacturing, professional services, and retail – the growth of technology brings the growth of more analyst positions. We are collecting data at every turn, its organization, and implication of predictive analysis assists society in becoming a better version of itself.
Data Analyst Salary
Salary numbers are dependent on job responsibilities. A senior data analyst with the skills of a data scientist can command a high price.
Salaries for Data Analysts:
1. Average salary for entry-level data analysts: $83,750
2. Average salary for data analysts: $100,250
3. Average salary for senior data analysts: $118,750-$142,500
So You Want to be a Data Analyst
You’ve decided you want to be a data analyst. Or maybe your goal is to be a data scientist, but you know many entry-level jobs are analyst roles. In either case, you’re going to need to master data analyst skills to get you where you want to go.
But what are those skills? What are the things you need to know? In this article, you’ll learn the eight key skills you’ll need to get a job as a data analyst.
We’ll be focusing on skills and not on tools (like Python, R, SQL, Excel, Tableau, etc.) Our focus will be what you’ll need to do as a data analyst, not how you do those things.
Tools — the how — will vary depending on the exact role, the company that hires you, and the industry you end up working in. You can take the data analyst skills from this article and apply them using the tools that you’re learning with, or that suit the industry you’re looking to break into.
The research for this article was taken from the planning for our Dataquest Data Analyst paths. To make sure we teach the right mix of skills, we did a lot of research to understand what data analysts really do.
This research included interviews with data analysts, data scientists, and recruiters/hiring managers for data roles. We also conducted a review of existing research on the topic.
1: Data Cleaning and Preparation
Research shows that data cleaning and preparation accounts for around 80% of the work of data professionals. This makes it perhaps the key skill for anyone serious about getting a job in data.
Commonly, a data analyst will need to retrieve data from one or more sources and prepare the data so it is ready for numerical and categorical analysis. Data cleaning also involves handling missing and inconsistent data that may affect your analysis.
Data cleaning isn’t always considered “sexy”, but preparing data can actually be a lot of fun when treated as a problem-solving exercise. In any case, it’s where most data projects start, so it’s a key skill you’ll need if you’re going to become a data analyst.

2: Data Analysis and Exploration
It might sound funny to list “data analysis” in a list of required data analyst skills. But analysis itself is a specific skill that needs to be mastered.
At its core, data analysis means taking a business question or need and turning it into a data question. Then, you’ll need to transform and analyze data to extract an answer to that question.
Another form of data analysis is exploration. Data exploration is looking to find interesting trends or relationships in the data that could bring value to a business.
Exploration might be guided by an original business question, but it also might be relatively unguided. By looking to find patterns and blips in the data, you may stumble across an opportunity for the business to decrease costs or increase growth!
3: Statistical Knowledge
A strong foundation in probability and statistics is an important data analyst skill. This knowledge will help guide your analysis and exploration and help you understand the data that you’re working with.
Additionally, understanding stats will help you make sure your analysis is valid and will help you avoid common fallacies and logical errors.
The exact level of statistical knowledge required will vary depending on the demands of your particular role and the data you’re working with. For example, if your company relies on probabilistic analysis, you’ll need a much more rigorous understanding of those areas than you would otherwise.
4: Creating Data Visualizations
Data visualizations make trends and patterns in data easier to understand. Humans are visual creatures, and most people aren’t going to be able to get meaningful insight by looking at a giant spreadsheet of numbers. As a data analyst, you’ll need to be able to create plots and charts to help communicate your data and findings visually.
This means creating clean, visually compelling charts that will help others understand the data. It also means avoiding things that are either difficult to interpret (like pie charts) or can be misleading (like manipulating axis values).
Visualizations can also be an important part of data exploration. Sometimes there are things that you can see visually in the data that can hide when you just look at the numbers.
Data with the same statistics can produce radically different plots (source)
It’s very rare to find data role that doesn’t require data visualization, making it a key data analyst skill.
5: Creating Dashboards and/or Reports
As a data analyst, you’ll need to empower others within your organization to use data to make key decisions. By building dashboards and reports, you’ll be giving others access to important data by removing technical barriers.
This might take the form of a simple chart and table with date filters, all the way up to a large dashboard containing hundreds of data points that are interactive and update automatically.
Job requirements can vary a lot from position to position, but almost every data analyst job is going to involve producing reports on your findings and/or building dashboards to showcase them.
6: Writing and Communication Skills
The ability to communicate in multiple formats is a key data analyst skill. Writing, speaking, explaining, listening— strong communication skills across all of these areas will help you succeed.
Communication is key in collaborating with your colleagues. For example, in a kickoff meeting with business stakeholders, careful listening skills are needed to understand the analyses they require. Similarly, during your project, you may need to be able to explain a complex topic to non-technical teammates.
Written communication is also incredibly important — you’ll almost certainly need to write up your analysis and recommendations.
Being clear, direct, and easily understood is a skill that will advance your career in data. It may be a “soft” skill, but don’t underestimate it — the best analytical skills in the world won’t be worth much unless you can explain what they mean and convince your colleagues to act on your findings.
7: Domain Knowledge
Domain knowledge is understanding things that are specific to the particular industry and company that you work for. For example, if you’re working for a company with an online store, you might need to understand the nuances of e-commerce. In contrast, if you’re analyzing data about mechanical systems, you might need to understand those systems and how they work.
Domain knowledge changes from industry to industry, so you may find yourself needing to research and learn quickly. No matter where you work, if you don’t understand what you’re analyzing it’s going to be difficult to do it effectively, making domain knowledge a key data analyst skill.
This is certainly something that you can learn on the job, but if you know a specific industry or area you’d like to work in, building as much understanding as you can up front will make you a more attractive job applicant and a more effective employee once you do get the job.
8: Problem-Solving
As a data analyst, you’re going to run up against problems, bugs, and roadblocks every day. Being able to problem-solve your way out of them is a key skill.
You might need to research a quirk of some software or coding language that you’re using. Your company might have resource constraints that force you to be innovative in how you approach a problem. The data you’re using might be incomplete. Or you might need to perform some “good enough” analysis to meet a looming deadline.
Whatever the circumstances, strong problem-solving skills are going to be an incredible asset for any data analyst.