
- What is Dimension Reduction? | Know the techniques
- Top Data Science Software Tools
- What is Data Scientist? | Know the skills required
- What is Data Scientist ? A Complete Overview
- Know the difference between R and Python
- What are the skills required for Data Science? | Know more about it
- What is Python Data Visualization ? : A Complete guide
- Data science and Business Analytics? : All you need to know [ OverView ]
- Supervised Learning Workflow and Algorithms | A Definitive Guide with Best Practices [ OverView ]
- Open Datasets for Machine Learning | A Complete Guide For Beginners with Best Practices
- What is Data Cleaning | The Ultimate Guide for Data Cleaning , Benefits [ OverView ]
- What is Data Normalization and Why it is Important | Expert’s Top Picks
- What does the Yield keyword do and How to use Yield in python ? [ OverView ]
- What is Dimensionality Reduction? : ( A Complete Guide with Best Practices )
- What You Need to Know About Inferential Statistics to Boost Your Career in Data Science | Expert’s Top Picks
- Most Effective Data Collection Methods | A Complete Beginners Guide | REAL-TIME Examples
- Most Popular Python Toolkit : Step-By-Step Process with REAL-TIME Examples
- Advantages of Python over Java in Data Science | Expert’s Top Picks [ OverView ]
- What Does a Data Analyst Do? : Everything You Need to Know | Expert’s Top Picks | Free Guide Tutorial
- How To Use Python Lambda Functions | A Complete Beginners Guide [ OverView ]
- Most Popular Data Science Tools | A Complete Beginners Guide | REAL-TIME Examples
- What is Seaborn in Python ? : A Complete Guide For Beginners & REAL-TIME Examples
- Stepwise Regression | Step-By-Step Process with REAL-TIME Examples
- Skewness vs Kurtosis : Comparision and Differences | Which Should You Learn?
- What is the Future scope of Data Science ? : Comprehensive Guide [ For Freshers and Experience ]
- Confusion Matrix in Python Sklearn | A Complete Beginners Guide | REAL-TIME Examples
- Polynomial Regression | All you need to know [ Job & Future ]
- What is a Web Crawler? : Expert’s Top Picks | Everything You Need to Know
- Pandas vs Numpy | What to learn and Why? : All you need to know
- What Is Data Wrangling? : Step-By-Step Process | Required Skills [ OverView ]
- What Does a Data Scientist Do? : Step-By-Step Process
- Data Analyst Salary in India [For Freshers and Experience]
- Elasticsearch vs Solr | Difference You Should Know
- Tools of R Programming | A Complete Guide with Best Practices
- How To Install Jenkins on Ubuntu | Free Guide Tutorial
- Skills Required to Become a Data Scientist | A Complete Guide with Best Practices
- Applications of Deep Learning in Daily Life : A Complete Guide with Best Practices
- Ridge and Lasso Regression (L1 and L2 regularization) Explained Using Python – Expert’s Top Picks
- Simple Linear Regression | Expert’s Top Picks
- Dispersion in Statistics – Comprehensive Guide
- Future Scope of Machine Learning | Everything You Need to Know
- What is Data Analysis ? Expert’s Top Picks
- Covariance vs Correlation | Difference You Should Know
- Highest Paying Jobs in India [ Job & Future ]
- What is Data Collection | Step-By-Step Process
- What Is Data Processing ? A Step-By-Step Guide
- Data Analyst Job Description ( A Complete Guide with Best Practices )
- What is Data ? All you need to know [ OverView ]
- What Is Cleaning Data ?
- What is Data Scrubbing?
- Data Science vs Data Analytics vs Machine Learning
- How to Use IF ELSE Statements in Python?
- What are the Analytical Skills Necessary for a Successful Career in Data Science?
- Python Career Opportunities
- Top Reasons To Learn Python
- Python Generators
- Advantages and Disadvantages of Python Programming Language
- Python vs R vs SAS
- What is Logistic Regression?
- Why Python Is Essential for Data Analysis and Data Science
- Data Mining Vs Statistics
- Role of Citizen Data Scientists in Today’s Business
- What is Normality Test in Minitab?
- Reasons You Should Learn R, Python, and Hadoop
- A Day in the Life of a Data Scientist
- Top Data Science Programming Languages
- Top Python Libraries For Data Science
- Machine Learning Vs Deep Learning
- Big Data vs Data Science
- Why Data Science Matters And How It Powers Business Value?
- Top Data Science Books for Beginners and Advanced Data Scientist
- Data Mining Vs. Machine Learning
- The Importance of Machine Learning for Data Scientists
- What is Data Science?
- Python Keywords

What is Seaborn in Python ? : A Complete Guide For Beginners & REAL-TIME Examples
Last updated on 02nd Nov 2022, Artciles, Blog, Data Science
- In this article you will learn:
- 1.Preface to Seaborn in python.
- 2.Different orders of plot in Seaborn.
- 3.Features of Seaborn.
- 4.Seaborn – Environment Setup.
- 5.Seaborn – Importing Datasets and Libraries.
- 6.The ensuing line of law can help you import the information.
- 7.Seaborn – Histogram.
- 8.Seaborn – Kernel viscosity Conditions.
- 9.Installation of seaborn library for Python.
- 10.Conniving Chart Using seaborn Library.
- 11.Advantage and Disadvantage of Seaborn.
- 12.Conclusion.
Preface to Seaborn in python:
Seaborn is an open source Python library erected on top of a matplotlib.Created graphs can also be customized fluently. Below are many of the Data Identification Benefits.Graphs can help us find useful data trends for any machine literacy or vaccination design.seductive graphs can make donations and reports more charming to the anthology.Seaborn is an amazing data visualization library for editing fine plates in Python. Provides beautiful automated styles and color palettes to make fine pieces more seductive. erected on top of the matplotlib library and reassembled near data structures from pandas. In this tutorial, we will look at how to use seaborn to make a variety of spots and how to use them and matplotlib to make our spots more seductive.
Different orders of plot in Seaborn:
- Spots are used to fantasize connections between dynamic objects. Those variables can be whole figures or orders as a group, order or division. Seaborn divides the structure into subsections.
- Occurrences This structure is about the inflexibility of the sections and how they can be perceived.
- Distribution spots This structure is used to estimate fixed and bivariate distribution.
- Seaborn retreat occurrences are primarily intended to add a visual companion that helps emphasize patterns in the database during the analysis of test data.
- Matrix Matters The structure of the matrix is a series of scatterplots.
Features of Seaborn:
- Designed with themes to vogue matplotlib plates.
- Fantasize static and volume information.
- Installation and visual image of retrospective models.
- Rich information statistics.
- Comes with natural themes for Matplotlib vogue delineations.
- In utmost cases, you ’ll still use Matplotlib to form an easy plot. The Matplotlib word is generally recommended to mend Seaborn dereliction spots.
Seaborn – Environment Setup:
Includes Seaborn and launch In this section, we’re going to perceive the way concerned within the installation of Seaborn. Using the Pip Installer To install the newest Seaborn unharness, you ’ll be suitable to use pip –pip fitted seaborn For Windows, UNIX system & mackintosh victimization Eunectes murinusAnaconda( from https//www.anaconda.com/ could be a free Python extension for the SciPy mound. also accessible on the UNIX system and macintosh .
It’s also implicit to put in a interpretation free employing a conda:
- Conda place in seaborn.
- Install the Seaborn upgrade interpretation directly from github.
- https//github.com/mwaskom/seaborn .
- Dependence.
Consider the posterior Seaborn- grounded:
- Python 2.7 or 3.4.
- Numpy.
- Scipy.
- Pandas.
- Matplotlib.
Seaborn – Importing Datasets and Libraries:
Importing Libraries:
Let’s begin with the preface of Panda, which is an awful library for managing connected information sets( table format). Seaborn comes in handy formerly operating with DataFrames, which is extensively employed in information analytics design:
The following command can help you import Panda:
Pandas to manage information sets import pandas as essence Now, let’s herald the Matplotlib library, that helps the United States customize our spots. Matplotlib for a lot of customization from matplotlib import py plot as plt Seaborn piece of jotting and erudite kidney.
- Import seaborn as sb.
- Importing information.
The ensuing line of law can help you import the information:
- Seaborn piece of jotting and erudite kidney.
- import seaborn as sb.
- df = sb.load_dataset( ‘ tips ’).
- printer.head().
- The top line of the law can induce the posterior affair .
- tip for smoker coitus size of day time.
- 016.991.01 girl while not regale two.
- 110.341.66 a person United Nations agency does n’t Have regale three.
- 221.013.50 manly No Sun regale three.
- 323.683.31 manly No Sun regale two.
- 424.593.61 a girl while not regale four.
To see all the information sets out there within the Seaborn library, you ’ll use the posterior command with theget_dataset_names() perform as shown below – import seaborn as sb printsb.get_dataset_names() The top line of the law can come back the list of accessible information sets because the coming affair ‘ anscombe ’, ‘ attention ’, ‘brain_networks ’, ‘car_crashs ’, ‘ blotches ’, exercise, breakouts, fmri, gammas, iris, globes, tips, ” Titicic ‘) DataFrames store information within the type of blockish grids wherever information is simply viewed. every row of an oblong grid contains illustration values, and every column of the grid may be a vector that stores information sure as shooting variations. This suggests that DataFrame lines do n’t have to be impelled to contain values of an analogous form of information, similar as figures, character, sense, etc. with completely different implicit forms of columns.
Seaborn – Histogram:
Histograms represent the distribution of data by making barrels in the data range and also drawing bars to indicate the quantum of illustrations that fall into each caddy.Seaborn comes with other data sets and we’ve used many data sets in our former chapters.
For illustration:
- import pandas as pd.
- import seaborn as sb.
- from matplotlib import py plot as plt.
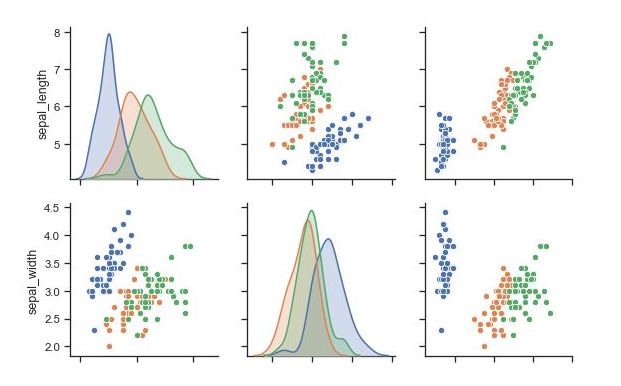
- df = sb.load_dataset( ‘ iris ’).
- ( df( ‘petal_length ’), k de = False).
- plt.show().
Then, the k de flag is set to False. As a result, the representation of the kernel dimension structure will be removed and only the histogram will be created.
Seaborn – Kernel viscosity Conditions:
Kernel Density Estimation( KDE) is a system of measuring job openings for nonstop arbitrary friction. Used for non-parameter analysis.
For illustration:
- import pandas as pd
- import seaborn as sb
- from matplotlib import py plot as plt
- df = sb.load_dataset( ‘ iris ’)
- ( df( ‘petal_length ’), hist = False)
- plt.show()
We always have a large quantity of data, or we may have operations that work with big data, so in order to represent our data in a good way, we can get further data clarity when we need to manage large quantities of data in our operation. So in order to fantasize our data, we can use a water- grounded library from python; grounded on matplotlib only. In the coming section, we will explore further about internal functioning.
Installation of seaborn library for Python:
Needed dependences or conditions for the marine library:
- Python is included with the rearmost interpretation(3.6).
- Numpy should be included with interpretation 1.13.3 or advanced.
- SciPy should be installed with1.0.1 or advanced performances.
- Must have a panda library with 0.22.0 performances or further.
- The statsmodel library should be included with interpretation 0.8.0 or advanced.
- It should also have a matplotlib installed with 2.1.2 or further performances.
- Now, we’re going to learn about examples of introductory armatures that we can do in Python using a library from the ocean.
Conniving Chart Using seaborn Library:
1.Line structure:
The structure of the seaborn line is one of the introductory features featured in the water library. We use the seaborn line structure primarily to fantasize the data handed in a particular time series, that is, in a nonstop way in relation to time.

For illustration:
- Importing the marine library into the system
- import seaborn as sns
- Enter the matplotlib library to display the affair graph
- import matplotlib.pyplot as plt
- Setting style with set function()
- ( style = “ dark ”)
- Using the database() function to declare data type
- FMR = sns.load_dataset( “ fmri ”)
- Editing different responses are different
- # Regions and events
- plot( x = “ time point ”,
- y = “ signal ”,
- color = “ region ”,
- style = “ event ”,
- data = FMR)# uses the line plot() function to construct a line structure
()# using the show() function: description In the law over, after setting the database as the fmri type and the line format setting style, we use the line plot() function to draw the line structure for the affair.
2. position:
We use seaborn dist spots to organize histograms with given inflexibility and data as a result. We can edit histograms with other variations similar as rugplot and k de plot using dist plot.
For illustration:
- import numpy as np library module
- import numpy as np
- Introducing the marine library into the system
- import seaborn as sns
- Enter the matplotlib library to display the affair graph
- import matplotlib.pyplot as plt
- ( style = “ white ”)
- Generate arbitrary fixed distribution
- ru = np.random.RandomState( 10)
- d = ru.normal( size = 100)
- structure = sns.histplot( d, k de = True, color = “ m ”)
- print( layout)
- ()# using the show() function
Advantage and Disadvantage of Seaborn:
Advantages:
- We’ve some advantages of using seaborn in our app as follows; By using a water- grounded library, we can fluently manage our data by structure.
- Baricco invece inserisce nella parte homestretch l’idea di Ulisse di.
- This library is used to view our data; we don’t have to pay attention to internal details; we just have to move our set of data or data within the relplot() function, and it’ll calculate and set the value consequently.
- Develops a cooperative and educational strategy to represent our data; also, this is easy for the stoner to understand and fantasize the records in the app.
- sanguinosa e terribile guerra.
- As it’s grounded on matplotlib so while installing seaborn, we’ve other libraries installed, we’ve matplotlib in it, which also provides a many features and functions to produce interactive python spots.
Disadvantages:
- There’s no similar mistake as using a marine library; one thing we’ve to do is install it because it isn’t built in python.
- Other than that, it has no excesses, and it isn’t a bad thing, but a redundant step to use while planning.
Conclusion:
Data Visibility is a great way to present data, and Seaborn is a handy tool you can have in your toolbox. Built on matplotlib, you can customize your sites in the same way you customize sites created using matplotlib.