
- What is Dimension Reduction? | Know the techniques
- Top Data Science Software Tools
- What is Data Scientist? | Know the skills required
- What is Data Scientist ? A Complete Overview
- Know the difference between R and Python
- What are the skills required for Data Science? | Know more about it
- What is Python Data Visualization ? : A Complete guide
- Data science and Business Analytics? : All you need to know [ OverView ]
- Supervised Learning Workflow and Algorithms | A Definitive Guide with Best Practices [ OverView ]
- Open Datasets for Machine Learning | A Complete Guide For Beginners with Best Practices
- What is Data Cleaning | The Ultimate Guide for Data Cleaning , Benefits [ OverView ]
- What is Data Normalization and Why it is Important | Expert’s Top Picks
- What does the Yield keyword do and How to use Yield in python ? [ OverView ]
- What is Dimensionality Reduction? : ( A Complete Guide with Best Practices )
- What You Need to Know About Inferential Statistics to Boost Your Career in Data Science | Expert’s Top Picks
- Most Effective Data Collection Methods | A Complete Beginners Guide | REAL-TIME Examples
- Most Popular Python Toolkit : Step-By-Step Process with REAL-TIME Examples
- Advantages of Python over Java in Data Science | Expert’s Top Picks [ OverView ]
- What Does a Data Analyst Do? : Everything You Need to Know | Expert’s Top Picks | Free Guide Tutorial
- How To Use Python Lambda Functions | A Complete Beginners Guide [ OverView ]
- Most Popular Data Science Tools | A Complete Beginners Guide | REAL-TIME Examples
- What is Seaborn in Python ? : A Complete Guide For Beginners & REAL-TIME Examples
- Stepwise Regression | Step-By-Step Process with REAL-TIME Examples
- Skewness vs Kurtosis : Comparision and Differences | Which Should You Learn?
- What is the Future scope of Data Science ? : Comprehensive Guide [ For Freshers and Experience ]
- Confusion Matrix in Python Sklearn | A Complete Beginners Guide | REAL-TIME Examples
- Polynomial Regression | All you need to know [ Job & Future ]
- What is a Web Crawler? : Expert’s Top Picks | Everything You Need to Know
- Pandas vs Numpy | What to learn and Why? : All you need to know
- What Is Data Wrangling? : Step-By-Step Process | Required Skills [ OverView ]
- What Does a Data Scientist Do? : Step-By-Step Process
- Data Analyst Salary in India [For Freshers and Experience]
- Elasticsearch vs Solr | Difference You Should Know
- Tools of R Programming | A Complete Guide with Best Practices
- How To Install Jenkins on Ubuntu | Free Guide Tutorial
- Skills Required to Become a Data Scientist | A Complete Guide with Best Practices
- Applications of Deep Learning in Daily Life : A Complete Guide with Best Practices
- Ridge and Lasso Regression (L1 and L2 regularization) Explained Using Python – Expert’s Top Picks
- Simple Linear Regression | Expert’s Top Picks
- Dispersion in Statistics – Comprehensive Guide
- Future Scope of Machine Learning | Everything You Need to Know
- What is Data Analysis ? Expert’s Top Picks
- Covariance vs Correlation | Difference You Should Know
- Highest Paying Jobs in India [ Job & Future ]
- What is Data Collection | Step-By-Step Process
- What Is Data Processing ? A Step-By-Step Guide
- Data Analyst Job Description ( A Complete Guide with Best Practices )
- What is Data ? All you need to know [ OverView ]
- What Is Cleaning Data ?
- What is Data Scrubbing?
- Data Science vs Data Analytics vs Machine Learning
- How to Use IF ELSE Statements in Python?
- What are the Analytical Skills Necessary for a Successful Career in Data Science?
- Python Career Opportunities
- Top Reasons To Learn Python
- Python Generators
- Advantages and Disadvantages of Python Programming Language
- Python vs R vs SAS
- What is Logistic Regression?
- Why Python Is Essential for Data Analysis and Data Science
- Data Mining Vs Statistics
- Role of Citizen Data Scientists in Today’s Business
- What is Normality Test in Minitab?
- Reasons You Should Learn R, Python, and Hadoop
- A Day in the Life of a Data Scientist
- Top Data Science Programming Languages
- Top Python Libraries For Data Science
- Machine Learning Vs Deep Learning
- Big Data vs Data Science
- Why Data Science Matters And How It Powers Business Value?
- Top Data Science Books for Beginners and Advanced Data Scientist
- Data Mining Vs. Machine Learning
- The Importance of Machine Learning for Data Scientists
- What is Data Science?
- Python Keywords

A Day in the Life of a Data Scientist
Last updated on 04th Oct 2020, Artciles, Blog, Data Science
The position of data scientist is one of the most lucrative careers that you could pursue today – it’s highly in-demand in most major industries, and this trend is poised to continue well into the next decade. But what exactly is a data scientist?
Well, the position requires a person who can take a large volume of raw data and extract key elements, discovering patterns and trends that can be used to make accurate predictions for the future. Because the huge increase in the demand for data scientists is very new, as it only happened in the last few years, there’s still a lot of confusion regarding the exact nature of the profession.
So, the question is – what exactly does a data scientist do on a day to day basis? Well, in this article, we’ll explore some of the most critical areas of work that a data scientist focuses on during his day.
Subscribe For Free Demo
Error: Contact form not found.
Problem Solving
With technological advances allowing to automate numerous tasks that previously required manual labor, the most coveted employees of today must have skills that cannot be replicated using software or artificial intelligence. And one of those skills, that’s absolutely critical to data scientists, is problem-solving.
A data scientist that wants to grow and achieve success in his profession must have very strong critical thinking skills and must be adept at solving complex problems creatively.
This requires to maintain a finger on the pulse of the industry and remain ahead of all the newest developments and trends in order to apply the best practices and breakthroughs to their own work. Some of the problems that a data scientist is likely to face won’t have easy solutions – since the profession itself is relatively new, there aren’t yet clear guidelines and best practices that can be used to solve a particular problem.
Instead, the data scientist needs to be able to clearly identify and define the problem, figure out its most challenging aspects, and establish a goal that needs to be achieved to solve the problem. To solve problems effectively, a competent professional in the field must also be able to communicate and collaborate with others, as different specialties and strengths of co-workers can play a vital role in coming up with new angles on how to approach a problem.
Programming
Almost any data science position requires sufficient coding skills, including solid, workable knowledge of at least one of the major programming languages, most commonly Python and/or C++. Programming is an integral part of day-to-day activities because a data scientist will need to perform data cleaning and develop custom algorithms for specific data processing and analysis tasks.
Basically, you will need to customise almost all the tools that you work with, so having the ability to understand the best ways to program is required to make that possible.
What’s more, as a data scientist, you will need to tweak the data analysis models constantly, so having a functional knowledge that allows you to track the changes and see what’s working is essential. Finally, the reason why programming is important lies in the way that the data is presented – rarely, if ever, will a data scientist receive neat data that is ready for processing. Instead, the data will often need to be retrieved, formatted, and prepared for analysis.
Otherwise, trying to sort through the data and gain any meaningful insights would simply become too complicated and time-consuming.
Mathematics and Statistics
As you might have already guessed, math plays a vital role in the field of data science – having academic-level knowledge of the subject is essential if you are going to work with complicated algorithms that allow you to draw actionable insights from raw data.
Often, a data scientist is required to apply foundational mathematics because merely using an API may not work in all situations when analysing data.
But even though math is essential, statistics are even more important – you need to not only have in-depth knowledge of all the fundamentals and core concepts, but also be able to apply them to machine learning applications.
Communication
Finally, as a data scientist, you need to be able to communicate with your colleagues to solve the problems that you are facing and do your job effectively.
In today’s tech world, nothing happens in isolation – different fields are intertwined in countless ways, so it’s almost impossible to expect to be an expert in all of the areas that come up during data science projects.
That’s why you need to be able to share ideas and collaborate with your colleagues and your superiors to maximise the chances of achieving the desired result.
You must also be able to take complex ideas and insights from data analysis and translate them to a language that can be understood by people outside of the scientific community.
Being able to tell a story that resonates with decision-makers and makes the message easy to understand is crucial.
The inability to present the insights and predictions gained by data science will defeat the entire purpose of the process – for it to be meaningful, the business has to be willing to act on those insights and trust their validity.
At the same time, the data scientist must be able to interview the stakeholders of the business to gain a deep understanding of the problem so that he gets a better idea of where to look for its solutions.
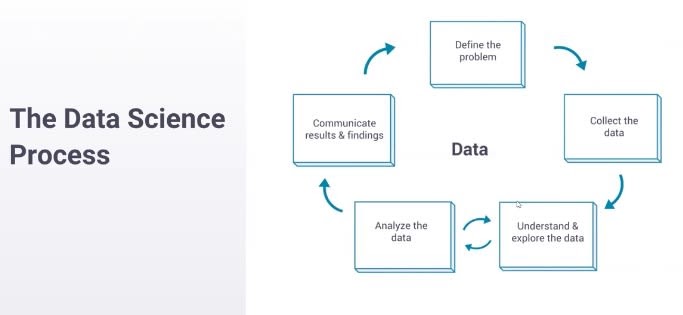
You start by defining a problem. You start with something that you want to understand better or a question that you want to answer. You move on to collecting data to answer that question. Then you enter this loop at the bottom here, where you oscillate between understanding the data and exploring the data—so, making some assertion about the data and then analyzing whether that’s true and whether you really do understand, and then going back and forth until you feel like you completely understand what the data is saying. Then you move on to communicating your results—and this is where you take what you’ve learned and you make it something that the company can use.
We have this feature called container tabs. It allows you to isolate personas when you’re online so you can have your work Gmail and your personal Gmail sitting next to each other and they don’t know that they’re both in the same browser, for example. So, I’ll take you through how we would actually analyze whether this change is useful. This is a pretty canonical data science question, at least at a tech company where we’re trying to run A/B experiments and figure out what features are good for our users.
1. Understand the problem: We start by understanding the problem, and this usually looks like sitting down with the person who owns this feature, who built this feature, and asking them: what does it do, what are you concerned about, how could this break the user experience, and what do you think this is going to do for your users? How would you characterize success, what does a happy user look like, how do we win? So, we sit down in this meeting and I’m trying to build an understanding of what this feature is and then how we’re going to measure it.
2. Collecting data: Once I understand why they’re coming to me—are they trying to figure out if this feature is good? Are they trying to figure out if this feature is good enough to launch (which is kind of a different question)? Are they trying to figure out if it causes pages to crash—maybe a more narrow question? Once I understand what they’re trying to figure out, I can help them collect data.
So in this example, they want to answer some question of causation. They want to know if launching this feature is good for the user, produces more users, produces happier users, or something like that. And because they’re trying to establish some type of causation like that, we need to run an experiment, which is different than—a lot of questions are just descriptive, right? So they’re asking questions like: how many users do we have in Germany? That’s something that we can answer quickly without running an experiment. We can just query the database and figure out the answer. This needs more. We need to separate users into groups, apply treatment, and understand what the actual effect is.
Something that we deal with at Mozilla that’s maybe [unique] to our process is that we spend a lot of time working on maintaining user privacy. We spend a lot of time thinking about: what’s the minimum amount of data that we can collect to be able to make sure that this is actually good for our users? This produces a bunch of data science questions that are difficult to answer. Can we fuzz the data to make sure we never know what one person did or can we just ask for, maybe, counts of websites instead of which websites? This adds a lot of complexity to the data collection process.
3. Understanding the data: To summarize, we understand the problem, we’ve decided that we’re going to run an experiment, we launch an experiment, we collect some data. Moving on, once we have some data, we need to understand it. This process, like I said before, looks a lot like an oscillation.
So, we start off by making some assertion about the data: OK, there should be like a million rows in this data set. And then you look and you see there’s 15 million and you’re like, that’s not what I expected there to be. There’s an assertion there and there’s an analysis to figure out whether your assertion’s right and you just go through these frequently. OK, there’s 15 million instead of 1 million; what’s going on there? Oh, there’s more users enrolled than I thought there would be because there are more people in Germany than I thought there would be. And you just keep oscillating through this until you come to a pretty complete understanding what the data say.
So, you say something along the lines of: why do these users leave, why is this metric so noisy? You say, oh there are outliers. The outliers are because of bots, so we can remove that. Until finally you have some complete understanding of the story. And if somebody asks you a question about the data, you can say: yeah, no, that’s not really a problem.
4. Communicating the results: Once you understand the data, you need to work on communicating the results so that other people can act on them. So this can be, you know, going into every meeting that people have about this feature and explaining why it’s good or bad. Usually, it’s more effective to produce some report and make a launch/no launch assertion. So you say: this is good because of these reasons, this is what we observed, this is how we measured.
Something that I’ve been working on recently is building these reports effectively. And one of the things that I’ve been working on is building archival-quality reports, reports that don’t look different 10 years from now, which is unusually difficult to do when you’re working with something that’s on the internet, right? Things move, things break, things change. But the goal here is to be able to take what you’ve learned, put it down on paper so it distributes to a bunch of different people, so they can read and understand and change the way that they make decisions, and document this so well that in a few years we can reverse the decision that you suggested if everything’s changed that’s, like, the gold standard of giving a great experiment report.
After talking through the life of an example project, Ryan discussed some of the tools he might use to accomplish that work.
You’re going to need some programming language Python is what I use right now because it’s supported by our team. We have really good support for PySpark, which is the Python interface for Spark. Previously I’ve used R and I’ve been very happy with it. I use Jupyter notebooks a lot for exploration, but when I’m trying to communicate results or distill my knowledge I usually do it in Markdown or GDocs. And if it’s in Markdown, then it’s on GitHub, stored in Git.
These are some of the tools you’ll run into. These I think are pretty standard and useful across the industry. There are definitely more niche tools and the tool chains for data scientists are very, very varied because there are so many different types of jobs.
But what does a single day in the life of a data scientist like Ryan look like? He explains:
My time’s roughly split evenly between analysis, meetings, and review.
Analysis is me actually doing computation, writing queries, trying to gauge something about the universe that isn’t understood right now.
Meetings and scoping analyses are understanding the problem and communicating my results. I spend a lot of time in meetings trying to draw value from the analyses that I’ve done.
And then separately I spend a lot of time reviewing and answering questions for other folks. This can be something as simple as writing a quick query for a question that doesn’t need a lot of work or reviewing some more junior analyst’s analysis, or maybe even some PM’s analysis.
This changes with seniority. I’m a fairly senior now. When I started, I was doing a lot more analysis, a lot more drawing numbers, a lot more building reports. As I’ve moved up I’ve produced more reviews. More senior people do a lot of reviews; mid-levels a lot of meetings, communicating, making sure the processes work.