
- Most Popular SAP SuccessFactors Interview Questions and Answers
- [BEST & NEW] Business Management Interview Questions and Answers
- [ STEP-IN ] SAP BusinessObjects Cloud Interview Questions and Answers
- 80+ [REAL-TIME] Base Sas Interview Questions
- 100+ SAP Bodi Interview Questions & Answers
- [ TO GET HIRED ] PowerApps Interview Questions and Answers
- Must-Know [LATEST] Denodo Interview Questions and Answers
- [BEST & NEW] SAP Business One Interview Questions and Answers
- [FREQUENTLY ASK] SAP BI ABAP Interview Questions and Answers
- [BEST & NEW] Hyperion Planning Interview Questions and Answers
- 50+ Best SAP CS Interview Questions and Answers
- Get [LATEST] Boxi Interview Questions and Answers
- 50+ Best SAP E-Recruitment Interview Questions and Answers
- Get [LATEST] SAP SuccessFactors LMS Interview Questions and Answers
- 50+ Best SAP EHS Interview Questions and Answers
- SAP ECM Interview Questions and Answers [ TOP & MOST ASKED ]
- SAP FSCM Interview Questions and Answers [ FRESHERS ]
- Must-Know [LATEST] SIEBEL Business Analyst Interview Questions and Answers
- [FREQUENTLY ASK] Looker Interview Questions and Answers
- [BEST & NEW] SAP GTS Interview Questions and Answers
- 40+ REAL-TIME Anaplan Interview Questions and Answers
- [BEST & NEW] SAP BPC Interview Questions and Answers
- SAP Adobe Forms Interview Questions and Answers [SCENARIO-BASED ]
- Most Popular Alteryx Interview Questions and Answers [ SOLVED ]
- 50+ REAL-TIME SAP GRC Interview Questions and Answers
- SAP APO Interview Questions and Answers [ STEP-IN ]
- [FREQUENTLY ASK] SAP PM Interview Questions and Answers
- Top 30+ Splunk Admin Interview Questions and Answers
- 50+ Best Hyperion Financial Management Interview Questions and Answers
- Get SAP QM Interview Questions and Answers [BEST & NEW]
- Best SAS BI Interview Questions and Answers [LEARN NOW]
- [ TOP & MOST ASKED ] SAP ABAP on HANA Interview Questions and Answers
- Top SAP FIORI Interview Questions and Answers
- [50+] SAP FICA Interview Questions and Answers [ TO GET HIRED ]
- 30+ REAL-TIME Crystal Reports Interview Questions and Answers
- Browse [LATEST] SAP PI Interview Questions and Answers
- [ TOP & MOST ASKED ] SAP UI5 Interview Questions and Answers
- 30+ Best Jaspersoft Interview Questions [FREQUENTLY ASK]
- Business Objects Interview Questions and Answers
- SAS Interview Questions and Answers
- Splunk Interview Questions and Answers
- MSBI Developer Interview Questions and Answers
- SAP FICO Interview Questions and Answers
- SSAS Interview Questions and Answers
- SAP CRM Interview Questions and Answers
- SAP HR Interview Questions and Answers
- SAP Workflow Interview Questions and Answers
- SAP PP Interview Questions and Answers
- Dimensional Data Modeling Interview Questions and Answers
- SAP Bank Analyzer Interview Questions and Answers
- SAP ESS MSS Interview Questions and Answers
- SAP BI Interview Questions and Answers
- SAP WM Interview Questions and Answers
- SAP BI/BO Interview Questions and Answers
- Advanced SAS Interview Questions and Answers
- Appian Interview Questions and Answers
- SAP AFS Interview Questions and Answers
- SAP Retail Interview Questions and Answers
- SAP Security Interview Questions and Answers
- SAP COPA Interview Questions and Answers
- Pentaho Interview Questions and Answers
- SAP Material Management Interview Questions and Answers
- SAP BI/BW Interview Questions and Answers
- SAP SD Interview Questions and Answers
- SAP HANA Interview Questions and Answers
- Cognos Interview Questions and Answers
- QlikView Interview Questions and Answers
- MicroStrategy Interview Questions and Answers
- Business Analyst Interview Questions and Answers
- Qlik Sense Interview Questions and Answers
- Talend Interview Questions and Answers
- ETL Testing Interview Questions
- SSRS Interview Questions and Answers
- Tally Interview Questions and Answers
- OBIEE Interview Questions and Answer
- MSBI Interview Questions and Answers
- Power BI Interview Questions and Answers
- Tableau Interview Questions and Answers

MSBI Developer Interview Questions and Answers
Last updated on 23rd Oct 2020, Blog, Business Analytics, Interview Question
If you’re one among those looking for MSBI jobs then your next move should be towards wisdom jobs for a right go. MSBI being the most efficient business intelligence tool preferred almost every company either big or small for data mining, business intelligence and queries has a great future scope for the individuals working on it. Increases are the job opportunities with the increase in advancements in the tool. So, get ready to be well knowledged of the advancements for some exciting opportunities on MSBI that are listed on wisdomjobs.com. Apart from just the job details you can also get access to MSBI knowledge center, assignments to test your skills, resume models, cover letter templates etc on our job portal. Visit MSBI jobs interview questions and answers page so as to face the interview to come with great confidence.
1. What Is Ms Bi (microsoft Business Intelligence)?
Ans:
Microsoft Business Intelligence (BI) is a suite of products and tools that you can use to monitor, analyze and plan your business by using scorecards, dashboards, management reporting and analytics.
2. What Are The Tools In Ms Bi?
Ans:
It contains the following tools:
- SQL Server Analysis Services (SSAS)
- SQL Server Integration Services (SSIS)
- SQL Server Reporting Services (SSRS)
- Performance Point Services (PPS) which was added as a free service in Microsoft Office SharePoint 2010.
3. What Is Ssis? How It Related With Sql Server?
Ans:
- SQL Server Integration Services (SSIS) is a component of SQL Server which can be used to perform a wide range of Data Migration and ETL operations. SSIS is a component in MSBI process of SQL Server.
- This is a platform for Integration and Workflow applications. It is known for a fast and flexible OLTP and OLAP extensions used for data extraction, transformation, and loading (ETL). The tool may also be used to automate maintenance of SQL Server databases and multidimensional data sets.
4. What Are The Tools Associated With Ssis?
Ans:
- We use Business Intelligence Development Studio (BIDS) and SQL Server Management Studio (SSMS) to work with Development of SSIS Projects.
- We use SSMS to manage the SSIS Packages and Projects.
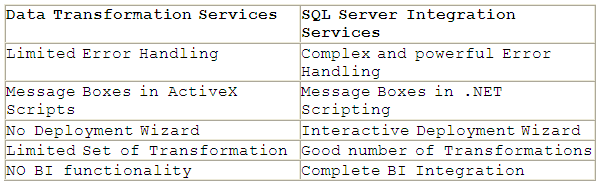
5. What Are The Differences Between Dts And Ssis?
6. What Is A Workflow In Ssis ?
Ans:
Workflow is a set of instructions on to specify the Program Executor on how to execute tasks and containers within SSIS Packages.
7. What Is The Control Flow?
Ans:
A control flow consists of one or more tasks and containers that execute when the package runs. To control order or define the conditions for running the next task or container in the package control flow, we use precedence constraints to connect the tasks and containers in a package. A subset of tasks and containers can also be grouped and run repeatedly as a unit within the package control flow. SQL Server 2005 Integration Services (SSIS) provides three different types of control flow elements: Containers that provide structures in packages, Tasks that provide functionality, and Precedence Constraints that connect the executables, containers, and tasks into an ordered control flow.
8. What Is A Data Flow?
Ans:
A data flow consists of the sources and destinations that extract and load data, the transformations that modify and extend data, and the paths that link sources, transformations, and destinations. The Data Flow task is the executable within the SSIS package that creates, orders, and runs the data flow. A separate instance of the data flow engine is opened for each Data Flow task in a package. Data Sources, Transformations, and Data Destinations are the three important categories in the Data Flow.
Subscribe For Free Demo
Error: Contact form not found.
9. How Does Error-handling Work In Ssis?
Ans:
When a data flow component applies a transformation to column data, extracts data from sources, or loads data into destinations, errors can occur. Errors frequently occur because of unexpected data values.
Type of typical Errors in SSIS:
- Data Connection Errors, which occur in case the connection manager cannot be initialized with the connection string. This applies to both Data Sources and Data Destinations along with Control Flows that use the Connection Strings.
- Data Transformation Errors, which occur while data is being transformed over a Data Pipeline from Source to Destination.
- Expression Evaluation errors, which occur if expressions that are evaluated at run time perform invalid.
10. What Is Environment Variable In Ssis?
Ans:
- An environment variable configuration sets a package property equal to the value in an environment variable.
- Environmental configurations are useful for configuring properties that are dependent on the computer that is executing the package.
11. What Are The Transformations Available In Ssis?
Ans:
- AGGEGATE – It applies aggregate functions to Record Sets to produce new output records from aggregated values.
- AUDIT – Adds Package and Task level Metadata – such as Machine Name, Execution Instance, Package Name, Package ID, etc.
- CHARACTER MAP – Performs SQL Server level makes string data changes such as changing data from lower case to upper case.
- CONDITIONAL SPLIT – Separates available input into separate output pipelines based on Boolean Expressions configured for each output.
- COPY COLUMN – Add a copy of column to the output we can later transform the copy keeping the original for auditing.
- DATA CONVERSION – Converts columns data types from one to another type. It stands for Explicit Column Conversion.
- DATA MINING QUERY – Used to perform data mining query against analysis services and manage Predictions Graphs and Controls.
- DERIVED COLUMN – Create a new (computed) column from given expressions.
- EXPORT COLUMN – Used to export a Image specific column from the database to a flat file.
- FUZZY GROUPING – Used for data cleansing by finding rows that are likely duplicates.
- FUZZY LOOKUP – Used for Pattern Matching and Ranking based on fuzzy logic.
- IMPORT COLUMN – Reads image specific column from database onto a flat file.
- LOOKUP – Performs the lookup (searching) of a given reference object set against a data source. It is used for exact matches only.
- MERGE – Merges two sorted data sets into a single data set into a single data flow.
- MERGE JOIN – Merges two data sets into a single dataset using a join junction.
- MULTI CAST – Sends a copy of supplied Data Source onto multiple Destinations.
- ROW COUNT – Stores the resulting row count from the data flow / transformation into a variable.
- ROW SAMPLING – Captures sample data by using a row count of the total rows in dataflow specified by rows or percentage.
- UNION ALL – Merge multiple data sets into a single dataset.
- PIVOT – Used for Normalization of data sources to reduce analomolies by converting rows into columns
- UNPIVOT – Used for demoralizing the data structure by converts columns into rows incase of building Data Warehouses.
12. How To Log Ssis Executions?
Ans:
SSIS includes logging features that write log entries when run-time events occur and can also write custom messages. This is not enabled by default. Integration Services supports a diverse set of log providers, and gives you the ability to create custom log providers. The Integration Services log providers can write log entries to text files, SQL Server Profiler, SQL Server, Windows Event Log, or XML files. Logs are associated with packages and are configured at the package level. Each task or container in a package can log information to any package log. The tasks and containers in a package can be enabled for logging even if the package itself is not.
13. How Do You Deploy Ssis Packages?
Ans:
BUILDing SSIS Projects provides a Deployment Manifest File. We need to run the manifest file and decide whether to deploy this onto File System or onto SQL Server [ msdb]. SQL Server Deployment is very faster and more secure then File System Deployment. Alternatively, we can also import the package from SSMS from File System or SQ Server.
14. What Are Variables And What Is Variable Scope ?
Ans:
Variables store values that a SSIS package and its containers, tasks, and event handlers can use at run time. The scripts in the Script task and the Script component can also use variables. The precedence constraints that sequence tasks and containers into a workflow can use variables when their constraint definitions include expressions. Integration Services supports two types of variables: user-defined variables and system variables. User-defined variables are defined by package developers, and system variables are defined by Integration Services. You can create as many user-defined variables as a package requires, but you cannot create additional system variables.
15. Can You Name Five Of The Perfmon Counters For Ssis And The Value They Provide?
Ans:
- SQLServer:SSIS Service
- SSIS Package Instances
- SQLServer:SSIS Pipeline
- BLOB bytes read
- BLOB bytes written
- BLOB files in use
- Buffer memory
- Buffers in use
- Buffers spooled
- Flat buffer memory
- Flat buffers in use
- Private buffer memory
- Private buffers in use
- Rows read
- Rows written.
16. What Is Analysis Services? List Out The Features?
Ans:
Microsoft SQL Server 2005 Analysis Services (SSAS) delivers online analytical processing (OLAP) and data mining functionality for business intelligence applications. Analysis Services supports OLAP by letting we design, create, and manage multidimensional structures that contain data aggregated from other data sources, such as relational databases. For data mining applications, Analysis Services lets we design, create, and visualize data mining models that are constructed from other data sources by using a wide variety of industry-standard data mining algorithms.
Analysis Services is a middle tier server for analytical processing, OLAP, and Data mining. It manages multidimensional cubes of data and provides access to heaps of information including aggregation of data. One can create data mining models from data sources and use it for Business Intelligence also including reporting features.
Analysis service provides a combined view of the data used in OLAP or Data mining. Services here refer to OLAP, Data mining. Analysis services assists in creating, designing and managing multidimensional structures containing data from varied sources. It provides a wide array of data mining algorithms for specific trends and needs.
Some of the key features are:
- Ease of use with a lot of wizards and designers.
- Flexible data model creation and management
- Scalable architecture to handle OLAP
- Provides integration of administration tools, data sources, security, caching, and reporting etc.
- Provides extensive support for custom applications.
17. What Is Udm? Its Significance In Ssas?
Ans:
The role of a Unified Dimensional Model (UDM) is to provide a bridge between the user and the data sources. A UDM is constructed over one or more physical data sources, and then the end user issues queries against the UDM using one of a variety of client tools, such as Microsoft Excel. At a minimum, when the UDM is constructed merely as a thin layer over the data source, the advantages to the end user are a simpler, more readily understood model of the data, isolation from heterogeneous backend data sources, and improved performance for summary type queries. In some scenarios a simple UDM like this is constructed totally automatically. With greater investment in the construction of the UDM, additional benefits accrue from the richness of metadata that the model can provide.
The UDM provides the following benefits:
- Allows the user model to be greatly enriched.
- Provides high performance queries supporting interactive analysis, even over huge data volumes.
- Allows business rules to be captured in the model to support richer analysis.
18. What Is The Need For Ssas Component?
Ans:
- Analysis Services is the only component in SQL Server using which we can perform Analysis and Forecast operations.
- SSAS is very easy to use and interactive.
- Faster Analysis and Troubleshooting.
- Ability to create and manage Data warehouses.
- Apply efficient Security Principles.
19. Explain The Two-tier Architecture Of Ssas?
Ans:
- SSAS uses both server and client components to supply OLAP and data mining functionality BI Applications.
- The server component is implemented as a Microsoft Windows service. Each instance of Analysis Services implemented as a separate instance of the Windows service.
- Clients communicate with Analysis Services using the standard the XMLA (XML For Analysis) , protocol for issuing commands and receiving responses, exposed as a web service.
20. What Are The Components Of Ssas?
Ans:
- An OLAP Engine is used for enabling fast ad hoc queries by end users. A user can interactively explore data by drilling, slicing or pivoting.
- Drilling refers to the process of exploring details of the data.
- Slicing refers to the process of placing data in rows and columns.
- Pivoting refers to switching categories of data between rows and columns.
- In OLAP, we will be using what are called as Dimensional Databases.
21. What Is Fasmi ?
Ans:
A database is called a OLAP Database if the database satisfies the FASMI rules :
- Fast Analysis– is defined in the OLAP scenario in five seconds or less.
- Shared – Must support access to data by many users in the factors of Sensitivity and Write Backs.
- Multidimensional – The data inside the OLAP Database must be multidimensional in structure.
- Information – The OLAP database Must support large volumes of data.
22. What Languages Are Used In Ssas ?
Ans:
- Structured Query Language (SQL)
- Multidimensional Expressions (MDX) – an industry standard query language orientated towards analysis.
- Data Mining Extensions (DMX) – an industry standard query language oriented toward data mining.
- Analysis Services Scripting Language (ASSL) – used to manage Analysis Services database objects.
23. How Cubes Are Implemented In Ssas ?
Ans:
- Cubes are multidimensional models that store data from one or more sources.
- Cubes can also store aggregations.
- SSAS Cubes are created using the Cube Wizard.
- We also build Dimensions when creating Cubes.
- Cubes can see only the DSV( logical View).
24. What Is The Difference Between A Derived Measure And A Calculated Measure?
Ans:
The difference between a derived measure and a calculated measure is when the calculation is performed. A derived measure is calculated before aggregations are created, and the values of the derived measure are stored in the cube. A calculated measure is calculated after aggregations are created, and the values of a calculated measure aren’t stored in the cube. The primary criterion for choosing between a derived measure and a calculated measure is not efficiency, but accuracy.
25. What Is A Partition?
Ans:
A partition in Analysis Services is the physical location of stored cube data. Every cube has at least one partition by default. Each time we create a measure group, another partition is created. Queries run faster against a partitioned cube because Analysis Services only needs to read data from the partitions that contain the answers to the queries. Queries run even faster when partition also stores aggregations, the pre calculated totals for additive measures. Partitions are a powerful and flexible means of managing cubes, especially large cubes.
26. While Creating A New Calculated Member In A Cube What Is The Use Of Property Called Non-empty Behavior?
Ans:
Nonempty behavior is important property for ratio calculations. If the denominator is empty, an MDX expression will return an error just as it would if the denominator Were equal to zero. By selecting one or more measures for the Non-Empty Behavior property, we are establishing a requirement that each selected measure first be evaluated before the calculation expression is evaluated. If each selected measure is empty, then the expression is also treated as empty and no error is returned.

Get Comprehensive Microsoft Business Intelligence Training to Build Your Skills
- Instructor-led Sessions
- Real-life Case Studies
- Assignments
27. What Is A Ragged Hierarchy?
Ans:
Under normal circumstances, each level in a hierarchy in Microsoft SQL Server 2005 Analysis Services (SSAS) has the same number of members above it as any other member at the same level. In a ragged hierarchy, the logical parent member of at least one member is not in the level immediately above the member. When this occurs, the hierarchy descends to different levels for different drilldown paths. Expanding through every level for every drilldown path is then unnecessarily complicated.
28. What Are The Roles Of An Analysis Services Information Worker?
Ans:
The role of an Analysis Services information worker is the traditional “domain expert” role in business intelligence (BI) someone who understands the data employed by a solution and is able to translate the data into business information. The role of an Analysis Services information worker often has one of the following job titles: Business Analyst (Report Consumer), Manager (Report Consumer), Technical Trainer, Help Desk/Operation, or Network Administrator.
29. What Are The Different Ways Of Creating Aggregations?
Ans:
We can create aggregations for faster MDX statements using Aggregation Wizard or through UBO – Usage Based Optimizations. Always, prefer UBO method in real time performance troubleshooting.
30. What Is Writeback? What Are The Pre-conditions?
Ans:
The Enable/Disable Writeback dialog box enables or disables writeback for a measure group in a cube. Enabling writeback on a measure group defines a writeback partition and creates a writeback table for that measure group. Disabling writeback on a measure group removes the writeback partition but does not delete the writeback table, to avoid unanticipated data loss.
31. What Is Processing?
Ans:
Processing is a critical and resource intensive operation in the data warehouse lifecycle and needs to be carefully optimized and executed. Analysis Services 2005 offers a high performance and scalable processing architecture with a comprehensive set of controls for database administrators.
We can process an OLAP database, individual cube, Dimension or a specific Partition in a cube.
32. Name Few Business Analysis Enhancements For Ssas?
Ans:
The following table lists the business intelligence enhancements that are available in Microsoft SQL Server 2005 Analysis Services (SSAS). The table also shows the cube or dimension to which each business intelligence enhancement applies, and indicates whether an enhancement can be applied to an object that was created without using a data source and for which no schema has been generated.
33. What Mdx Functions Do You Most Commonly Use?
Ans:
This is a great question because you only know this answer by experience. If you ask me this question, the answer practically rushes out of me. “CrossJoin, Descendants, and NonEmpty, in addition to Sum, Count, and Aggregate. My personal favorite is CrossJoin because it allows me identify non-contiguous slices of the cube and aggregate even though those cube cells don’t roll up to a natural ancestor.” Indeed, CrossJoin has easily been my bread and butter.
34. How Do I Find The Bottom 10 Customers With The Lowest Sales In 2003 That Were Not Null?
Ans:
Simply using bottomcount will return customers with null sales. You will have to combine it with NONEMPTY or FILTER.
SELECT { [Measures].[Internet Sales Amount] } ON COLUMNS ,- BOTTOMCOUNT(
- NONEMPTY(DESCENDANTS( [Customer].[Customer Geography].[All Customers]
- , [Customer].[Customer Geography].[Customer] )
- , ( [Measures].[Internet Sales Amount] ) )
- , 10
- , ( [Measures].[Internet Sales Amount] )
- ) ON ROWS
- FROM [Adventure Works]
- WHERE ( [Date].[Calendar].[Calendar Year].&[2003] ) ;
35. How In Mdx Query Can I Get Top 3 Sales Years Based On Order Quantity?
Ans:
By default Analysis Services returns members in an order specified during attribute design. Attribute properties that define ordering are “OrderBy” and “OrderByAttribute”. Lets say we want to see order counts for each year. In Adventure Works MDX query would be:
SELECT {[Measures].[Reseller Order Quantity]} ON 0- , [Date].[Calendar].[Calendar Year].Members ON 1
- FROM [Adventure Works];
Same query using TopCount:
SELECT- {[Measures].[Reseller Order Quantity]} ON 0,
- TopCount([Date].[Calendar].[Calendar Year].Members,3,
- [Measures].[Reseller Order Quantity]) ON 1
- FROM [Adventure Works];
36. How Do You Extract First Tuple From The Set?
Ans:
Use could usefunction Set.Item(0)
Example:
SELECT {{[Date].[Calendar].[Calendar Year].Members- }.Item(0)}
- ON 0
- FROM [Adventure Works]
37. How Can I Setup Default Dimension Member In Calculation Script?
Ans:
You can use ALTER CUBE statement.
Syntax:
ALTER CUBE CurrentCube | YourCubeName UPDATE DIMENSION <dimension name>,- DEFAULT_MEMBER='<default member>’;
38. Differences Between Script Task & Script Component And Its Advantages?
Ans:
Script task is control flow level item where as script component is data flow level item, both of the functionalities are same. This 2 are very powerful items in SSIS.
Normally we can implement custom code by using these components. By using this two items we can perform any action like DML operations on the data from DB, file and we can do any operation using c# or vb.net code we can use it as Source, destination as well.

Advance Your Skills with Microsoft Business Intelligence Certification Course
Weekday / Weekend BatchesSee Batch Details
39. What Is A Master Package?
Ans:
Master package is nothing but it is also a normal SSIS package, it act like a master to run the all other (child) packages. If you call the other SSIS packages in a new SSIS package using ‘Execute Package Task’, the new package called as master package. The use of this package(Master) is, instead of running all individual packages if we can run the single master package, then automatically all the child packages will run. Normally we simply schedule the master package in Sql server agent by adding the all child packages values in the master package config file.
40. Difference B/w Cube-deploy And Process?
Ans:
Once you build the cube in the BIDS, we can say the structure of the cube is created. So once the cube structure is built we need to deploy the structure to the actual Sql server analysis server. This process is called DEPLOYMENT of cube. (like creating one object(table) in the relational database).
So once you deploy the structure to the SSAS server, we need to load the data into the structure we have created. This process of loading data into the cube and creating the aggregations is called Cube processing.(like inserting the data into your table) So to make a cube online for the user for querying we need to build the structure of the cube in BIDS and deploy it to a SSAS server and the process it to load with data and aggregations, then the user can query on the SSAS cube.
41. What Is The Use Of Data Source View?
Ans:
Data Source Views (DSV) have been introduced in SQL Server Analysis Services (SSAS) 2005. A DSV is a metadata layer between the cube and the underlying data source that allows us to build our cubes without being connected to the underlying source.
42. Differences Between Calculated Members And Calculated Measures?
Ans:
- Member is nothing but column on dimension table. Measure is nothing but column on fact table.
- The term calculated member refers to the creation of any MDX object through a calculation. The calculated member can be part of the measures dimension where a simple MDX expression such as addition or subtraction of two or more base measures results in a new measure. Such calculated members on the measure dimension are referred to as calculated measures.
- Calculated Member is related to the Dimension where as calculated Measure is related to the measure in measure group.
43. What Are The Types Of Parameters In Ssrs?
Ans:
The types of parameters in SSRS are:
- Single value parameters
- Multi value parameters
- Cascading parameters.
Advance Your Skills with Microsoft Business Intelligence Certification Course
Weekday / Weekend BatchesSee Batch Details
44. Difference B/w View And Materialized View?
Ans:
Views
- A view takes the output of a query and makes it appear like a virtual table. You can use a view in most places where a table can be used.
- All operations performed on a view will affect data in the base table and so are subject to the integrity constraints and triggers of the base table.
- A View can be used to simplify SQL statements for the user or to isolate an application from any future change to the base table definition. A View can also be used to improve security by restricting access to a predetermined set of rows or columns.
- In addition to operating on base tables, one View can be based on another, a view can also JOIN a view with a table (GROUP BY or UNION).
Materialized Views
- Materialized views are schema objects that can be used to summarize, precompute, replicate, and distribute data. E.g. to construct a data warehouse.
- A materialized view provides indirect access to table data by storing the results of a query in a separate schema object. Unlike an ordinary view, which does not take up any storage space or contain any data.
- The existence of a materialized view is transparent to SQL, but when used for query rewrites will improve the performance of SQL execution. An updatable materialized view lets you insert, update, and delete.
45. What Is Hyperion? Is It An Olap Tool?
Ans:
- It’s an Business Intelligence tools. Like Brio which was an independent product bought over my Hyperion has converted this product name to Hyperion Intelligence.
- Yes. You can analyze data schemas using this tools.
46. What Is The Difference Between Olap And Etl Tools?
Ans:
- OLAP: It’s an online analytical processing tool. There are various products available for data analysis.
- ETL: Extract, Transform and Load. This is a product to extract the data from multiple/single source transform the data and load it into a table, flat file or simply a target.
47. What Is Olap?
Ans:
OLAP – On-Line Analytical Processing.
Designates a category of applications and technologies that allow the collection, storage, manipulation and reproduction of multidimensional data, with the goal of analysis.
48. What Is Molap?
Ans:
MOLAP – Multidimensional OLAP.
This term designates a Cartesian data structure more specifically. In effect, MOLAP contrasts with ROLAP. In the former, joins between tables are already suitable, which enhances performances. In the latter, joins are computed during the request.
Targeted at groups of users because it’s a shared environment. Data is stored in an exclusive server-based format. It performs more complex analysis of data.
49. What Is Dolap?
Ans:
DOLAP – Desktop OLAP.
Small OLAP products for local multidimensional analysis Desktop OLAP. There can be a mini multidimensional database (using Personal Express), or extraction of a datacube (using Business Objects).
Designed for low-end, single, departmental user. Data is stored in cubes on the desktop. It’s like having your own spreadsheet. Since the data is local, end users don’t have to worry about performance hits against the server.
50. What Is Rolap?
Ans:
ROLAP – Relational OLAP.
Designates one or several star schemas stored in relational databases. This technology permits multidimensional analysis with data stored in relational databases. Used for large departments or groups because it supports large amounts of data and users.
51. What Is Holap?
Ans:
HOLAP: Hybridization of OLAP.
52. Explain About Auditing In Bo Xi R2? What Is The Use Of It?
Ans:
Auditor is used by the business objects administrators to know the complete information of the business intelligence system.
- It monitors the entire system at a glance.
- Analyzes usage and change impact.
- optimises the BI deployment.
- In BOXI, auditing is not a complete package – Desktop Intelligence reports are not completely audited due to the fact these reports are not always held within XI’s repository (well, that and other reasons related to XI’s architecture), however WEBI reports will be fully audited.
53. Why We Can’t Create An Aggregate On An Ods Object?
Ans:
- Operational Data Store has very low data latency. Data moved to ODS mostly on event based rather than time based ETL to Data Warehouse/Data Mart.
- ODS is more closer to OLTP system. We don’t normally prefer to store aggregated data in OLTP. So it is with ODS.
- Unlike data warehouse where data is HISTORICAL, ODS is near real time(NRT). So data aggregation is less important is ODS as data keeps changing.
54. How Do You Define Multiple Queries In A Document?
Ans:
You can create multiple queries by using Data Provider option available in the reporting tool.
55. What Is A Universe?
Ans:
A “universe” is a “Business object” terminology. Business objects also happens to be the name of the company. The universe is the interfacing layer between the client and the data warehouse . The universe defines the relationship among the various tables in the data warehouse.
56. What Is Business Intelligence?
Ans:
Business intelligence (BI) is a broad category of application programs and technologies for gathering, storing, analyzing, and providing access to data to help enterprise users make better business decisions. BI applications include the activities of decision support, query and reporting, online analytical processing (OLAP), statistical analysis, forecasting, and data mining.
57. How Do We Enhance The Functionality Of The Reports In Bo?
Ans:
You can format the BO Reports by using various features available. You can turn the table reports into a 2-Dimensional or 3-Dimensional charts. You can apply an Alert to show some data in a different format, based on some business rule. You can also create some prompts, which will asks user to give some input values before seeing the reports, this way they will see only filtered data. There are many similar exciting options available to enhance the reports.
58. What Are Dashboards?
Ans:
Dashboard is a user interface that organizes and presents information in a way that is easy to read. It’s a reporting tool that consolidates aggregates and arranges measurements metrics.
59. Explain The Concepts And Capabilities Of Business Intelligence?
Ans:
Business Intelligence is all about processes, skills, technologies, practices and applications used for supporting decision making.
Business Intelligence applications could perform.
- Centrally initiated by the business needs.
- It includes decision support system, query reporting, OLAP, data mining, forecasting.
60. Name Some Of The Standard Business Intelligence Tools In The Market?
Ans:
The following are the standard Business Intelligence tools in the market:
- BUSINESS OBJECTS CRYSTAL REPORTS
- MICRO STRATEGY
- MS-OLAP SERVICES
- COGNOS REPORT NET.
61. Explain The Dashboard In The Business Intelligence?
Ans:
Dashboard in business intelligence is used for rapid prototyping, cloning and deployment for all databases, operational applications or spread sheets through an organization.
A dashboard in BI allows an enterprise’s status/position, heading to, by using graphs, maps and chars. The drill-down and roll-over capabilities allows organizing things without revealing important information. It is fully customizable, including free-form design options. Dashboard consolidates vital statistics of business into an easy-to-read page.
62. Explain The Sql Server 2005 Business Intelligence Components?
Ans:
- SQL Server Integration Services:- Used for data transformation and creation. Used in data acquisition form a source system.
- SQL Server Analysis Services: Allows data discovery using data mining. Using business logic it supports data enhancement.
- SQL Server Reporting Services:- Used for Data presentation and distribution access.
63. Explain The Advantages Of Business Performance Management?
Ans:
BPM is very useful in analyzing the current performance of your business. After analyzing the performance of different operations in your organization you can easily identify the various areas where you need to focus on in order to increase the profits and Revenue.
This process will certainly help you in preparing yourself for the future strategies which in turn will help you in competitive advantage and taking corrective effective decisions at the right time.
64. What Is The Main Use Of Business Content? How Data Can Be Loaded Into Business Content After Installation?
Ans:
- Business content can come from various parts of your business operations. Some from the finance department and some from the sales department.
- If these business content are consistent and can be used by both departments then it’s all about loading the data into a data warehouse for analysis purposes.
- In case data are inconsistent and can’t be easily compared, then a data integration tool would help to integrate data from various data sources before it is loaded into the data warehouse.
65. What Do You Mean By Conditional Reports?
Ans:
A conditional report is based on the data gathered, then analyzed during the report generation, which reports out results of the analysis in the report’s output.
66. What Is Flat Aggregation?
Ans:
If you create an Aggregate with more than 16 characteristics, then we call that aggregate as FLAT Aggregate. When an aggregate is active then new data is not available for reporting, these aggregates are called Flat Aggregates.